LAB 2: Phototransistors and Display
Objectives
Materials
IR Light emission and detection (Part 1)
- Robot
- 3 Phototransistors
- Long breadboard
- Signal generator
- Oscilloscope
- 3 x 2kΩ resistor
- IR LED + resistor
Base Station Display (Part 2)
- Arduino nanao board
- 4 x PNP transistors (2N3906)
- 4 x 4.6kΩ resistor
- SN74HC595N shift register
- MM jump wires
- One 4-digit 7-segment display
- 8 x 330Ω resistors
Procedure
of building and testing an IR light detection circuit with
Phototransistors. the second part was building the display
component of the base station.
Part I: Light Detection and Frequency Measurement
The parts needed for the light detection were
gathered.
Three phototransistors were placed on the robot (one on
its left, forward and right sides). This was to allow the
robot to detect and measure treasures from these direction.
Then, one phototransistor's circuit was build on the robot's
main breadboard.
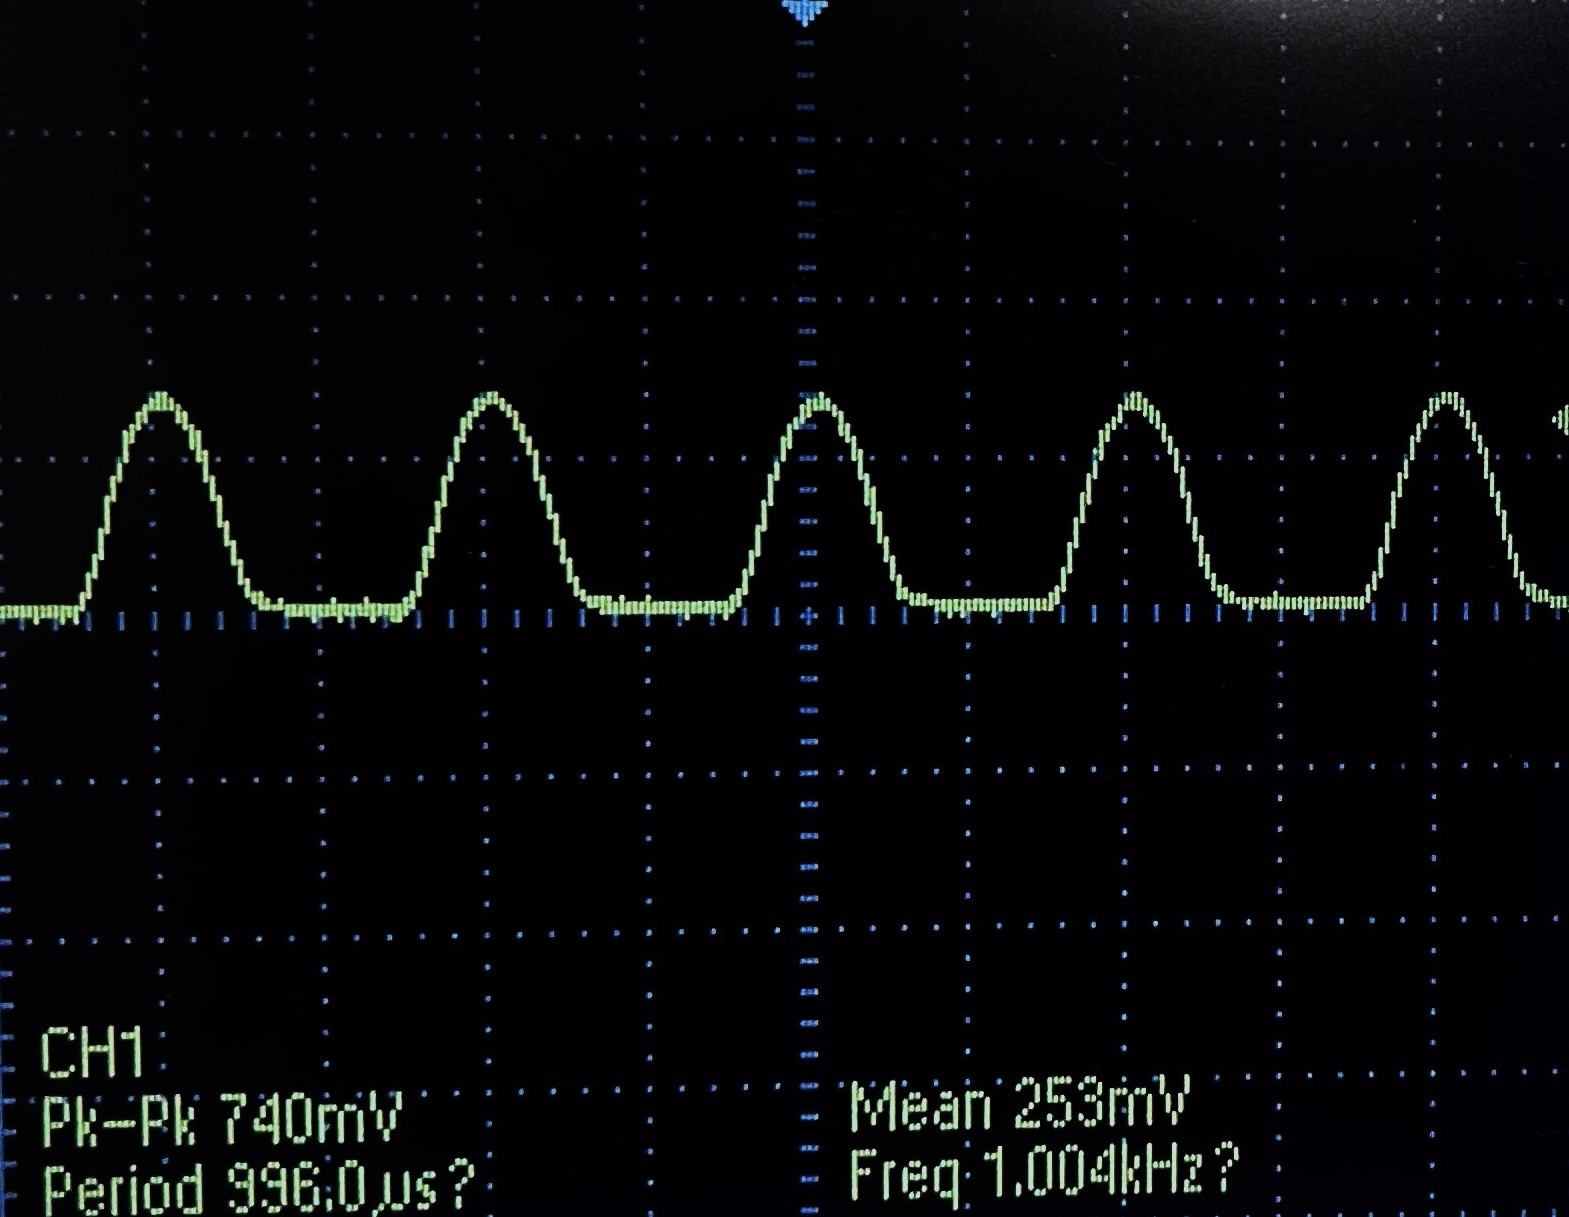
Small Circuit with Infrared LED
Oscilloscope's trace at 1kH
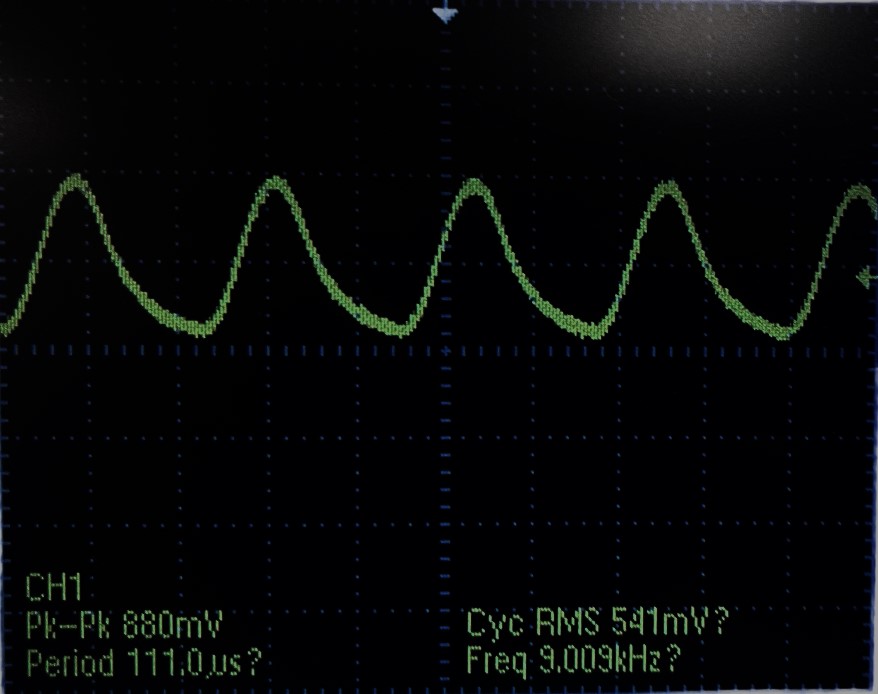
Oscilloscope's trace at 9kHz
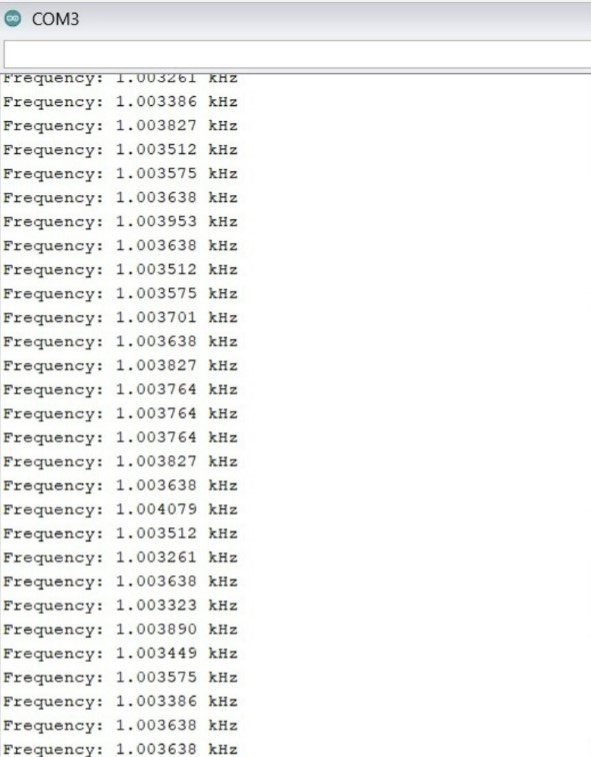
Thirdly, the previously built phototransistor's circuit output was connected to the analog pin A1 of the Nano Every board on the robotframe. The integrated peripherals analog comparator and TCB of the Nano were used to measured the frequency of the IR signal. The measured frequencies were displayed on the serial monitor (Fig. 3) withthe signal generator set to 1kHz. It is worth mentioning that we built off our implementation from the AC_readPhototran code provided in lecture. Upon testing the one phototransistor circuit, the other two phototransistor circuits were completed. Each cicuit was connected to an individual analog pin on the Nano. For testing, the code was updated to cycle through each phototransistor and determine if there was an IR signal. If present, the measured frequencies were displayed on the serial monitor.
Serial Monitor Display 1kHz
Part II:4-Digit 7-Segment Display
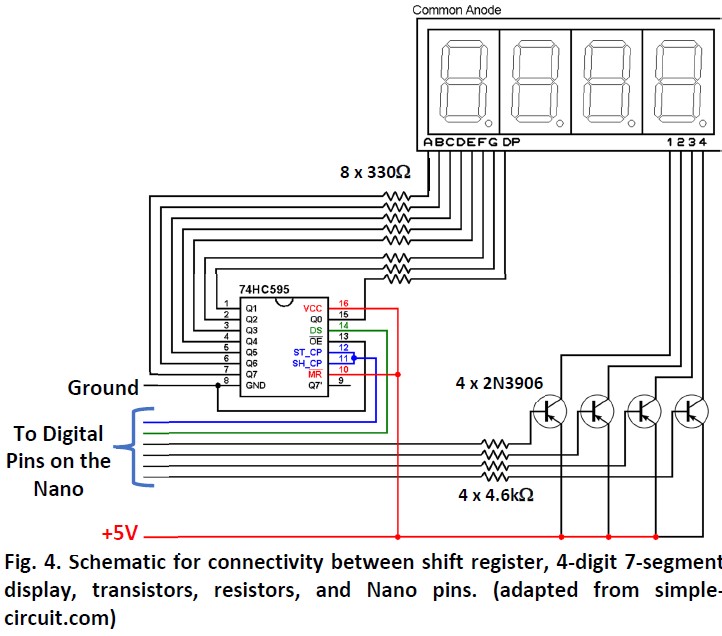
In this section of the lab, the shift register, 7-segment display circuit was built as shown below. The outputs of the 7-segment display were connected pins D2-D8 on the Nano.
7-segment Schematic
7-segment Display: 2468
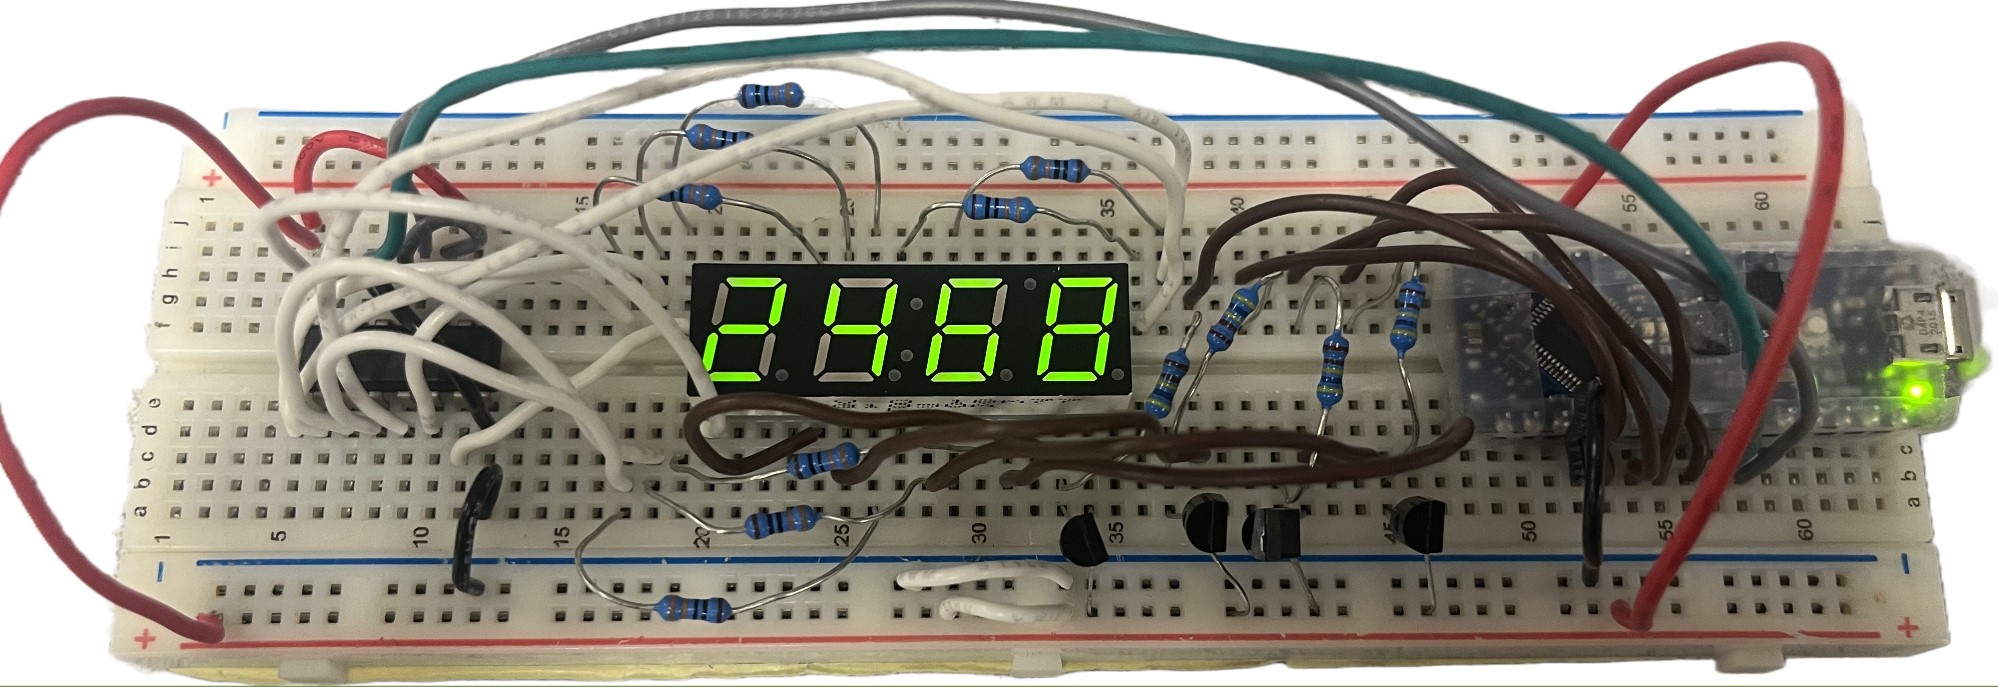
Testing the 7-segment Display
The circuit was tested by displaying whole and decimal numbers.