Introduction
Ocean is a mysterious place, and many people are obsessed with the ocean blue and its tide that goes up and down. With all three of the group members growing up in cities by the sea, our group decided to build our project based on the sea tide. Our motivation for this project is not simply just our deep connection and love to the sea, but also we aim to use this project to tell people about how tide grows and fade significantly during the day, which this growth creates substantial energy that is known as tidal energy. We hope that through this project, more people could learn about the eco-friendly tidal energy and raise awareness of sustainability and power of nature.
In general, our system works by sending tidal data from the FRDM-KL46Z board using skills we learned this semester, and then use the arduino to receive and process the data, which finally controlls the LED strip to turn on and off showcasing the tide.
In this project, we accomplished and practices a lot of skills that we learn in this class. For example, in hardware, we practiced wire soldering a lot in the project. Then, in the FRDM-KL46Z code, we accomplished sending data using UART serial communication, as well as the real-time scheduling that we learned by the end of the semester. Finally, in Arduino code, we accomplished receiving data in UART, as well as data decode and other programming skills.
System Overview
We first obtain the tide data from the tide data website. Then, we would clean up and find the tide data we need, which are: tide_value and trend. The FRDM board sends tuples of tide data to an Arduino Mega through UART in the form of (tide_value, trend) while using real-time scheduling; where the tide_value indicates the actual tide height, and the trned indicates if the tide is going up or down. The Arduino receives the message and decodes it. The message is then sent to the LED strips from the Arduino, which prompts the LED strips to light up and darken in the desired way.
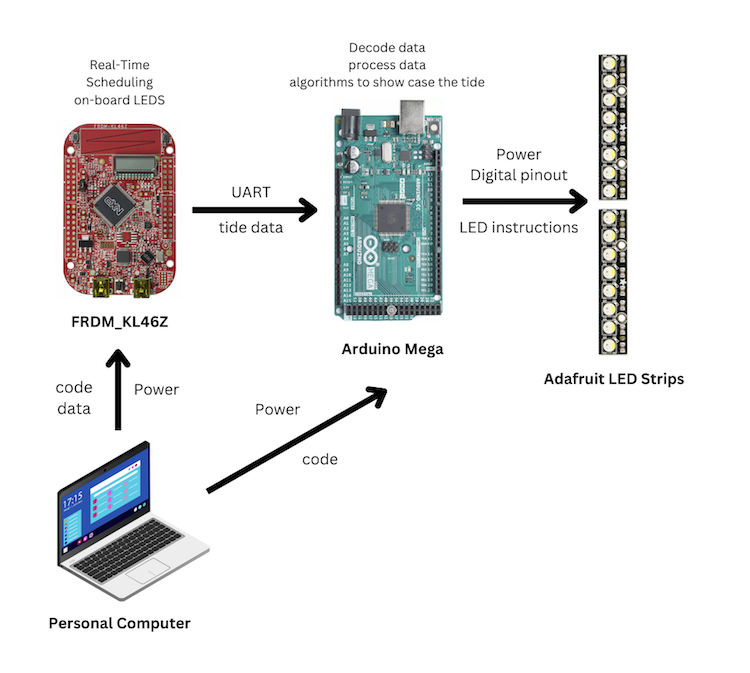
System block diagram
Video Demo
Below is the link to our Project Demo Video:
Technical Description
Our project is mainly made up of the following section: UART communication, Real-time Scheduling, data processing and LED strip control.
First, for the UART communication, we did write the code for both the FRDM board which is sending the data, and the Arduino Mega which
is receiving the data. For the code on FRDM board, we first initialize the board so that it is ready for the UART serial communication. We
utilized some built-in or given functions to initialize the pins and clocks of the board in the function init_uard(). Then we used the
helper example code provided by ECE3140. Function uart_putc(char ch) waits until the serial is available for port UART0 and then send
the characters in uint_8 decoded characters one by one. Function uart_puts(char *ptr_str) used uard_putc(char ch) as a helper function,
and used a loop to send a character list using pointer. With uart_puts(*ptr_str), we would be able to send our desired data messages as a whole.
For the code on Arduino mega, we first defined the receive buffer and then defined an character array to store the actual decoded results.
Since the data from the FRDM board are sent using uint_8, our receive buffer would also be in uint_8. Since the tide data we send have a fixed
length, which is (VAL.D,+/-T), counts are 10 bits, and since the sent data from the board has /n as the ending, the final length of the message
and the receive buffer is 12 bits. We then setup the receive baud rate of Serial 1, our desired receive port, which is 115200 same as the send
baud rate on the board. When Serial 1 is available, we would read the data that it receives by byte, and then store all of them in the receive buffer.
The FRDM board uses its UART0 pin of Tx and the Arduino mega uses its Serial1 pin of Rx, these 2 pins, as well as the ground of the 2 boards are
connected in order to achieve the serial connection, so our UART communication would process successfully.
Second, for the Real-time scheduling, we utilized our implementation for lab 5, so most of the functions are dealt with there already,
such as process_select(), process_start(), and process_rt_create(), as well as the corresponding helper function, so we will not go into the
details of these.
For the code on the FRDM board, we created function trend_led(trend) to evaluate if the current tide trend is going
up or down. If it is going up, the red LED on the board will toggle, if it is going down, the green one would toggle, while
if the trend is 0, both LEDs would toggle. Then we created 6 real-time processes, each representing the typical tide data during each hour,
and in the processes we also included trend_led(trend). In our main code, we would run these processes in real time, and the lab5 code will
help manage the processes.
Third, for the data processing, the code generally belongs to Arduino. First, we would decode the received data in the receive buffer
from uint_8 to char. We store the decoded data in character list msg, and then split the list into 2 parts, the first part is our tide_value,
and the second part is our trend. We used the C++ built-in function atof(num) to traslate the message from characters to float number. And then
we would use some self-defined values, as well as the received tide_value to calculate level, which is a float number we will use to
show our LED strip.
Finally, for the LED control, the code all belongs to Arduino. Our LED strip hardwares are Adafruit NeoPixel Sticks, so to gain control
of the LED strip, we imported the library Adafruit_NeoPixel.h. Since 1 strip has only 8 LEDs, in order for it to behave similar to a clock,
we initially decided to use 3 to for 24 LEDs, but unfortunatelly, one of them broke, so our final implementation has 2 strips soldered together,
with one of them connected to the Arduino on 1 digital pin, the 5V power and then Ground.
We first initialize the LED strip by using given functions from the Adafruit NeoPixel library. Since we would like the LED to show
the tide corresponding towards how high it is, which is our level variable, we would use the value of level, which is a fraction,
with the total number of LED pixels on the strip to get the number of pixels that should be on each time. Then we would use the given
funcion from the library to control the LED strip. Since we would like the strip to give a waving impression on the user, we would look
at the variable trend, and then control the pixels to increase its intensities and go back to normal one by one in the same direction
as the tide trend. With these functionalities, our LED strip would be able to show the tide successfully.
The FRDM-KL46Z code mentioned above are all in file board.c, and the arduino code are all in tide.ino.
Testing
Similar to the process of building the project, our testing is also devided into the following parts:UART communication, Real-time Scheduling, data processing and LED strip control.
First, in UART communication, we tested using the Serial monitor on the Arduino on our laptops to print out our received messages,
and then check by that if we are receiving the correct data from the FRDM board. Firstly, we made sure that the sample contents of
the provided code could be transfered successfully. After seeing that there are value comming through, and it looks correct,
we started continuously sending values from the board to the Arduino in the tuple form, and modified the value in the process
to see if the values we read from the serial monitor is exactly the same as what we intended to send. At first, since we are reading
by bytes in uint_8, the data we received were all strange long numbers, which made us thought our code was wrong. But afterwards, we
realized that we need to decode the data, which at last resulted in interpretable data. However, it seems that some part of the tuple
is not received, we can only see part of the message. This then during other testings, such as sending other random messages, turned out
to be the buffer size problem. Since we have /n at the end of each message, the buffer size should also be 2 bits longer than the actual data.
Second, the real-time scheduling part is mainly completed in lab5, we did check before hand and made sure this part is working alright as in lab 5.
Then, in order to check if our trend_led() is working alright along with the scheduling, we wrote the full code, and then started
the RT process scheduling to see if the LED on the board turns on as we expected, and the result turned out that the lights turn
on and off correctly according to the trend value, and the processes also perform in our desired sequence, so the implementation could
be said as successful.
Thrid, for the testing of decoding and data processing, after each decode stage and data process or calculation state, we would print out the result data on the Serial monitor of the arduino, and see if it corresponds to the correct value that we wanted. This part of the testing went smoothly, and every processing passed and confirmed to be working after a few tries with different input values.
In the LED strip control part, we first tested if the LED is working, so we uploaded the default sample code provided in the library. After seeing the strip turning on successfully, we started by testing if the LED strip level turns on as we expected. After testing several input values of different magnitides, the number of pixels turning on is all correct. Then, we tested whether the intensity of the strip changes according to the trend, we tried both up trend, down trend and no trend, and the strip behaves just as we expected. Therefore, the testing of this part is also fully completed.
Finally, we tested the full system together by inputting data from the FRDM board and then seeing if the on-board LED, as well as the LED strip turns on as we expected. Everything works alright in the final testing state, and our implementation and testing stage is completed.
Work Distribution
All three group members worked together in the project. We meet during the week very often, and then would spend sometimes a few hours or sometimes a whole day on the project. When we are not working together, we would use email or group chat to communicate with each other. When we are working together, we would talk about our ideas and how we want to code things before we start to make sure that every group member are on the same line. For more detailed distribution, Vivian worked the most on hardware, such as soldering, and also worked mainly on the UART code on the FRDM-KL46Z board. Janna worked the most work on real-time scheduling and testing. Rachel mainly worked on the Arduino LED control and the website. So in general the work is distributed evenly among members.
Additional Resources Used
During the process of working on the project, we referenced some different sources of code to help with our implementation.