Coffee attribute and region
A statistical research using R, INFO2950 SP23
awesome-buneary
Shuqian Lyu, April Chen, Aindri Patra,
Muhammad Dossani, Siying Cui
5/3/23
Topic and motivation
The group was interested in the relationship between coffee quality and region.
Research question: “How does coffee’s aroma, flavor, acidity, sweetness, and total score depend on their original country and region?”
The data
https://think.cs.vt.edu/corgis/csv/coffee/
Created in University of Virginia, to solve the lack of high-quality, real-world datasets that are interesting and engaging to use for pedagogical purposes.
The selected data set is “coffee.” According to the website, this data comes from Buzzfeed Data Scientist James LeDoux, and were collected from “the Coffee Quality Institute’s review pages in January 2018.” Earliest data is from 2010.
The data set consists of categorical (bean types and country) and numerical data (acidity, sweetness, etc). Each observation contains the specific data of one type of coffee, and the attributes. Limited in the countries covered.
The team pre-processed the data by renaming the attributes (column names) into more explicit and self-explanatory ones. This data set solely consists of data of coffee, hence we do not expect to (and did not) encounter ethical issues while working on the data.
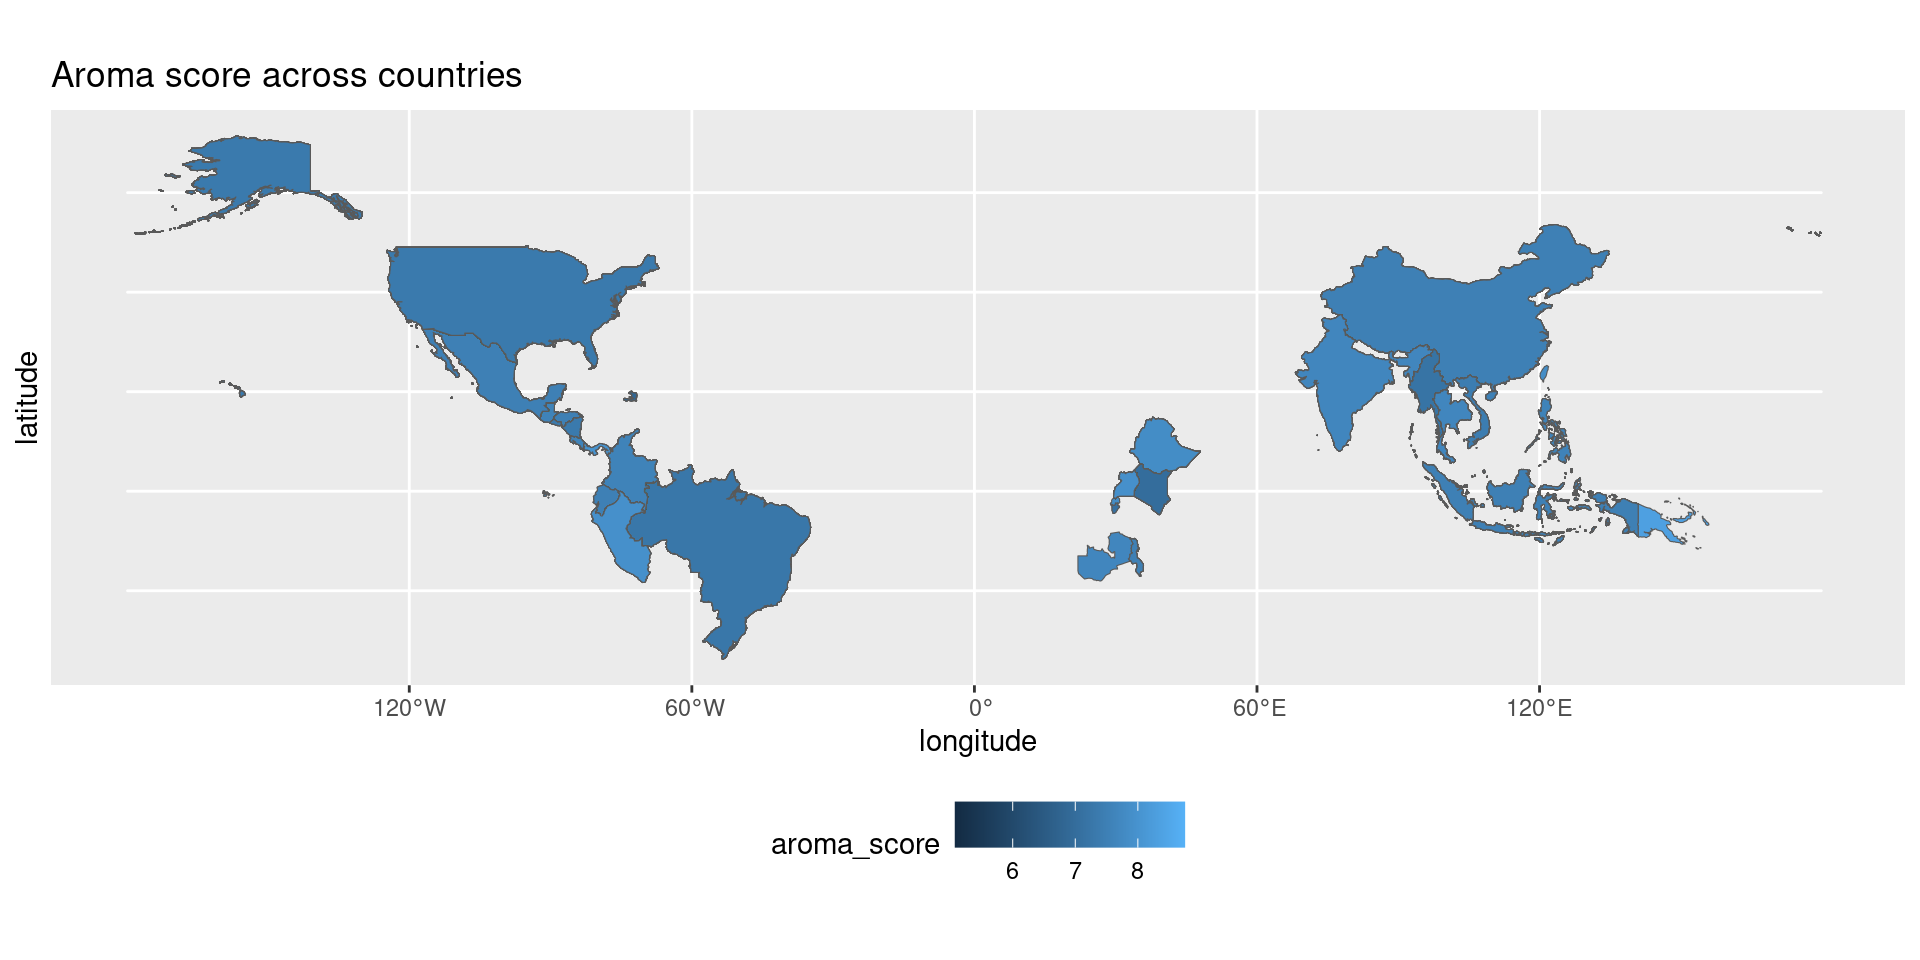
Highlights from EDA
![]()
There does not appear to be any region that is highly associated with a high aroma score.
Analysis 1:
- Objective: Predict coffee country based on coffee attributes (acidity, sweetness, moisture, etc.)
- Data: Coffee dataset with aroma, flavor, aftertaste, acidity, balance, sweetness, moisture, and total scores
- Method: Random Forest Classification
- Train/Test Split: 90% training data, 10% testing data
  .pred_class acidity_score aroma_score flavor_score aftertaste_score
1      Mexico           5.2         0.7          5.4              9.6
  balance_score sweetness_score moisture_score total_score
1           5.3             4.4            0.3         3.8
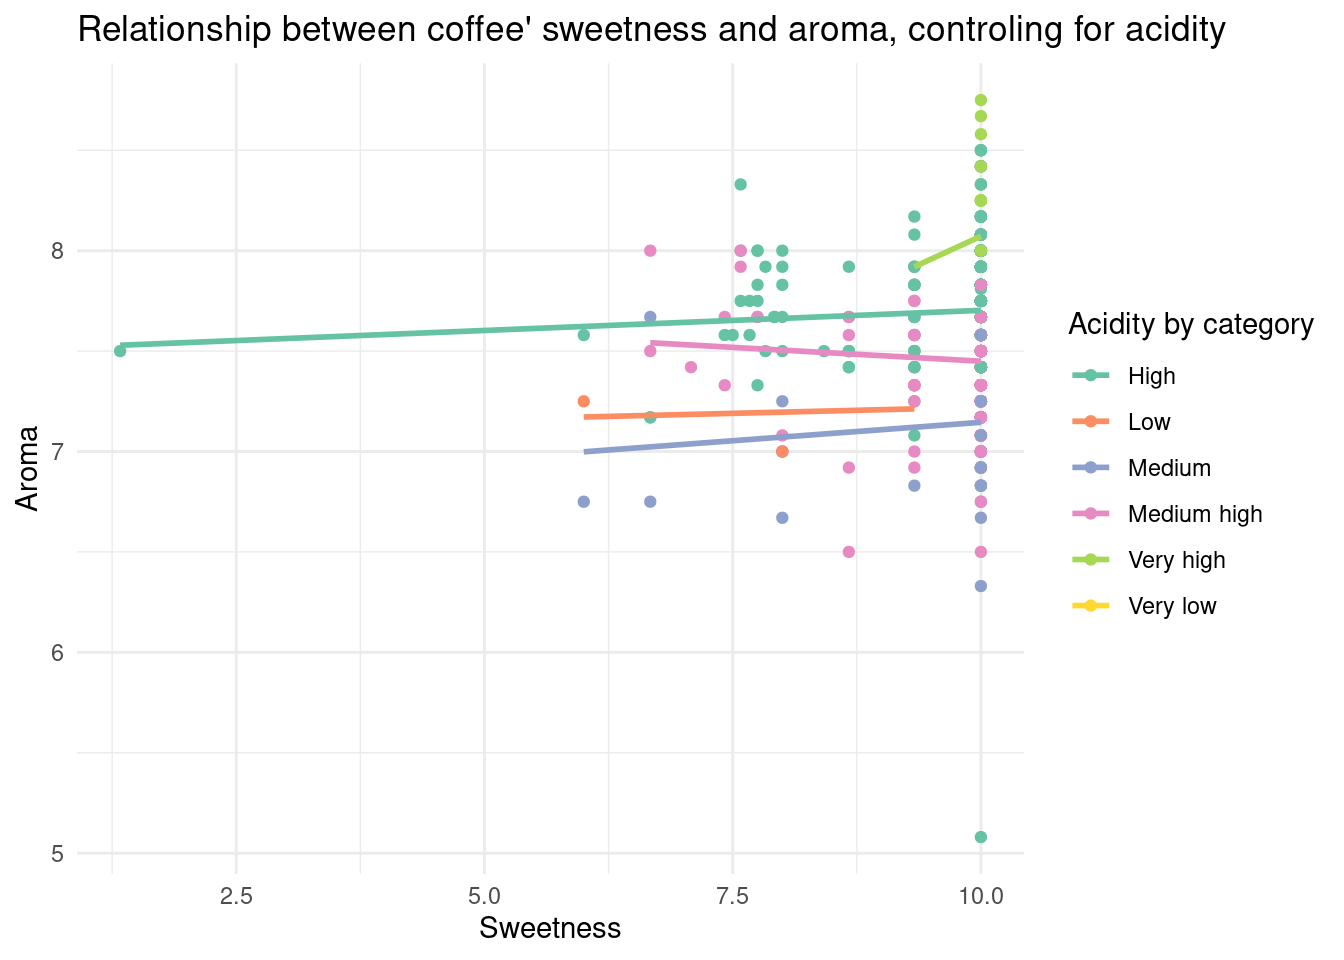
Analysis 2:
Relationship between coffee aroma and sweetness, controlling for acidity
\[
H_0: \beta_1 = 0
\]
\[
H_1: \beta_1 \neq 0
\]
# A tibble: 3 × 5
  term            estimate std.error statistic   p.value
  <chr>              <dbl>     <dbl>     <dbl>     <dbl>
1 (Intercept)      3.00       0.220     13.7   4.22e- 39
2 sweetness_score  0.00268    0.0129     0.207 8.36e-  1
3 acidity_score    0.603      0.0250    24.1   1.73e-101
# A tibble: 3 × 3
  term          lower_ci upper_ci
  <chr>            <dbl>    <dbl>
1 acidity_score   -0.147    0.153
2 aroma_score     -0.157    0.144
3 intercept        8.81    10.9
Conclusions + future work
Because of our accurate random forest model, we can conclude that these taste attributes (aroma, acidity, flavor, aftertaste, balance, sweetness, moisture, and overall score) combined have some type of relationship with each other, which allows them predict a country of origin for coffee type accurately when they are put in as predictors for this model.
We can use these results to infer more about the preferences of the global coffee market, and to understand how our data analysis plays out in the real world where coffee production is higher in certain regions as compared to others.
It would be interesting to see a dataset of coffee ratings which included qualitative feedback alone, or qualitative feedback combined with the quantitative scores that represent the coffee types (Ex: Create a dataset with a new criterion for qualitative data).
In the future, continuing to combine human methods of coffee grading with analyzing these grades through machine-trained models to predict each coffee type’s tendencies in terms of location, production rates, and so on.