An Analysis of NYPD Arrest Data
Trends in Perpetrator Characteristics
Emmett Patterson, Ciara Malamug, Dennison Qu
5/1/23
An Introduction to Our Research Project
For our research project we decided to analyze the 2022 arrest data for NYC and see if we could find some noticeable trends or patterns. Our motivation for choosing the dataset was to see the effectiveness of law enforcement and assessing racial and socioeconomic disparities to understand if there were biases. Some questions we asked were:
- Is there a relationship between crime perpetrator characteristics and the level of offense they are charged with?
- Is there is a relationship between borough and crime perpetrator characteristics?
- Is there a relationship between date/time of year and the number of arrests made?
A Glimpse of our Data
# A tibble: 6 × 12
  ARREST_KEY ARREST_DATE PD_CD PD_DESC       KY_CD OFNS_DESC LAW_CODE LAW_CAT_CD
       <dbl> <chr>       <dbl> <chr>         <dbl> <chr>     <chr>    <chr>
1  239553009 01/23/2022    464 JOSTLING        230 JOSTLING  PL 1652… M
2  239922214 01/31/2022    397 ROBBERY,OPEN…   105 ROBBERY   PL 1601… F
3  239939130 02/01/2022    105 STRANGULATIO…   106 FELONY A… PL 1211… F
4  240521791 02/13/2022    101 ASSAULT 3       344 ASSAULT … PL 1200… M
5  241022365 02/21/2022    397 ROBBERY,OPEN…   105 ROBBERY   PL 1600… F
6  242064428 03/14/2022    105 STRANGULATIO…   106 FELONY A… PL 1211… F
# ℹ 4 more variables: ARREST_BORO <chr>, AGE_GROUP <chr>, PERP_SEX <chr>,
#   PERP_RACE <chr>
Each row is a individual arrest.
Each column represents a different tracked variable. The ones we chose to keep pertained to perpetrator characteristics (race, sex), the date and time of the arrest, and the classification of the crime committed.
Highlights from EDA


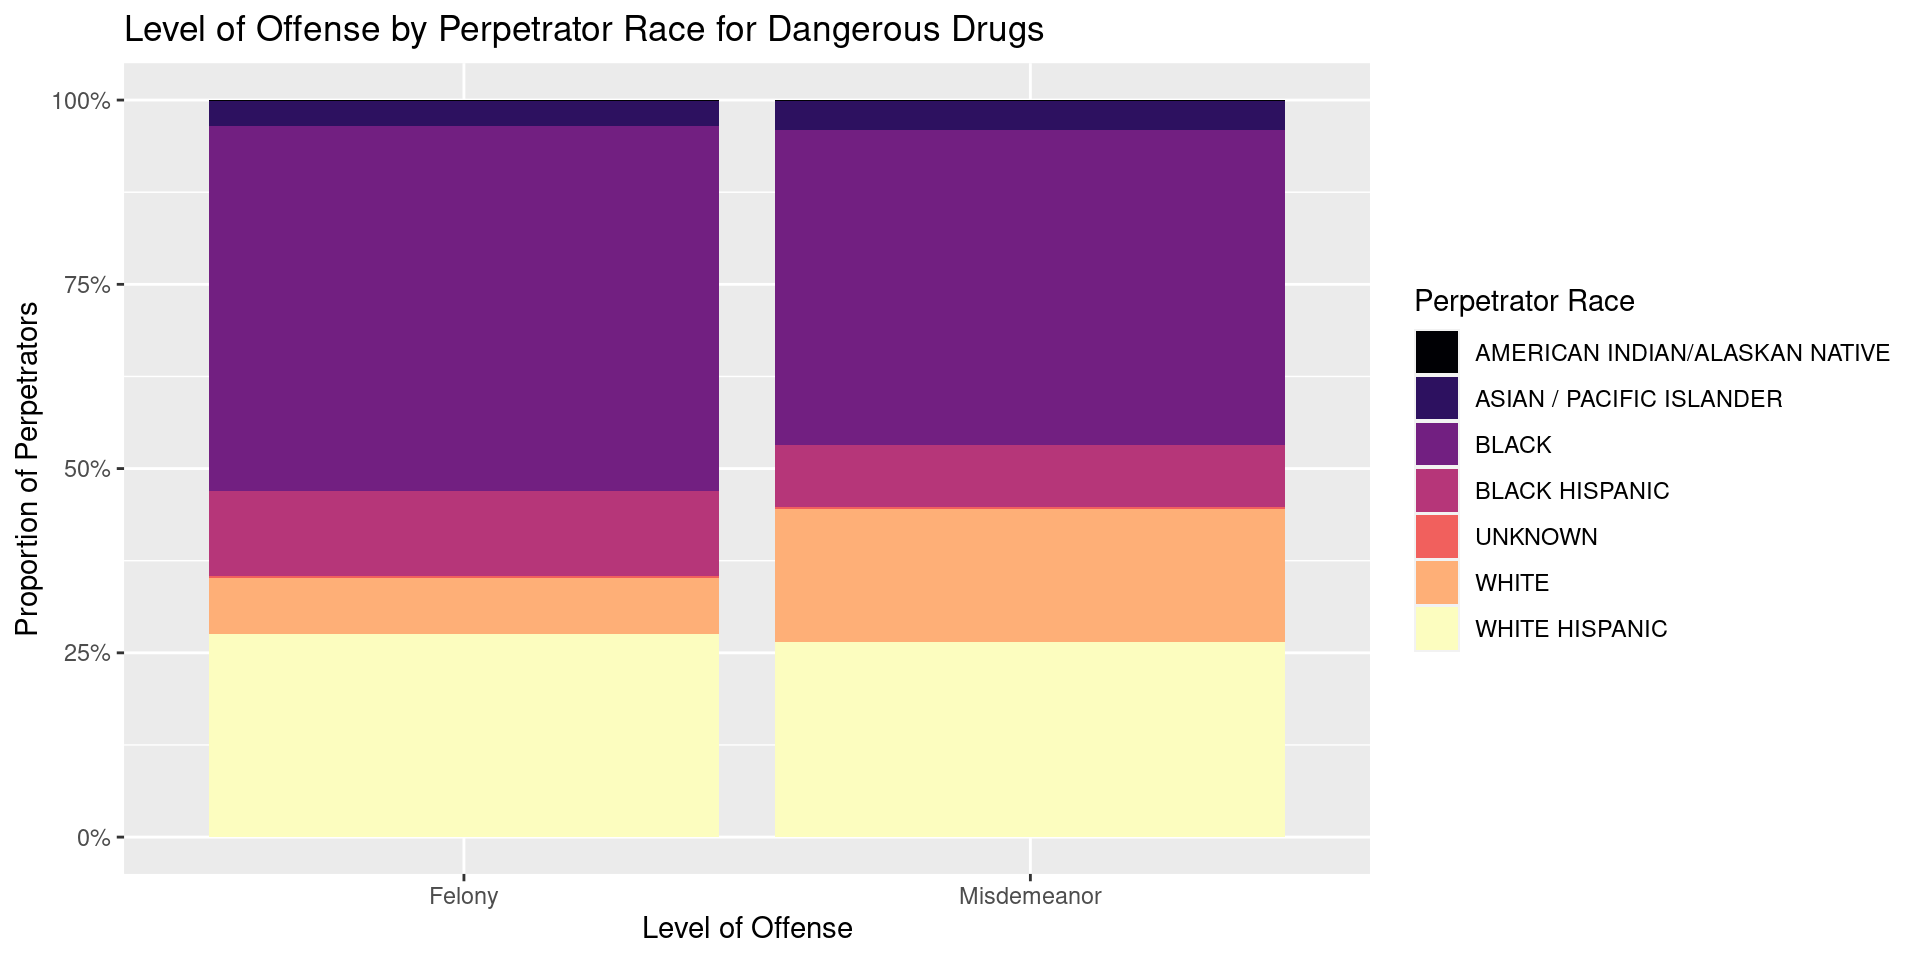
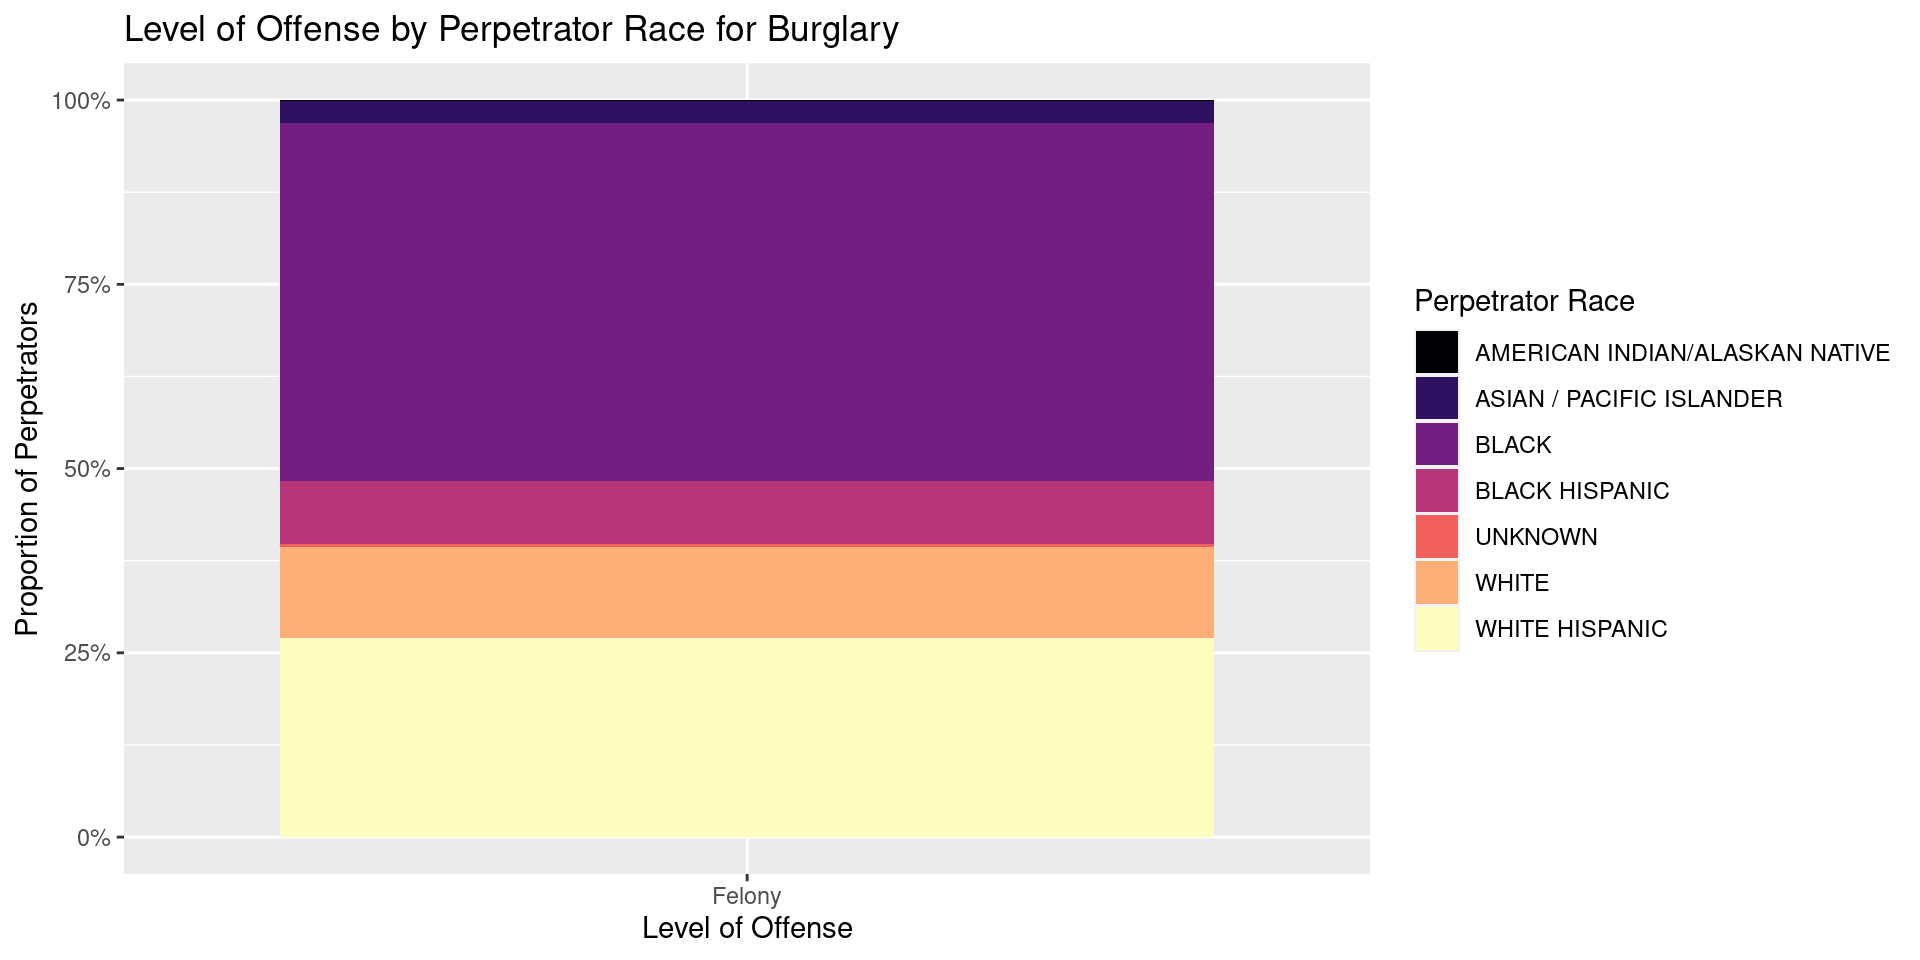
We noticed something interesting when looking at specific offense codes broken down by proportion of people of a certain race - different levels of offense saw some races appear more often than others for the same crime.
Inference Modelling and Analysis

# A tibble: 1 × 1
  p_value
    <dbl>
1       0
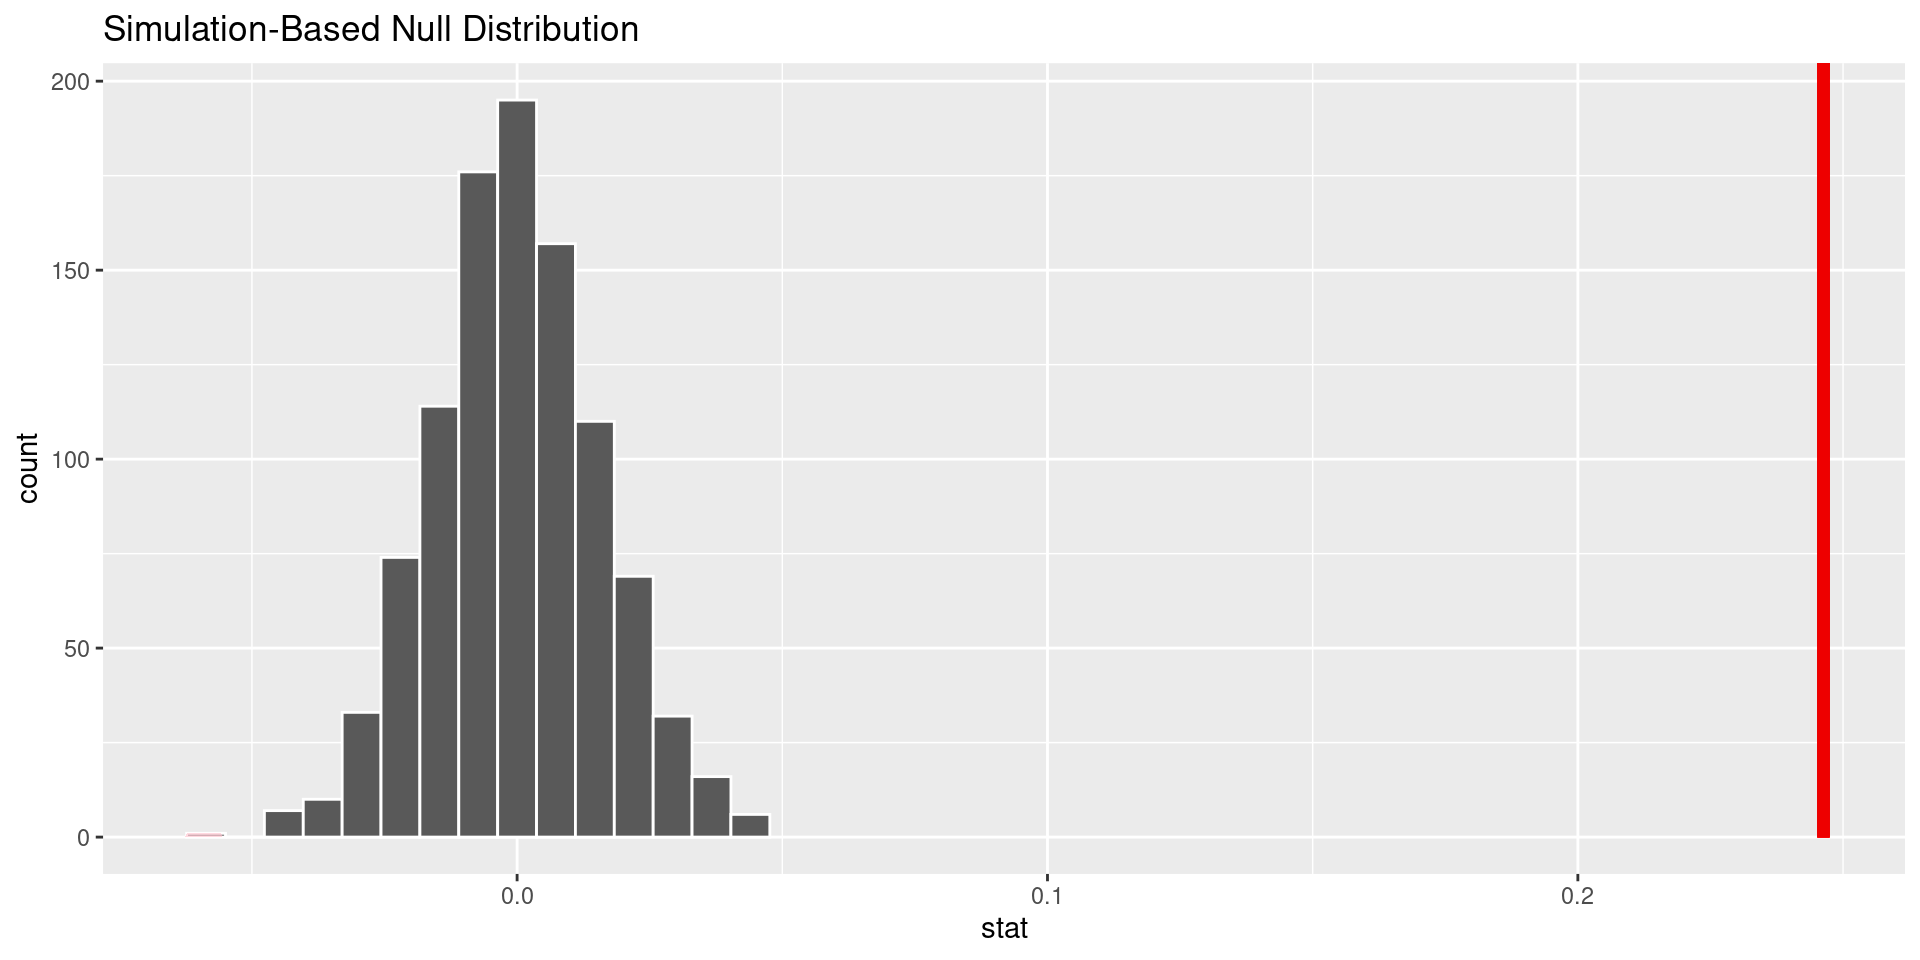
\[H_0: p_b = p_w\] \[H_A: p_b \neq p_w\] With a p-value less than 0.05, we reject the null hypothesis. There is significant evidence that the true proportion of black perpetrators arrested for dangerous drugs who were convicted of felonies is not the same as white perpetrators
Modelling Arrests Through the Month

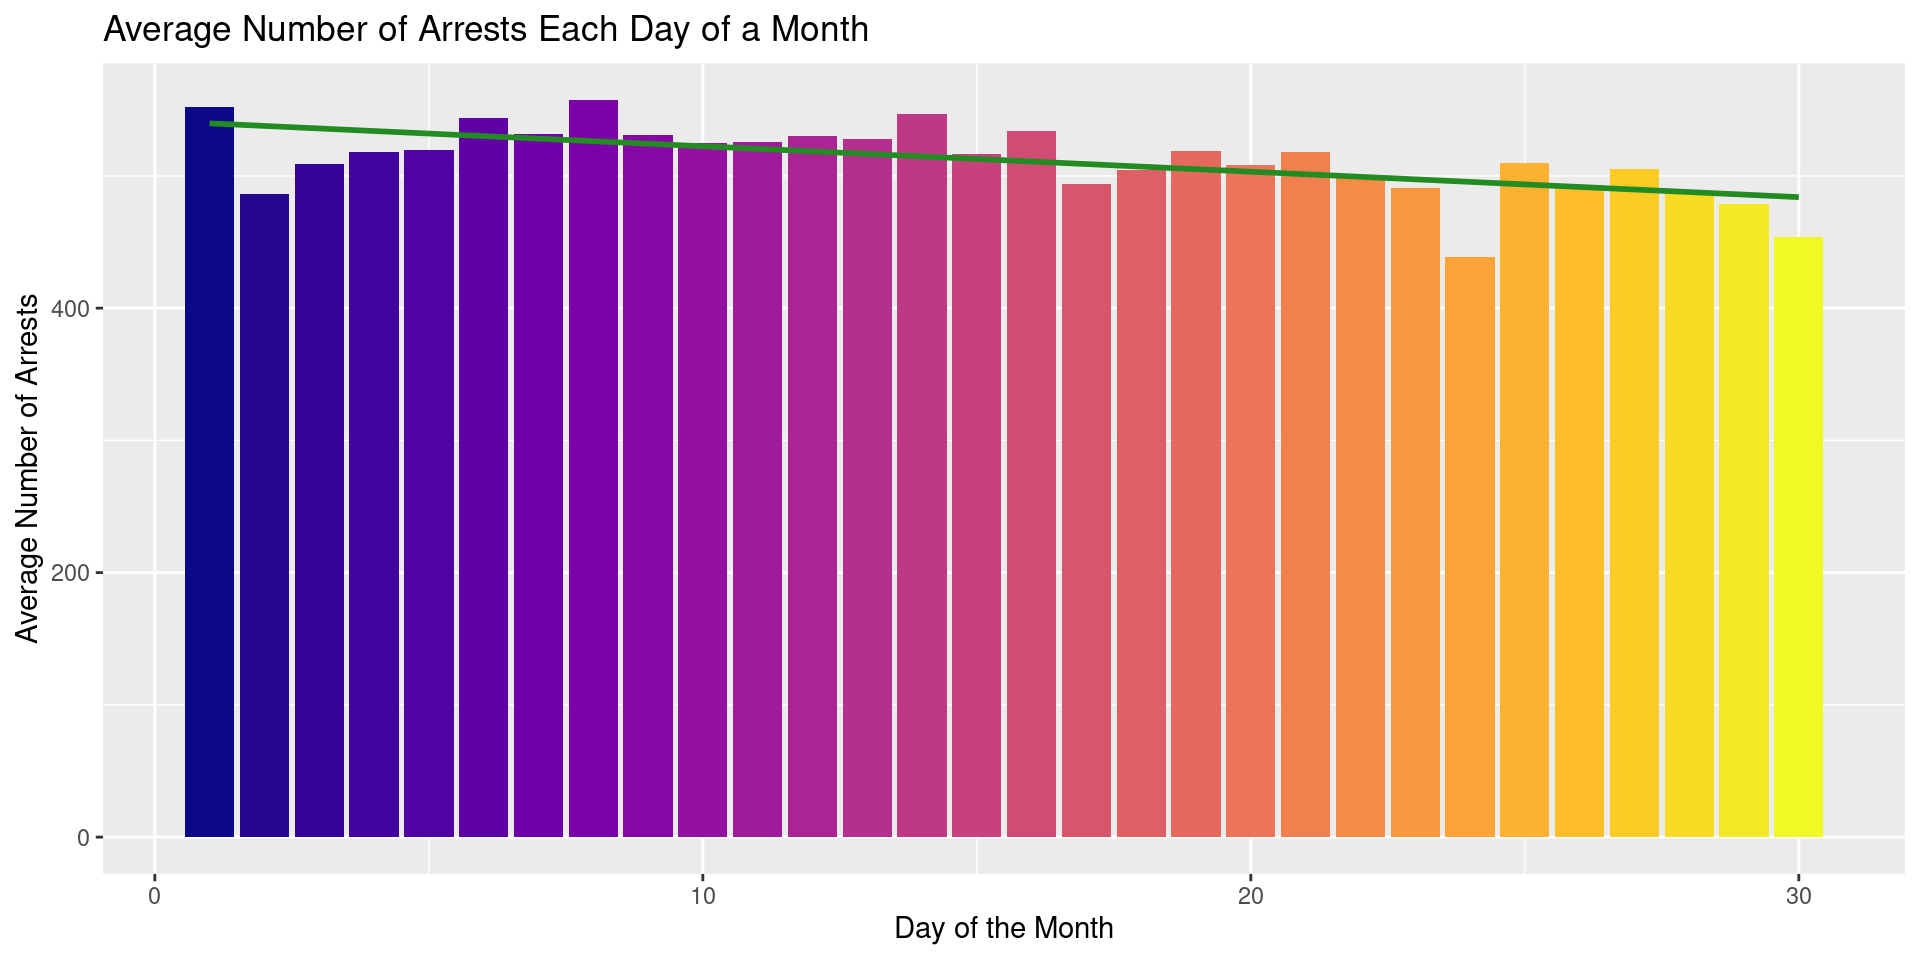
\[ \begin{split} \widehat{ARRESTS} = 541.63 + DAY \times -1.92 \end{split} \] From our model, we would expect, on average the number of arrests per day to decrease by 1.92 arrests every additional day we get in to a month.
Conclusions + future work
The difference in proportion of black people who received felony convictions for “dangerous drugs” versus white people might allude to some discrimination in the criminal justice system. While nothing is definitive it should be some cause for alarm.
For future analysis we could look deeper in to the broad category of “dangerous drugs”. Maybe the amount of the drug possessed, intent, or type of drug plays a role in this difference?
Analysis also shows some correlation between when arrests are more likely occur during a month/year. Furthermore there are statistically significant differences in the number of arrests and the make up of perpetrator characteristics.