INFO 2950
5/5/23
Our topic focuses the affect of tweets on stock volatility and changes in stock prices.
We are interested in trying to view if the volatility is affected by tweets about that particular stock and build a prediction of volatility based on this
We are also trying to investigate if the stock price is affected by the attitude of tweets toward a particular company. In other words, are these two variables independent
We were motivated to research this relationship because we were all curious about the short squeeze of particular “meme” stocks in January of 2021, and wanted to see the extent to which social media discussions affect stock price
# A tibble: 20 × 13
tweet stock date last_price x1_day_return x2_day_return x3_day_return
<chr> <chr> <chr> <dbl> <dbl> <dbl> <dbl>
1 "@FAME95FM1… PayP… 31/0… 39.8 0.00201 0.0123 0.0123
2 "@CBSi Jama… PayP… 31/0… 39.8 0.00201 0.0123 0.0123
3 "@Hitz92fm … PayP… 31/0… 39.8 0.00201 0.0123 0.0123
4 "RT @nikita… Star… 31/0… 55.2 0.0123 0.0163 0.0163
5 "@gawker Ja… PayP… 31/0… 39.8 0.00201 0.0123 0.0123
6 "RT @cultco… Star… 31/0… 55.2 0.0123 0.0163 0.0163
7 "@amazon ha… Amaz… 31/0… 823. 0.00838 0.0149 0.0149
8 "RT @nia4_t… Star… 31/0… 55.2 0.0123 0.0163 0.0163
9 "Hmmm inter… Disn… 31/0… 111. 0.00262 -0.0122 -0.0122
10 "RT @IndiaH… Goog… 31/0… 820. 0.00444 0.0303 0.0303
11 "RT @Google… Goog… 31/0… 820. 0.00444 0.0303 0.0303
12 "@Dal_Schnu… Reut… 31/0… 49.4 -0.00268 0.00312 0.00312
13 "@natgeosoc… PayP… 31/0… 39.8 0.00201 0.0123 0.0123
14 "RT @IBMWat… Apple 31/0… 121. 0.00231 0.00494 0.00494
15 "Canadian @… eBay 31/0… 31.8 0.0107 0.0214 0.0214
16 "RT @KottiP… Reut… 31/0… 49.4 -0.00268 0.00312 0.00312
17 "RT @ColMor… Ford 31/0… 12.4 0.000809 0.0105 0.0105
18 "@HSBC is f… HSBC 31/0… 676. 0.00532 0.0166 0.0166
19 "Check out … eBay 31/0… 31.8 0.0107 0.0214 0.0214
20 "RT @nikita… Star… 31/0… 55.2 0.0123 0.0163 0.0163
# ℹ 6 more variables: x7_day_return <dbl>, px_volume <dbl>,
# volatility_10d <dbl>, volatility_30d <dbl>, lstm_polarity <dbl>,
# textblob_polarity <dbl>
Tweet Sentiment’s Impact on Stock Returns by The Devastator on Kaggle.com
Over 850,000 data points
Variables of Interest:
Topics that interested us based on the data and our initial exploration:
How does the number of tweets in a given day affect the volatility of a stock
How does this hold across various market caps?
Is this different between generic stocks in our dataset and Apple, the current largest stock in the world
Does the attitude of a tweet toward a stock truly effect the price of the stock?
Cleaned the dataset by fixing column alignment and shifting rows.
Created an initial visualization using one stock to better understand relationships
Our first inference model was to find the number of tweets and their affect on the volatility on a selection of stocks across market caps.
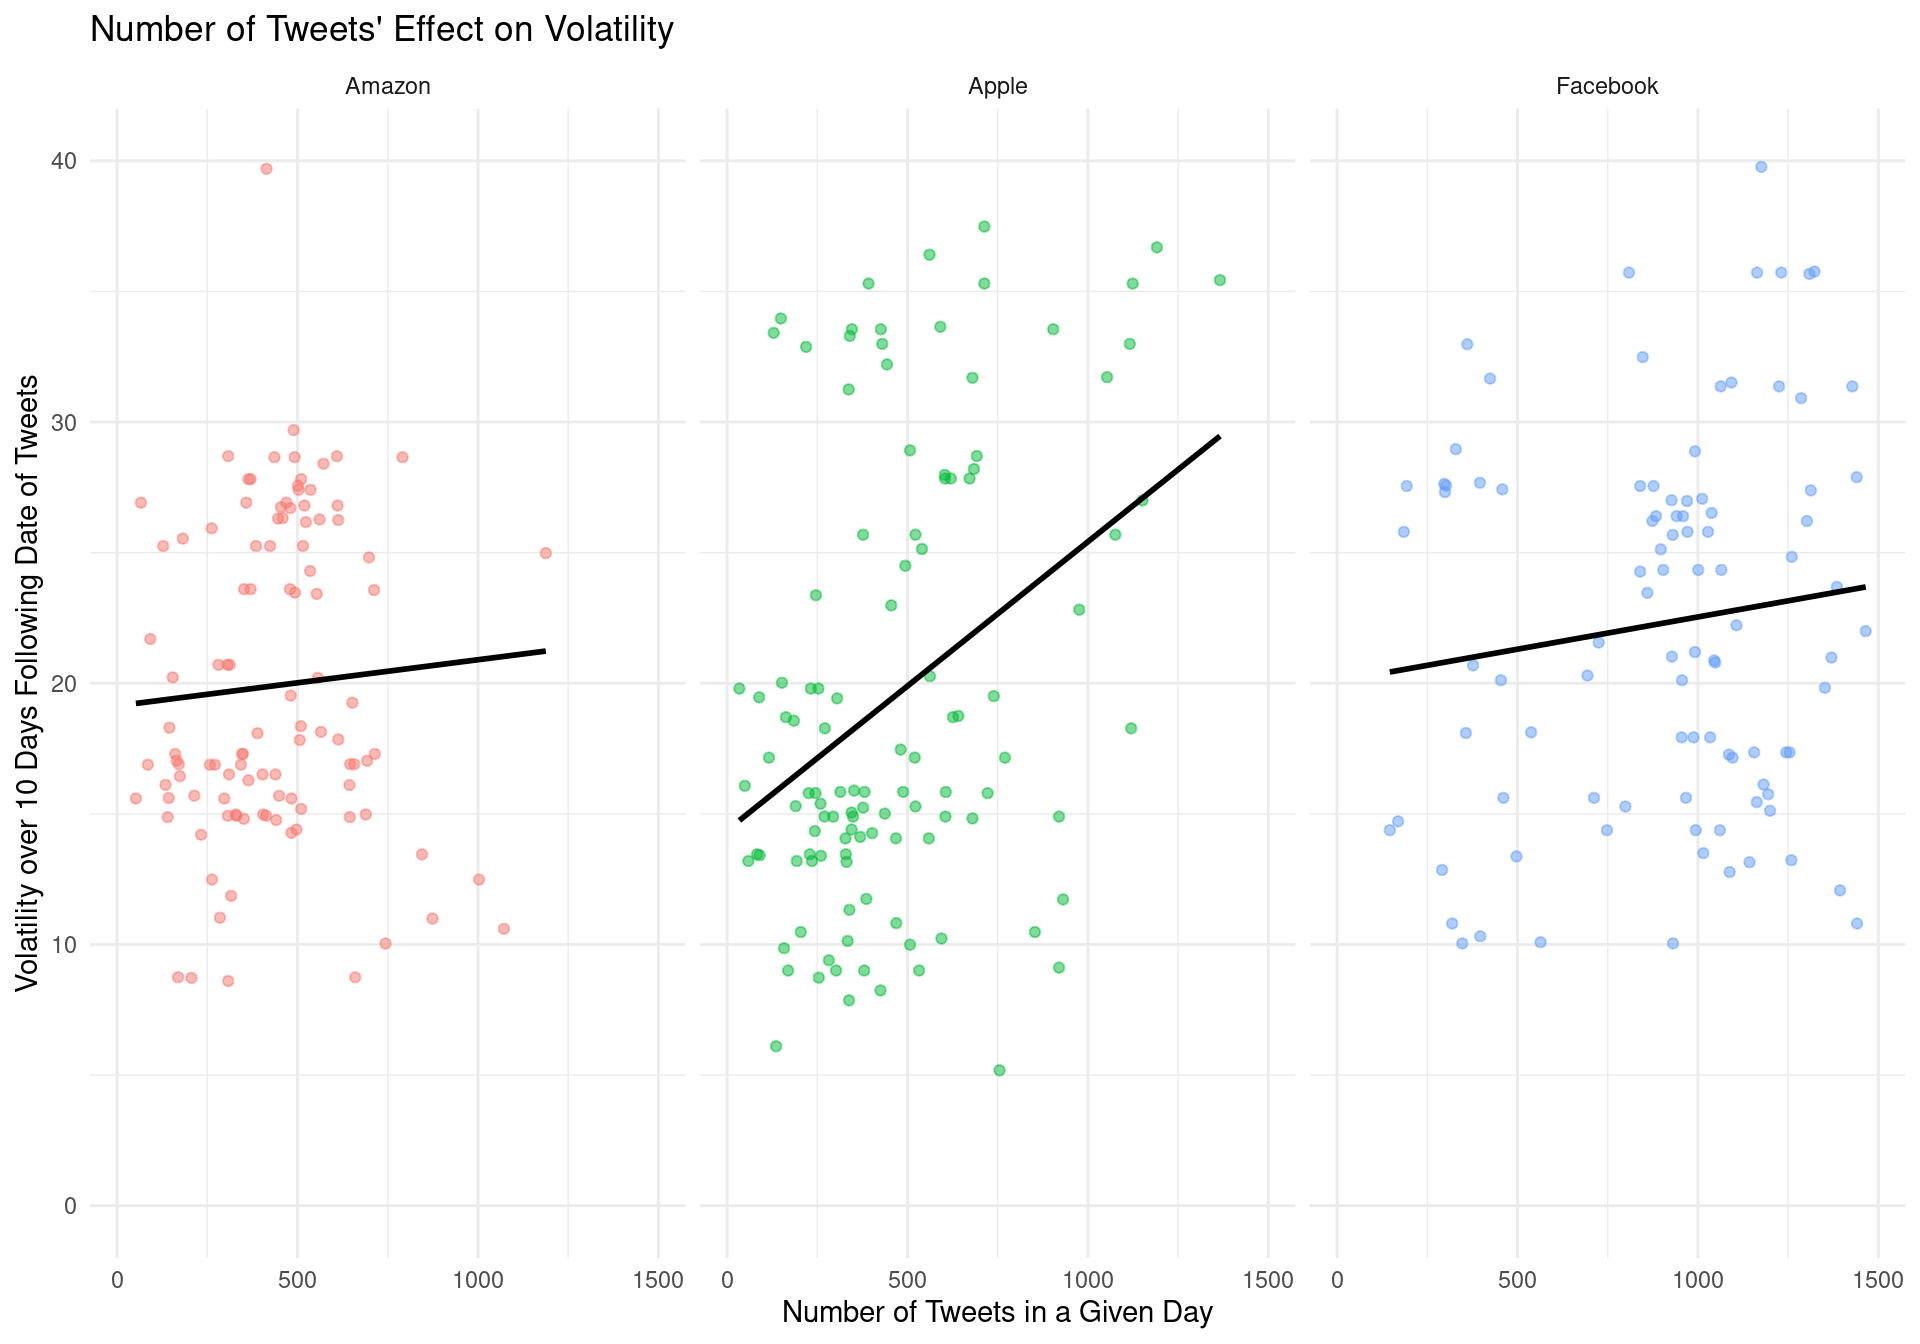
The first visualization below is specific to Facebook, Apple and Amazon. Companies apart of FAANG and generally in the upper echelon of market caps
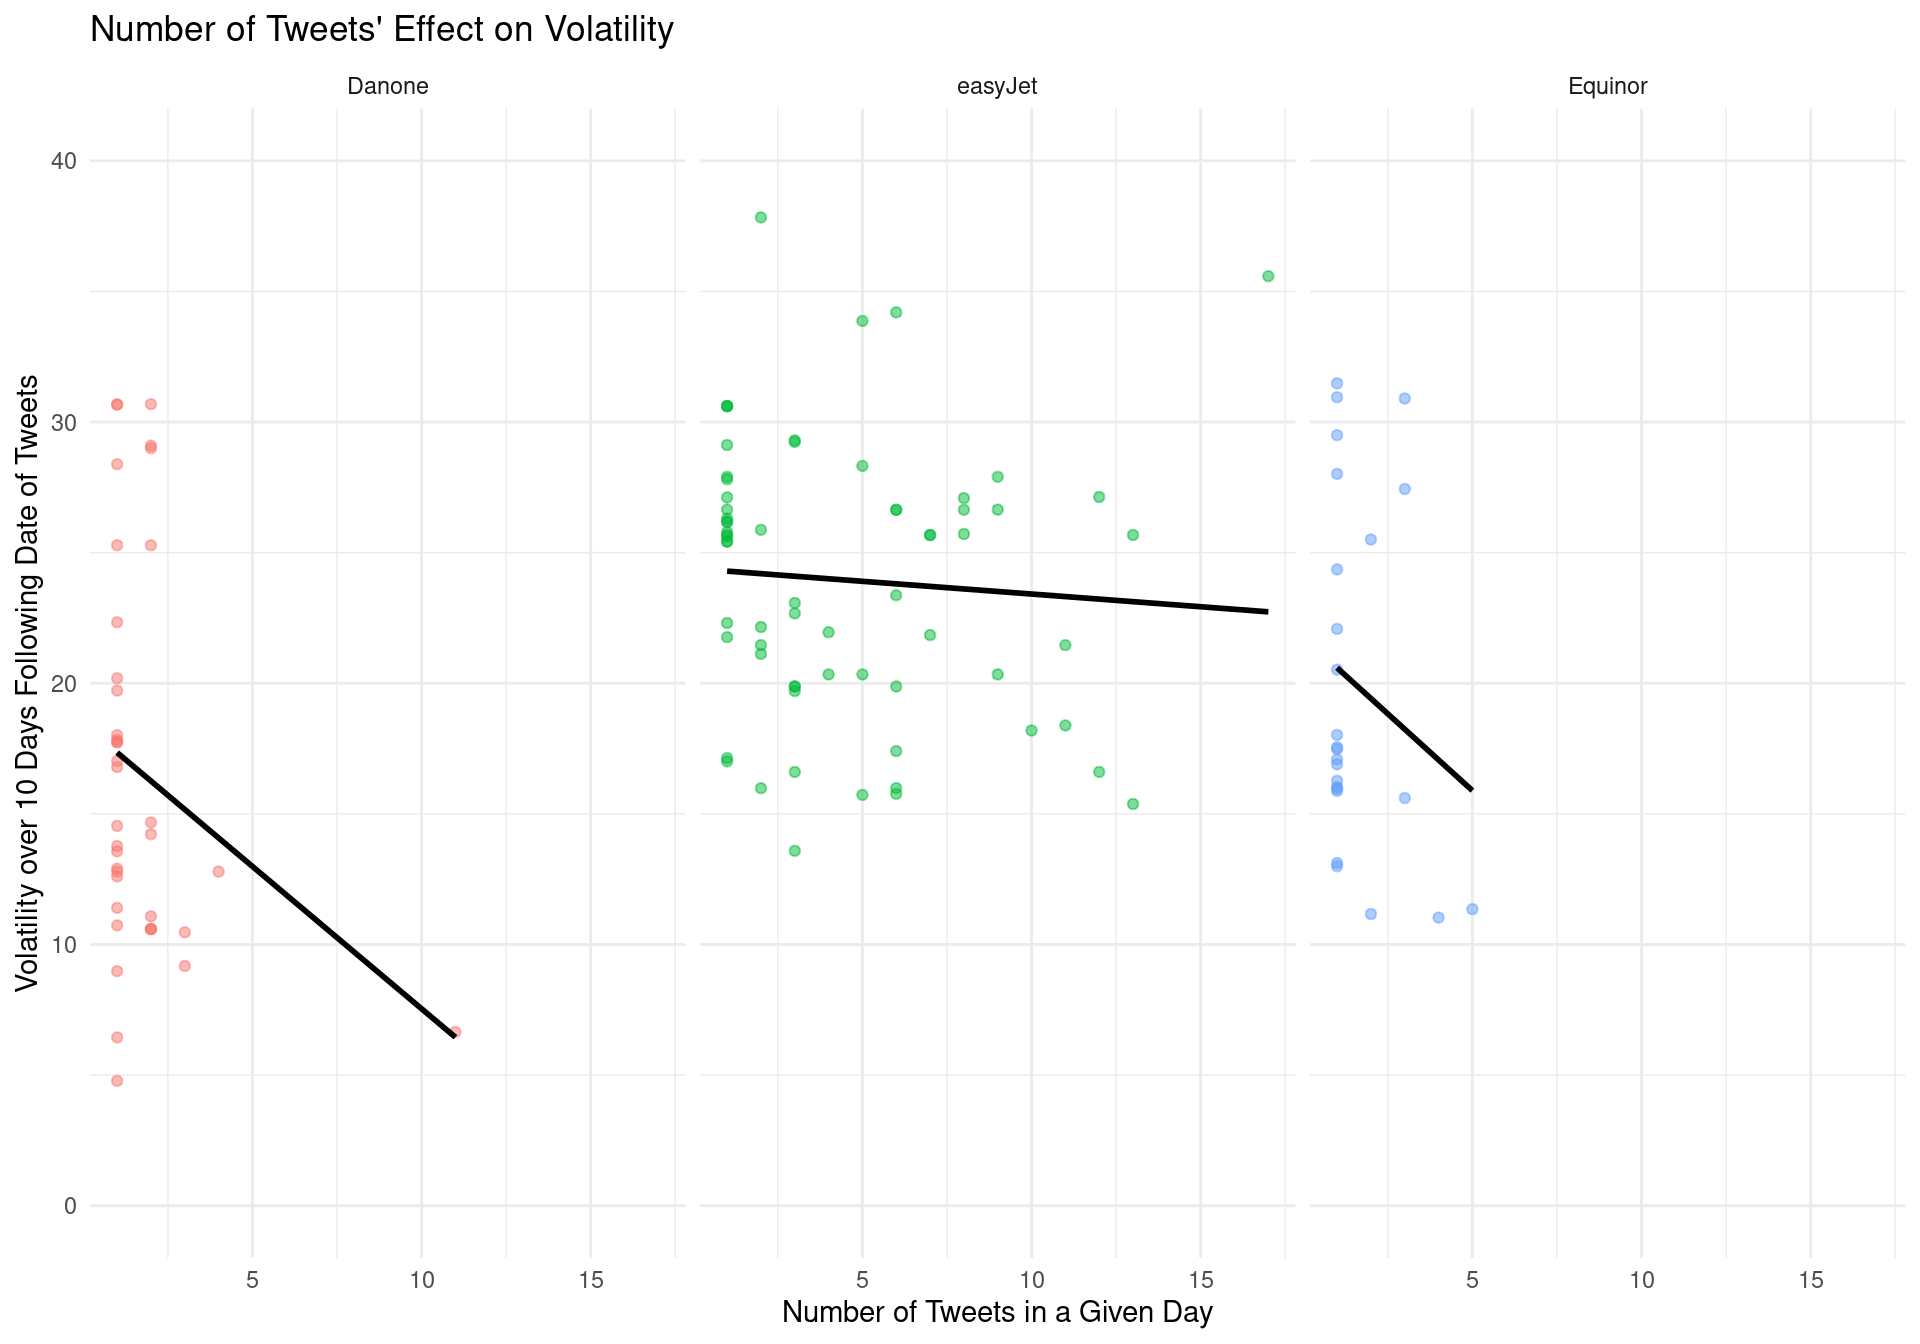
The second visualization below is specific to easyJet, Danone and Equinor. Companies with significantly smaller market caps then the previously mentioned companies.
After seeing these relationships, we generalized the analysis to all stocks in the dataset.
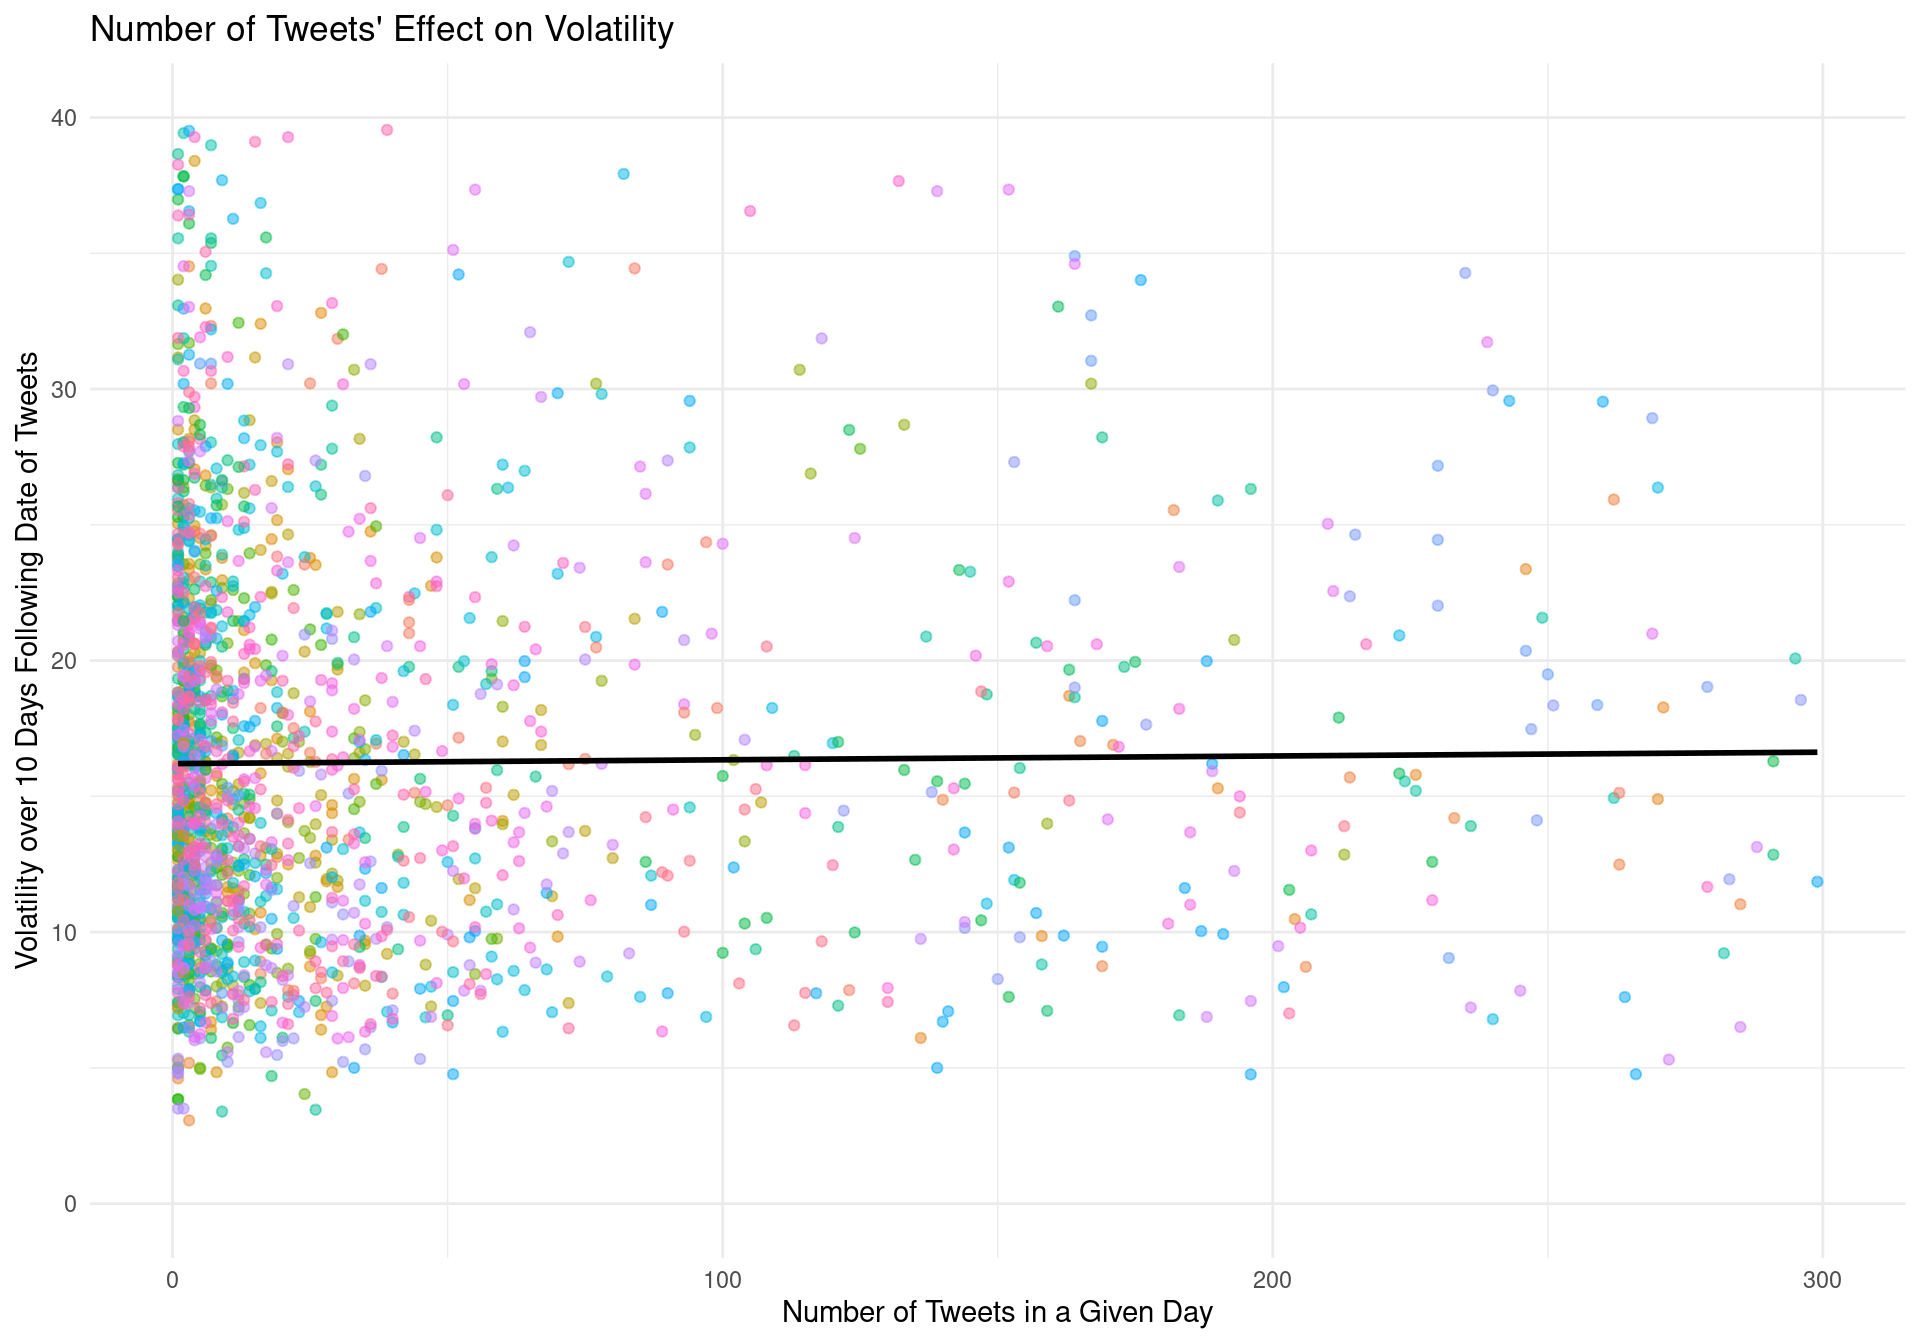
\[ volatility = 18.35 + 0.00002 \times number~of~tweets \]
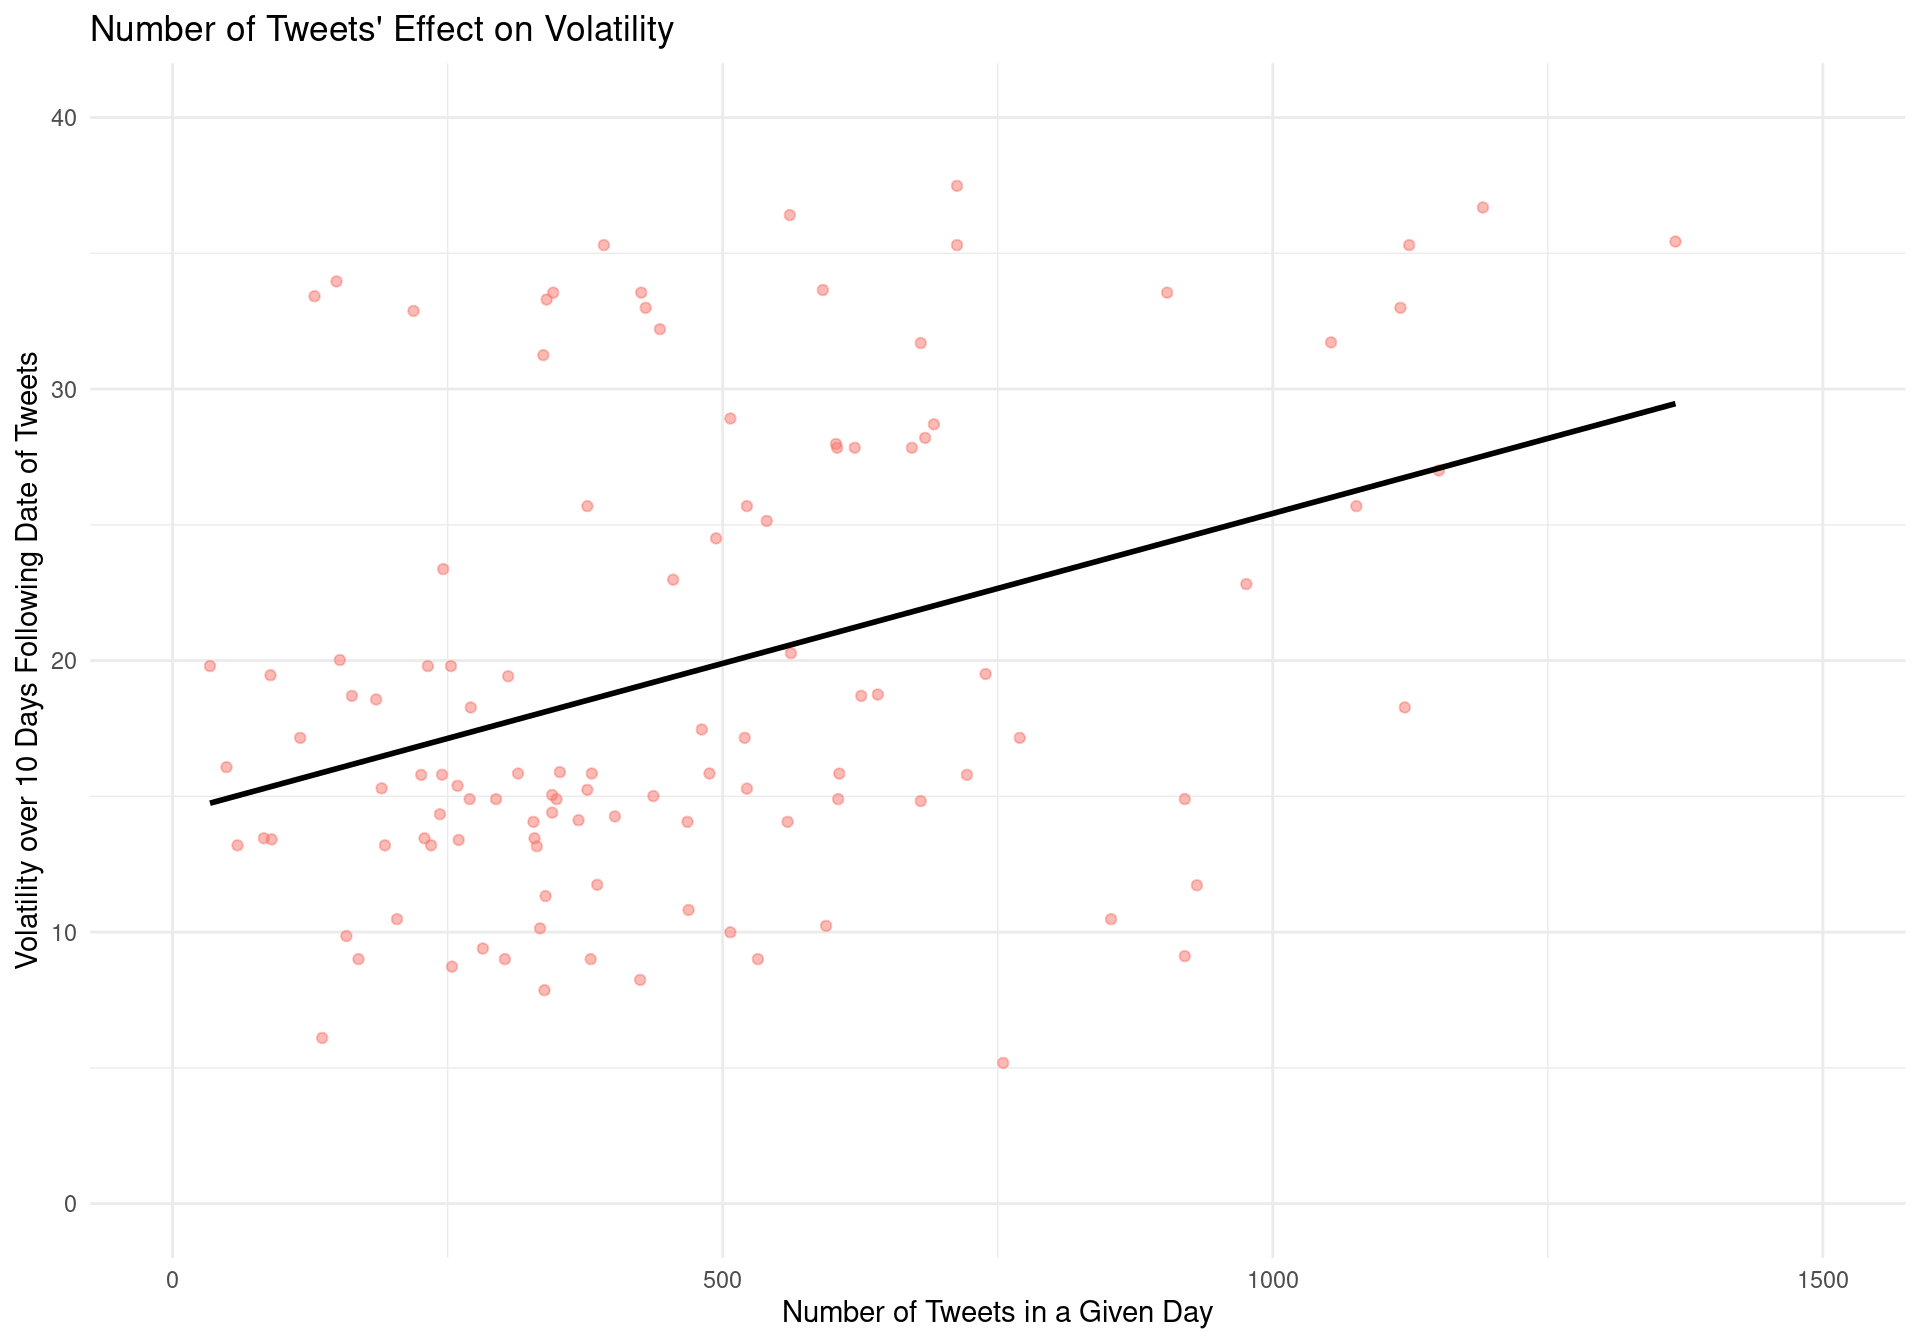
Stocks are quite varied in many regards. We wanted to see if the same trends exist in the largest company in the world, Apple.
$7.3b ~ Average market cap of a US Stock in 2017
$860.88 b ~ Market cap of Apple in 2017 (end of year)
2.62 trillion ~ Market cap of Apple as of yesterday (5/5/2023)
Clearly, every stock is not the same!
# A tibble: 2 × 5
term estimate std.error statistic p.value
<chr> <dbl> <dbl> <dbl> <dbl>
1 (Intercept) 17.5 1.30 13.5 9.62e-26
2 tweet_num 0.00607 0.00189 3.21 1.68e- 3
\[ volatility = 17.78 + 0.00568 \times number~of~tweets \]
Next, we analyzed the impact of attitude expressed in tweets on stock price
Question: Is the stock price impacted by the attitude of tweets for generic stocks? Are these independent?
two-sided hypothesis test
\[ H_0: \mu_1 - \mu_2 = 0 \]
\[ H_a: \mu_1 - \mu_2 \neq 0 \]
# A tibble: 1 × 1
p_value
<dbl>
1 0.986
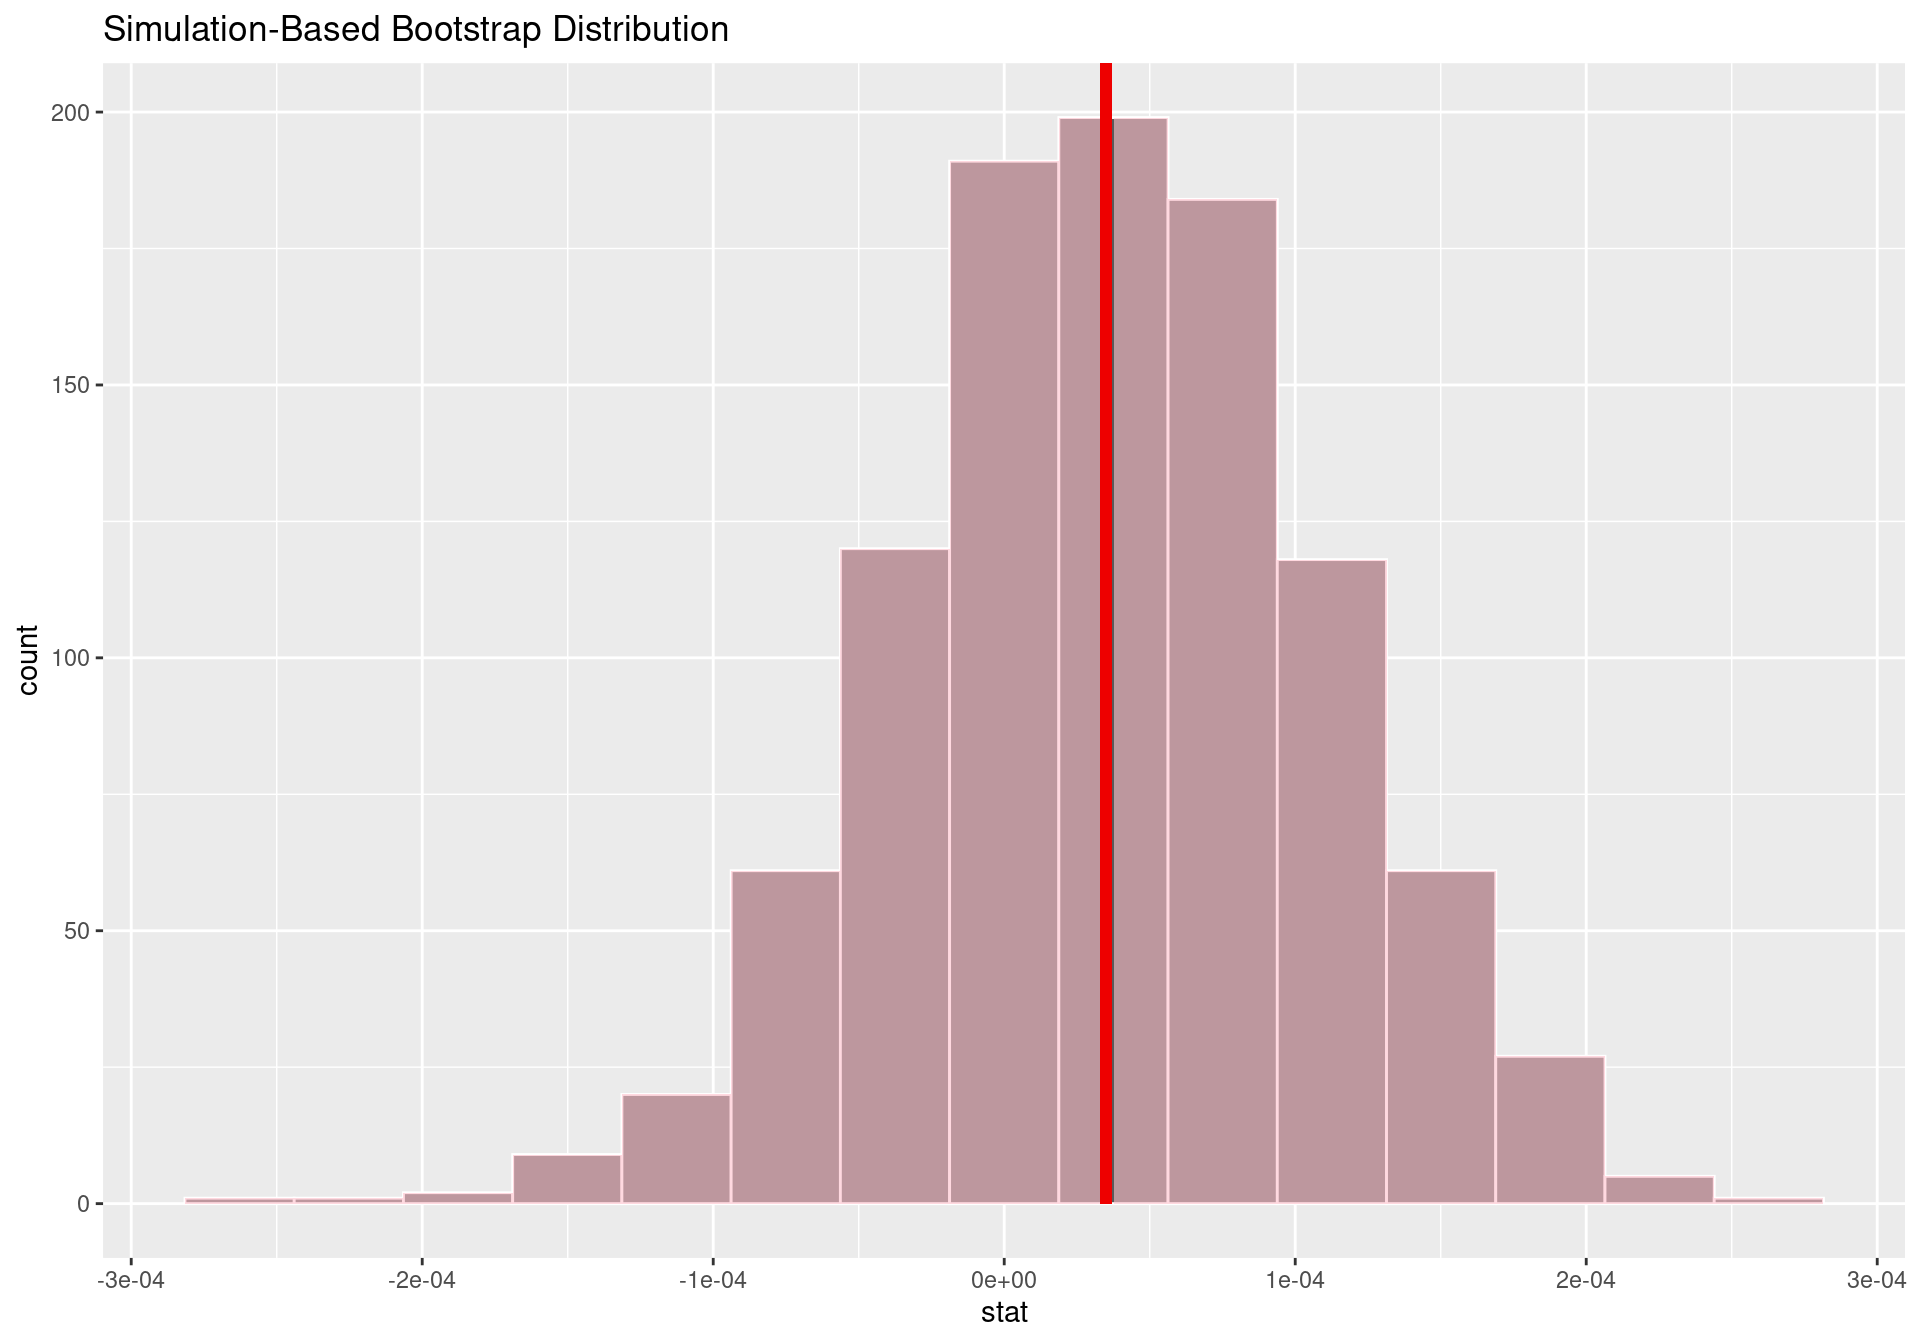
With a P-value is .986, we fail to reject the null hypothesis. The null hypothesis remains true
Our findings indicate that there is no difference of 1 day changes in stock prices for stocks based on tweets mentioning them
Not much evidence to suggest tweet volume or sentiment affects stocks.
The data set included a wide variety of stocks