The Opt-Out Movement
Analyzing the Underlying Factors Influencing Students’ Decision to Skip New York State Tests
Team Sellouts
Liam Sands, Qiyuan Huang, Riley Wilson, Jason Lan
5/5/23
Topic and Motivation
We are looking to see if there is any connection between state testing refusal rates and specific variables that students have in common.
What are the main reasons students opt out of participating in the exams?
Data Introduction
New York State Testing Opt-Out data for grades 3 - 8 in ELA and Math
- Created and funded by the New York State Department of Education
- Used to provide more information on the proficiency of students in Arts and Mathematics in NY State
- Variables to look at?
- Economic status
- Fluent language skills
- Students with disabilities
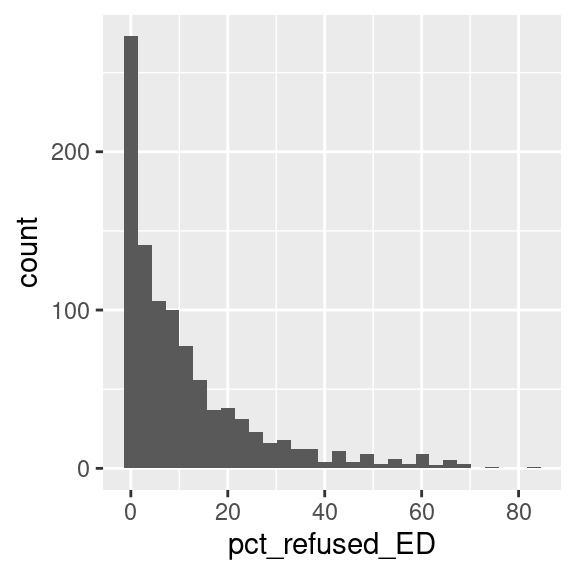
Highlights from EDA
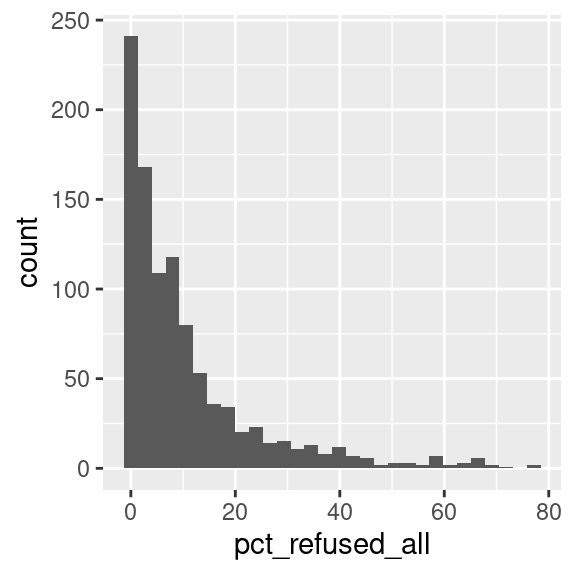
Most students do not opt-out of either ELA or Math exams.
Students seem to opt-out at similar rates for both exams.
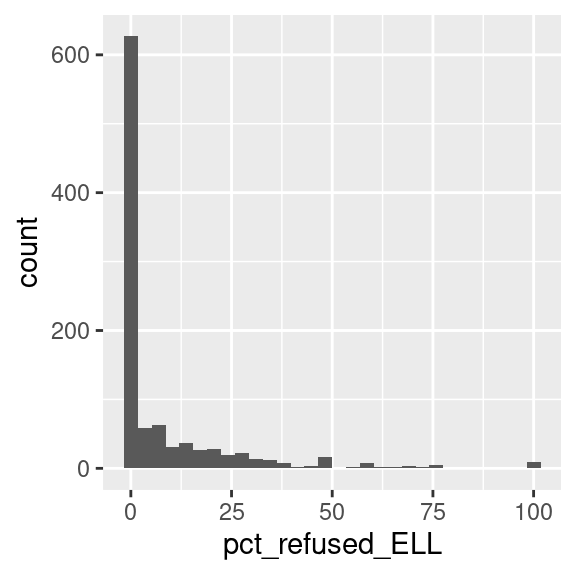
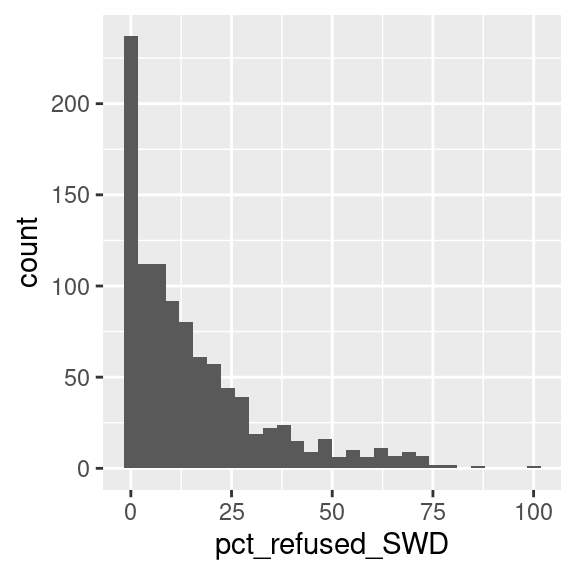
SWD and ED students opt-out at seemingly higher rates than ELL students for both exams.
Highlights from EDA
── Attaching packages ─────────────────────────────────────── tidyverse 1.3.2 ──
✔ ggplot2 3.4.2     ✔ purrr   1.0.0
✔ tibble  3.2.1     ✔ dplyr   1.1.2
✔ tidyr   1.2.1     ✔ stringr 1.5.0
✔ readr   2.1.3     ✔ forcats 0.5.2
── Conflicts ────────────────────────────────────────── tidyverse_conflicts() ──
✖ dplyr::filter() masks stats::filter()
✖ dplyr::lag()    masks stats::lag()

Attaching package: 'janitor'


The following objects are masked from 'package:stats':

    chisq.test, fisher.test


New names:
New names:
Rows: 1001 Columns: 12
── Column specification ────────────────────────────────────────────────────────
Delimiter: ","
chr (3): entity_CD, district_name, subject
dbl (9): school_ID, total_count_all, pct_refused_all, total_count_ELL, pct_r...

ℹ Use `spec()` to retrieve the full column specification for this data.
ℹ Specify the column types or set `show_col_types = FALSE` to quiet this message.
`stat_bin()` using `bins = 30`. Pick better value with `binwidth`.
`stat_bin()` using `bins = 30`. Pick better value with `binwidth`.
`stat_bin()` using `bins = 30`. Pick better value with `binwidth`.
`stat_bin()` using `bins = 30`. Pick better value with `binwidth`.
Analysis 1 - Hypothesis Testing
Do the English Language Learners/Students with Disabilities/Economically Disadvantaged students have a significant effect on the total number of refusals for the NY State ELA/Math Exams?
\[
\alpha = 0.10
\]
\[
H_0: p_1 - p_2 = 0
\]
\[
H_A: p_1 - p_2 \neq 0
\]
Analysis 1 - Evaluation
ELL p = 0.638 SWD p = 0.316 ED p = 0.580 |
ELL p = 0.652 SWD p = 0.314 ED p = 0.585 |
In each case, the p-value is greater than the significance value (0.10), so we fail to reject the null hypothesis
Analysis 2
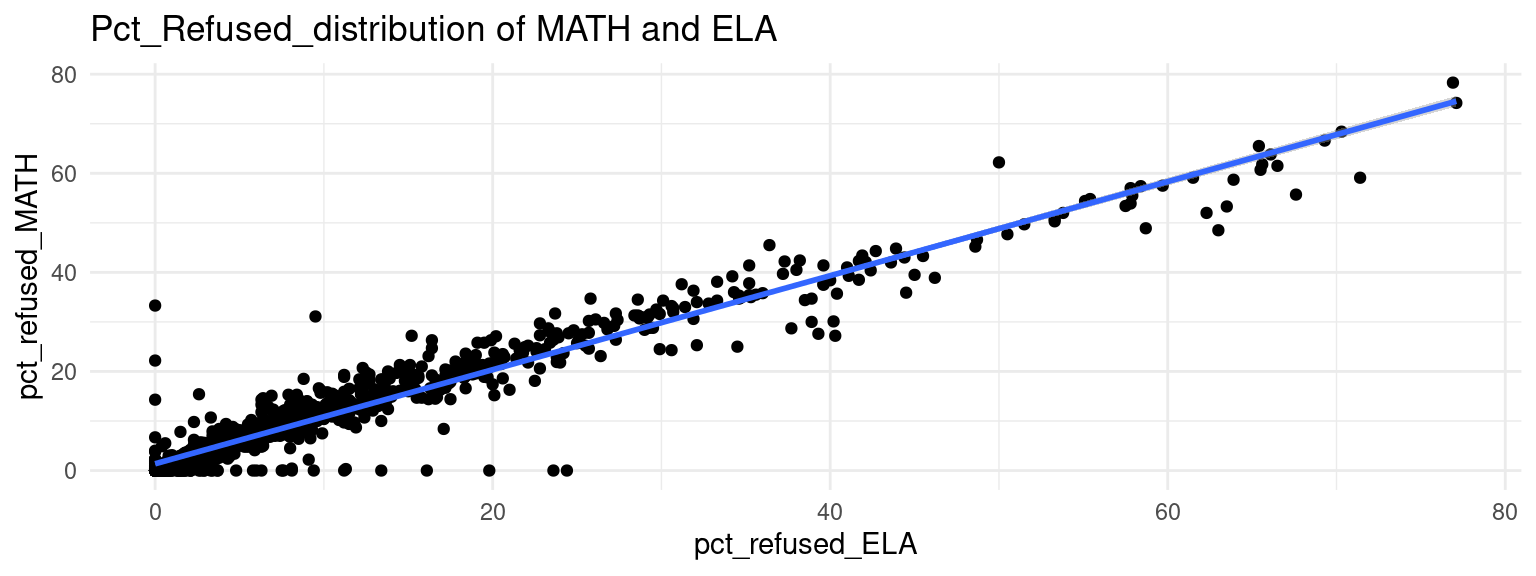
Is no relationship between ELA and MATH about the percentage of refusals?
There is no relationship between ELA and MATH about the percentage of refusals.
Based on the two data sets, we analyze the total refusal percentage for both of subjects.
\[
r = \frac{n\sum\limits_{i=1}^nELA_iMATH_i - \sum\limits_{i=1}^nELA_i \sum\limits_{i=1}^nMATH_i}{\sqrt{(n\sum\limits_{i=1}^nELA_i^2 - (\sum\limits_{i=1}^nELA_i)^2)(n\sum\limits_{i=1}^nMATH_i^2 - (\sum\limits_{i=1}^nMATH_i)^2)}}
\]
Analysis 2
It can be figured out by formulation the formula for the correlation coefficient(r)r = 0.9658341
There is a strong relationship between the total refusal percentage for both of subjects.(Reject H0)
Also, the graph fits a straight line very well and all points almost on the line.
`geom_smooth()` using formula = 'y ~ x'
Conclusions + future work
There is a strong relationship between opting out of the ELA/Math exam and being apart of the groups defined by NY State, and it is clear that there is a strong relationship between the percentage of students who refused ELA testing as those who refused Math testing.
- Future research could include projecting testing refusals, creating tactics for mitigating testing refusals, and finding further comparisons between ELA and Math standardized testing