# A tibble: 1 × 8
  mean_1mile sd_1mile mean_halfmile sd_halfmile mean_10miles sd_10miles
       <dbl>    <dbl>         <dbl>       <dbl>        <dbl>      <dbl>
1       15.6     8.83          21.6        8.89        0.771       1.95
# ℹ 2 more variables: mean_20miles <dbl>, sd_20miles <dbl>Food Access Based on Population Density
In Counties of New York State
Molly Brakewood, Lauren Chan, Owen Liu, Arthur Sun
5/5/23
Introduce the topic and motivation
What is the impact of distance to supermarkets and grocery stores on the food accessibility and food security of low-income households in low population counties of New York?
What motivated this was that we wanted to examine the relationship between population size and food accesibility to understand if counties with smaller populations are more susceptible to low food access?
Highlights from EDA
Research question: Investigating the impact of distance to supermarkets on food accessibility and security for low-income households in low population counties of New York.
Data collection and cleaning: Filtering and selecting relevant variables, normalizing low access low-income stats, and creating an analysis-ready data set.
Exploratory data analysis: Summarizing mean and standard deviation of low access low-income percentages at different distances.
Data limitations: Not having population density information and using data from 2010, which may not reflect current food insecurity trends.
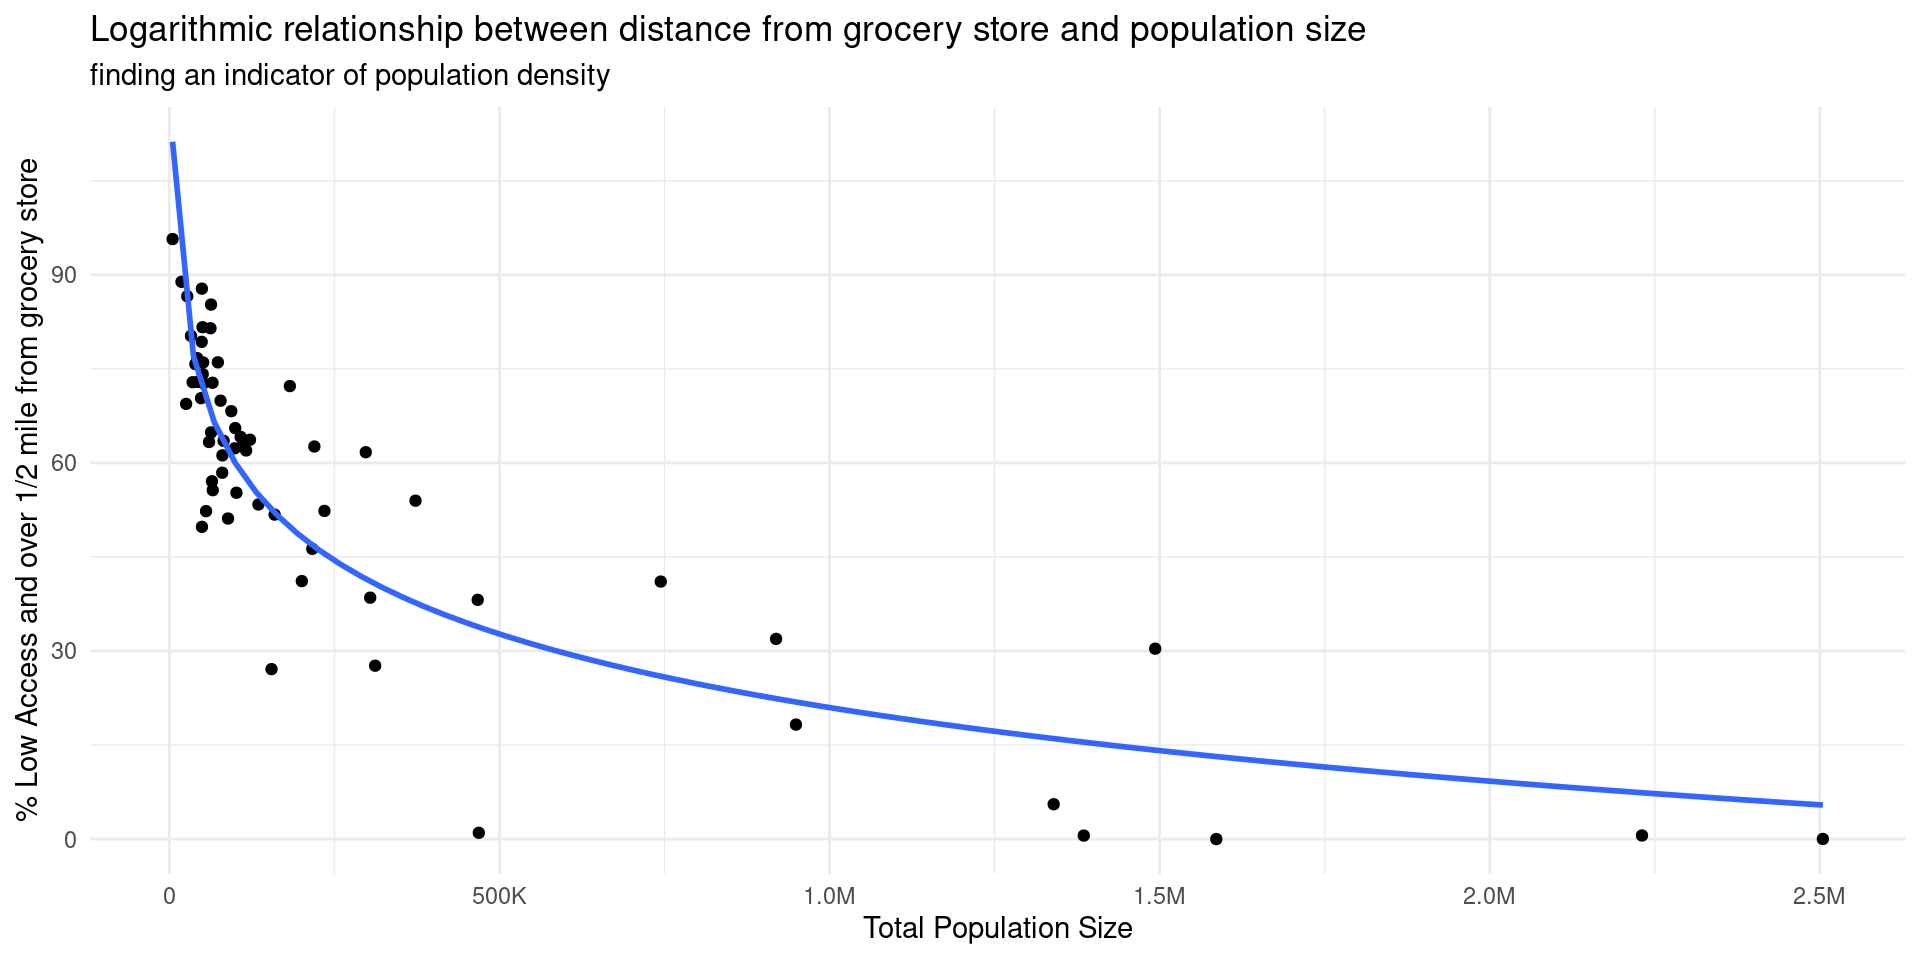
Population Size as an Indicator of Population Density
\[ H_0: r^2 < 0.7 \]
R^2 = 0.78782402536493We reject H-null. Therefore, we will assume that population size can be used as an indicator of population density for the purposes of this study.
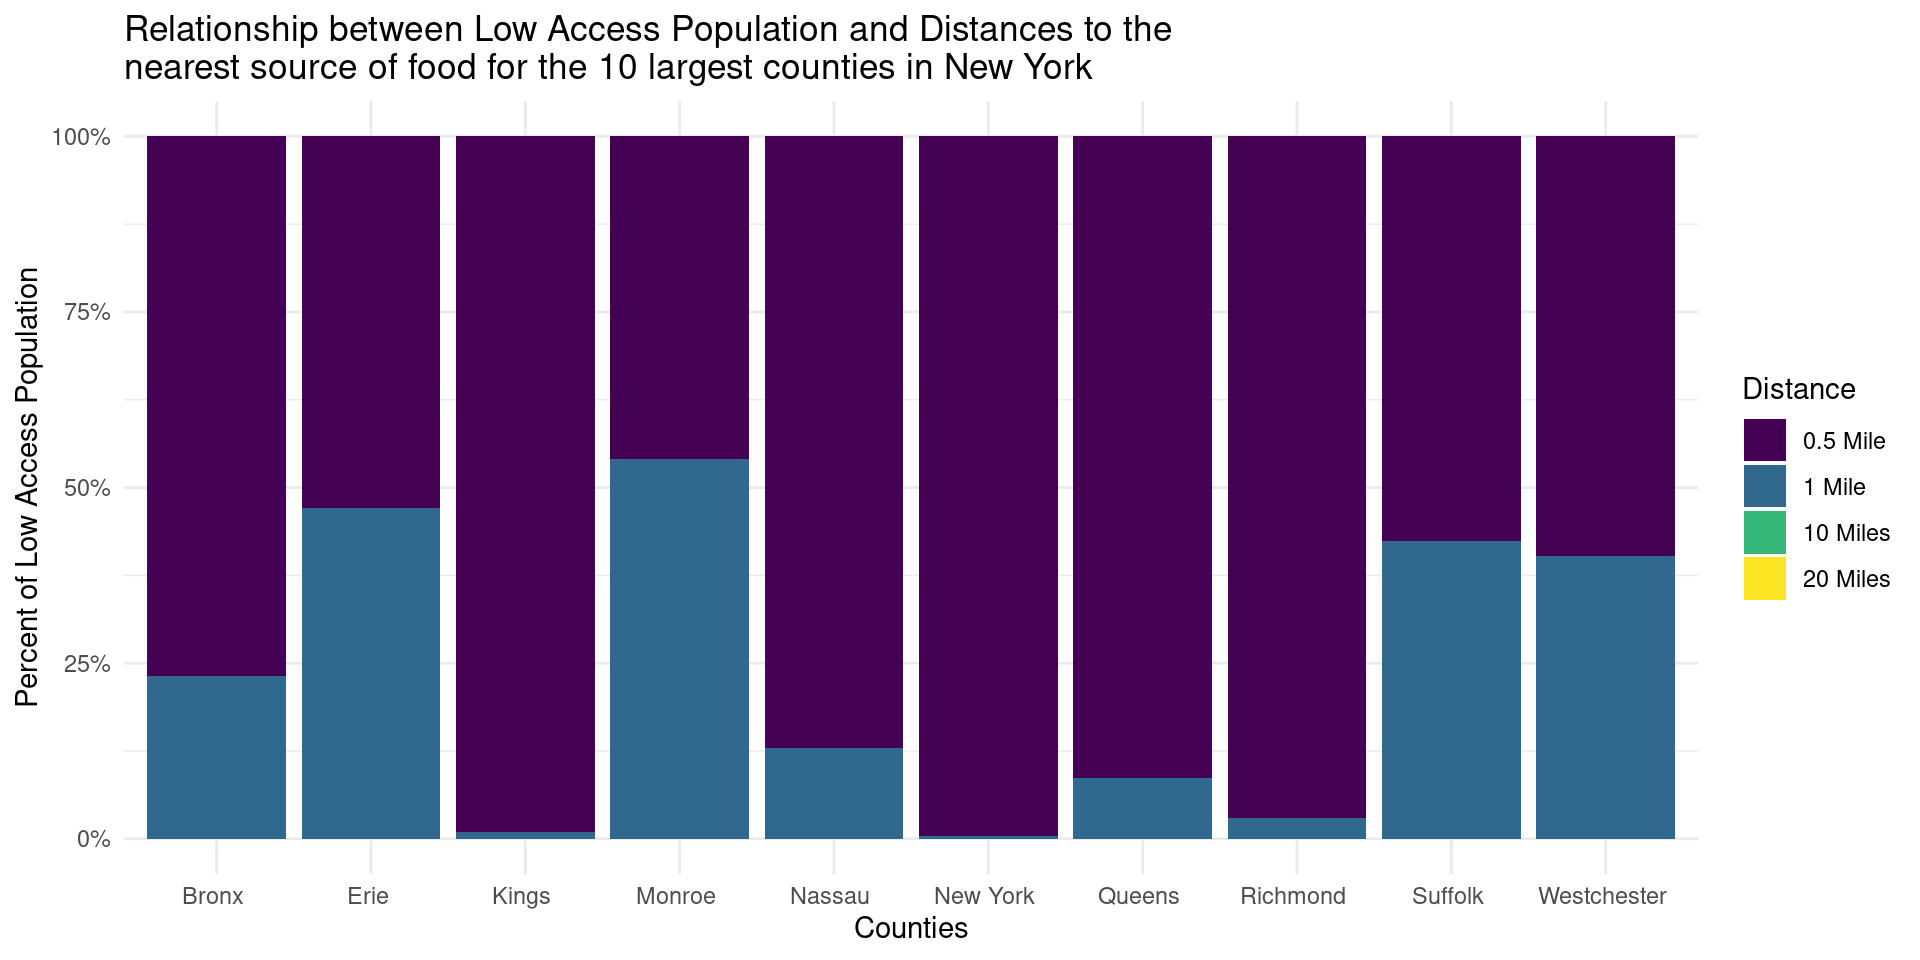
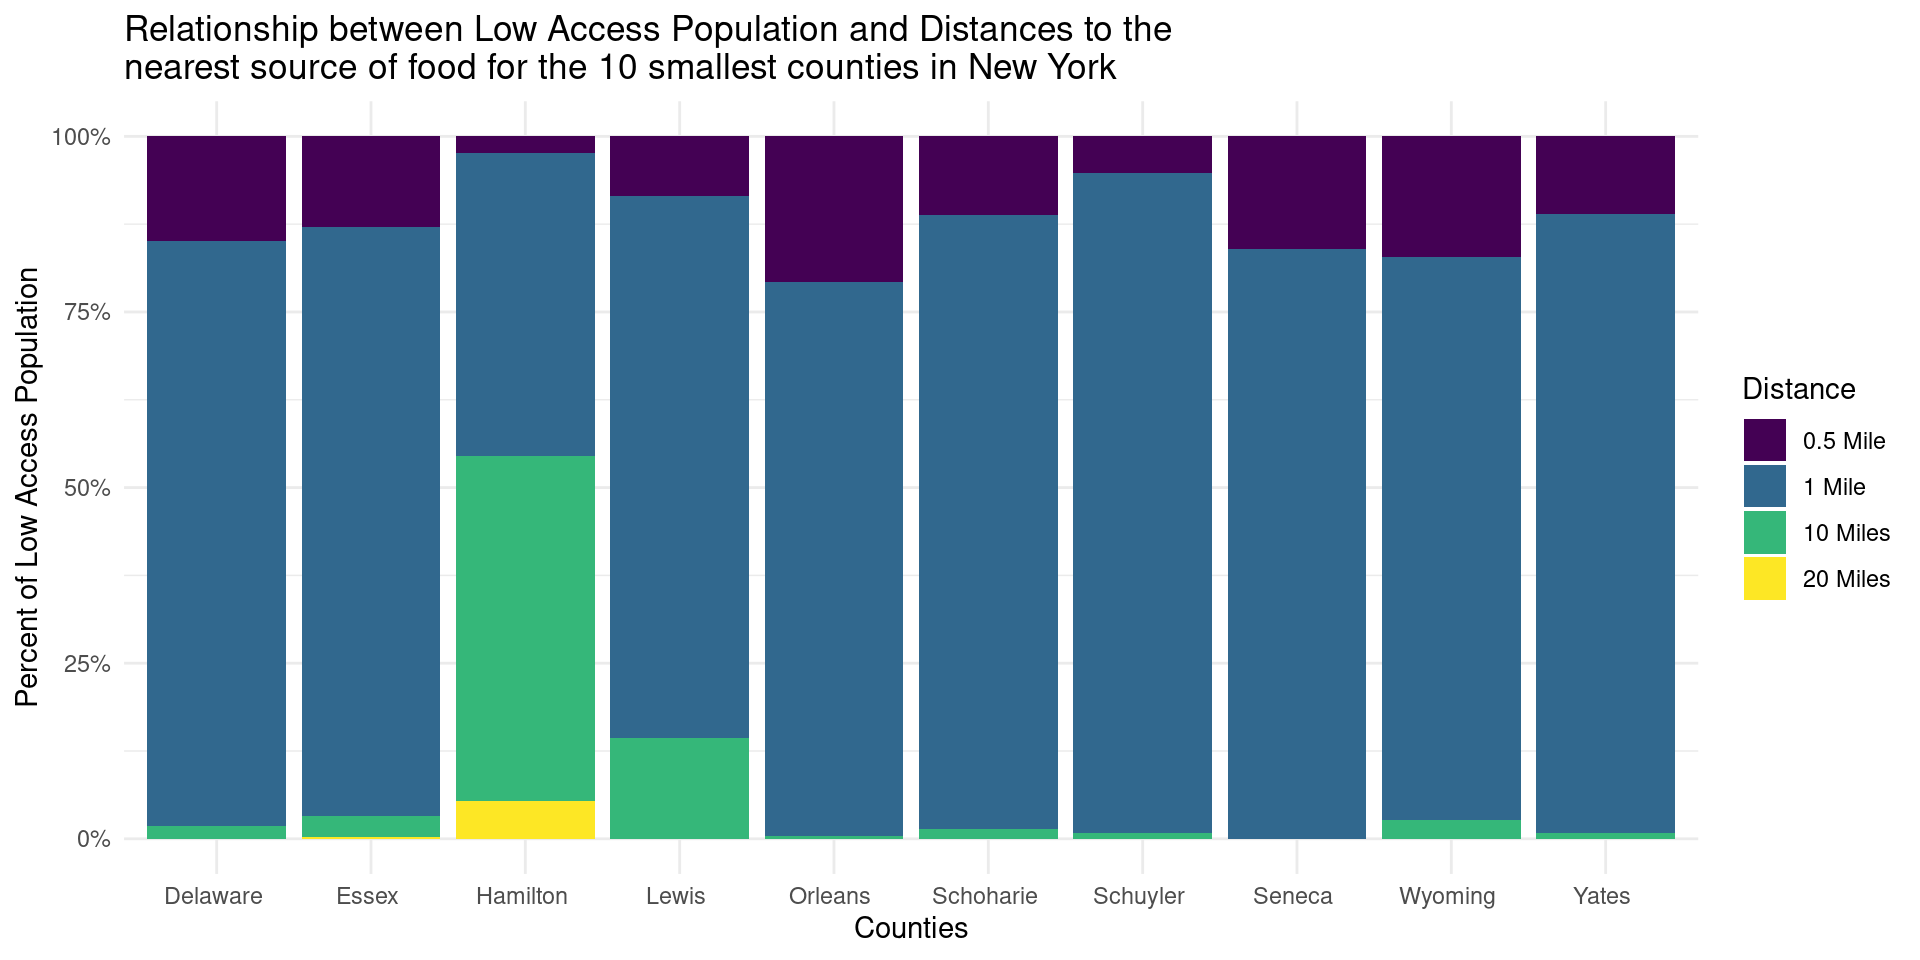
Comparing the Top 10 Largest and Smallest NY State Counties


Hypothesis Testing
Null: There is no difference in the relationship between low access population and distances to the nearest source of food between the 10 largest and 10 smallest counties in New York.
\[H_0: \vert\beta_L - \beta_S\vert = 0\]
Alternative: There is a significant difference in the relationship between low-access population and distances to the nearest source of food between the 10 largest and 10 smallest counties in New York.
\[H_A: \vert\beta_L - \beta_S\vert \neq 0\]
Results:
Observed slope difference: 0.77793 p-value: 0.774 Using a significance value of 0.05, we can determine our p-value is not statistically significant. Thus, we fail to reject the null hypothesis.
Conclusions + future work
Logarithmic relationship proves population size can indicate if a county is rural or urban
Low-access population distances to food sources is consistent regardless of county size
Highlights the need for targeted interventions and policies to improve access to food in these areas. In the future, we would want to look at data that takes food security initiatives into account (free and reduced school lunch, food banks, etc.) to gain a more in depth understanding of food accessibility in New York State.