Covid-19 Policies across the United States
By Policy Type and Region
James Kelly, Laura Kammen, Will Adam, Sabrina Lin, Jackson Andrews
5/5/23
Introduce the topic and motivation
Topic: COVID-19 pandemic in the United States and the type and number of policies that were used to address the situation.
Context: data collected after the peak of the COVID-19 pandemic in the US and thus serves as a comprehensive source for our data analysis.
Motivation: analyze the number of policies and their type used across the United States in hopes of determining any patterns or changes in COVID-19 policies in relation to time and geographic location.
Research Question: How do the number and type of COVID-19 policies differ over time depending on region/state in the United States?
Introduce the data
Details the start and stop date of various COVID-19 policies and the state or county that put the policy into place.
Collected by the U.S Department of Health and Human Services
statevariable to help us come to conclusions about the variation of COVID-19 policies across the United States and we will divide those states by region for easier interpretation.policy_typevariable which explains what the COVID-19 policy is addressing to understand how the institution of different policy types changed over time. Since these policy types are numerous, we will group them under more encapsulating names.
Highlights from EDA
Each observation contains a different COVID-19 policy
- Either the start or end of the policy
Dataset contains US Covid policies from 2020 to 2022
Columns of interest:
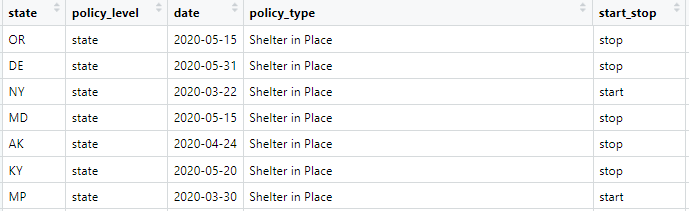
Covid Cleaned Data
Evaluation of significance
What is the significance between two regions and their number of covid policies enacted initially?
We used a two-sample t-test where μ1 is the mean policy count for the west region and μ2 is the mean policy count for midwest region
Null hypothesis: The average number of Covid policies for the west region and midwest region is not different.
Alternative hypothesis: The average number of Covid policies for the west region and midwest region is different.
\(H_o: μ1 - μ2 = 0\)
\(H_A: μ1 - μ2 ≠ 0\)
Results of Evaluation
- We got a p-value of 0
Estimating the relationship between all the varying policy types and the policy count for the United States, we used a multi-variable linear regression.
The adjusted r-sqred value of 0.4428 means that 44.28% of the variability in the model can be explained by the relationship between the different policy types and the overall number of policies
Relatively low value…
\[ \begin{split}\widehat{Policy~Count} = 74.453 - 27.366 \times Entertainment + \\8.290 \times Healthcare -54.070 \times Living~Space \\-50.485 \times Mask~ Guidelines -32.497 \times Phases \\-35.411 \times Public~Space -49.006 \times Workplaces -47.905 \times Youth\end{split} \]
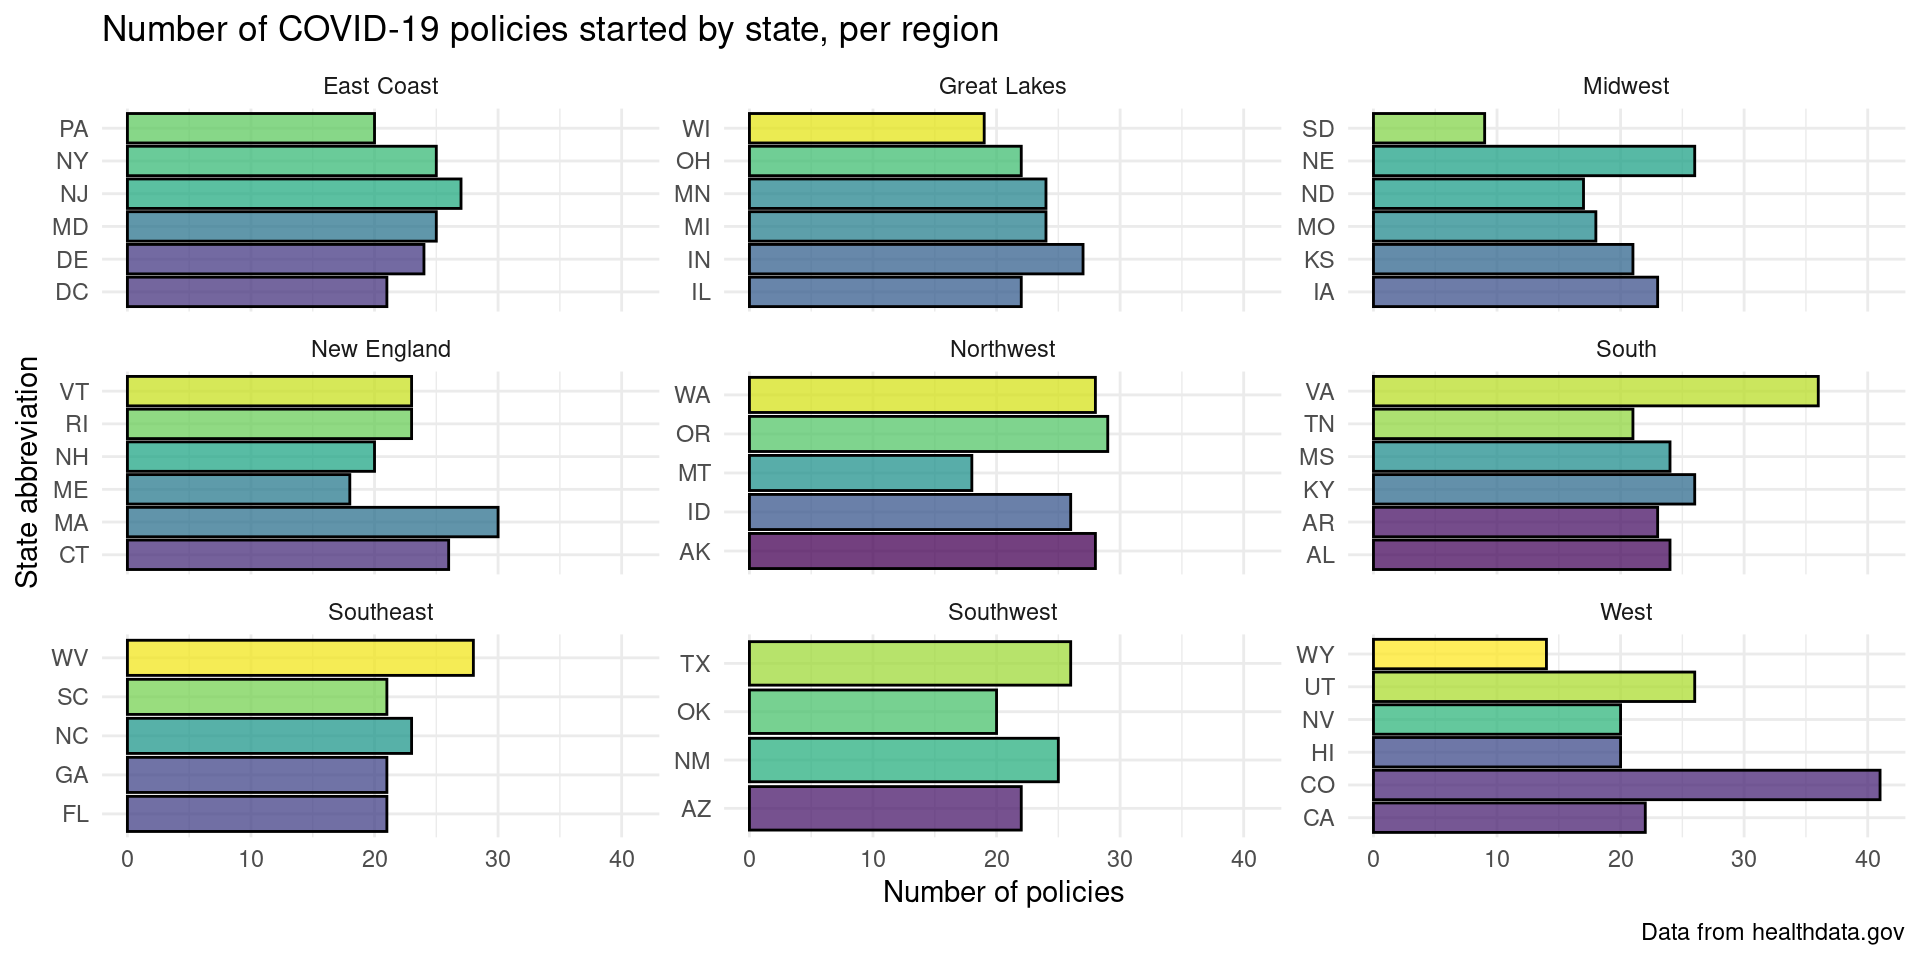
Modeling and analysis - Regional Analysis
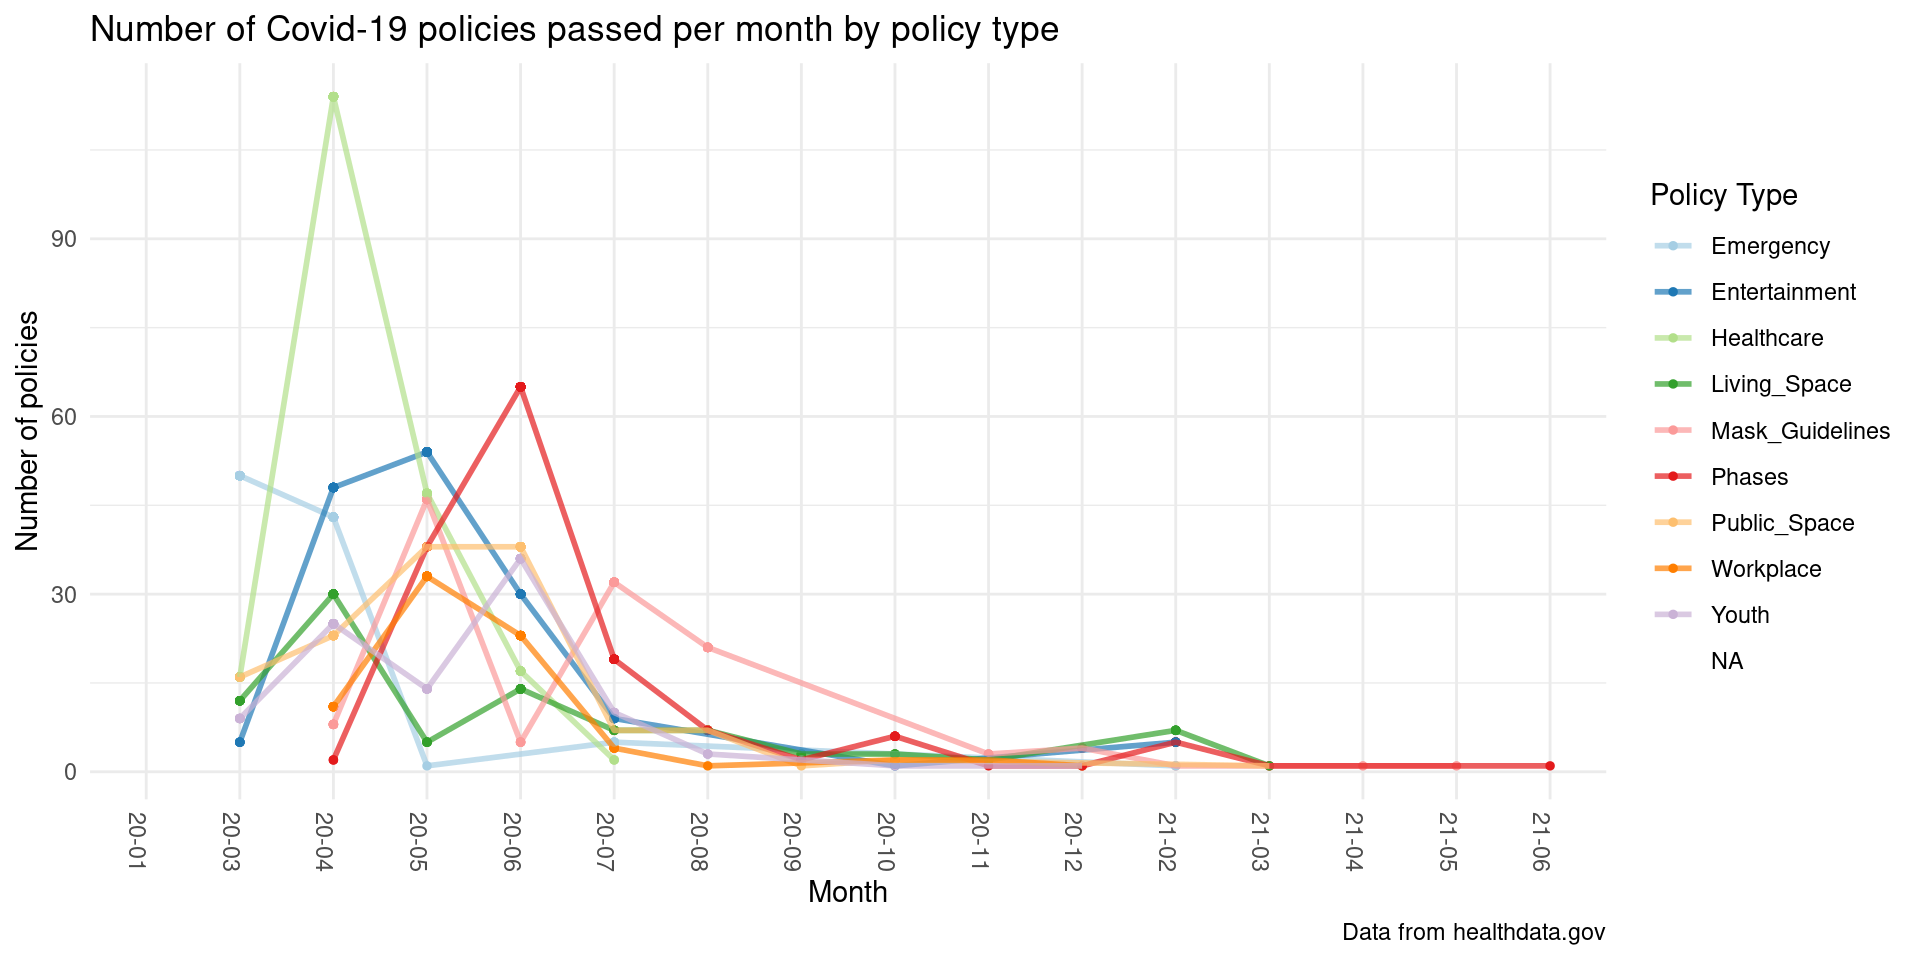
Covid Policy Type Analysis
Conclusions + future work
Colorado and Virginia passed the most COVID-19 policies, indicating they had particular fears of the spread of the virus.
The West region passed the most COVID-19 policies overall, suggesting that states in the Western US were most concerned about the passing and spread of COVID-19
The highest amount of COVID-19 policies were passed in April 2020, indicating most states passed quick legislation immediately following the breakout of the virus.
Healthcare-focused policies were the most common at the very beginning of the pandemic, before phase-based policies became the most common several months later.
Future work:
Explore if COVID-19 was handled the best in states and regions that passed the most policies
Use data from this study to inform future pandemic preparedness