NHL Win Rates
Does the home-court advantage exist in the NHL?
Phenomenal Buneary
Katherine Liu, Kendall Meyer, Robert Sawyers, Ishani Sengupta, Teddy Wolf
5/5/23
Our Topic
We tracked results from every NHL game since the 1917-18 season using data from FiveThirtyEight. We specifically focused on factors that may impact win proportions.
Research questions:
How do win rates differ between home and away games in the NHL?
Do win rates differ between playoff and non-playoff games?
Combining these two, does the home-court advantage exist during the playoff season?
Data Overview
To begin, we imported the data from FiveThirtyEight and were able to clean it by adding columns with the winner or loser of games, as well as whether the game was playoff or not.
- After skimming the data and many variables, we realized there are several aspects which we might focus on: home and away scores, and playoff versus regular season scores.
Highlights from EDA
Once we cleaned the data, we created a few visualizations.
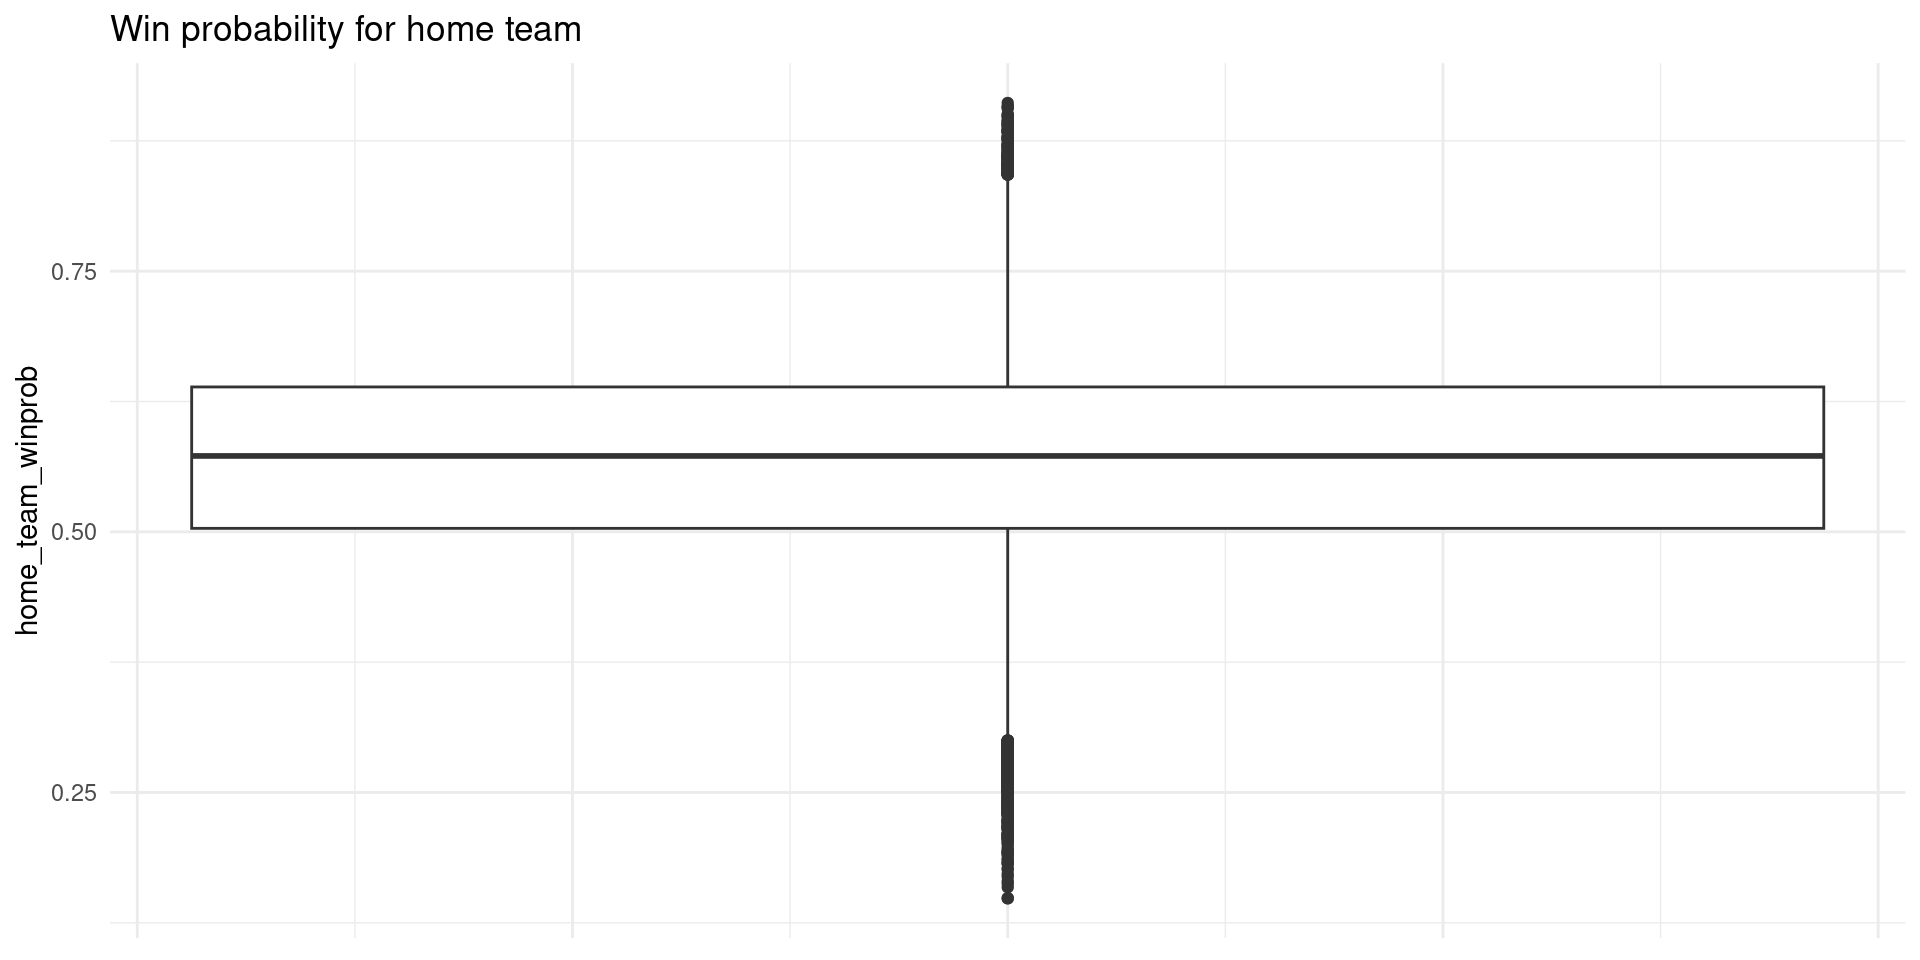
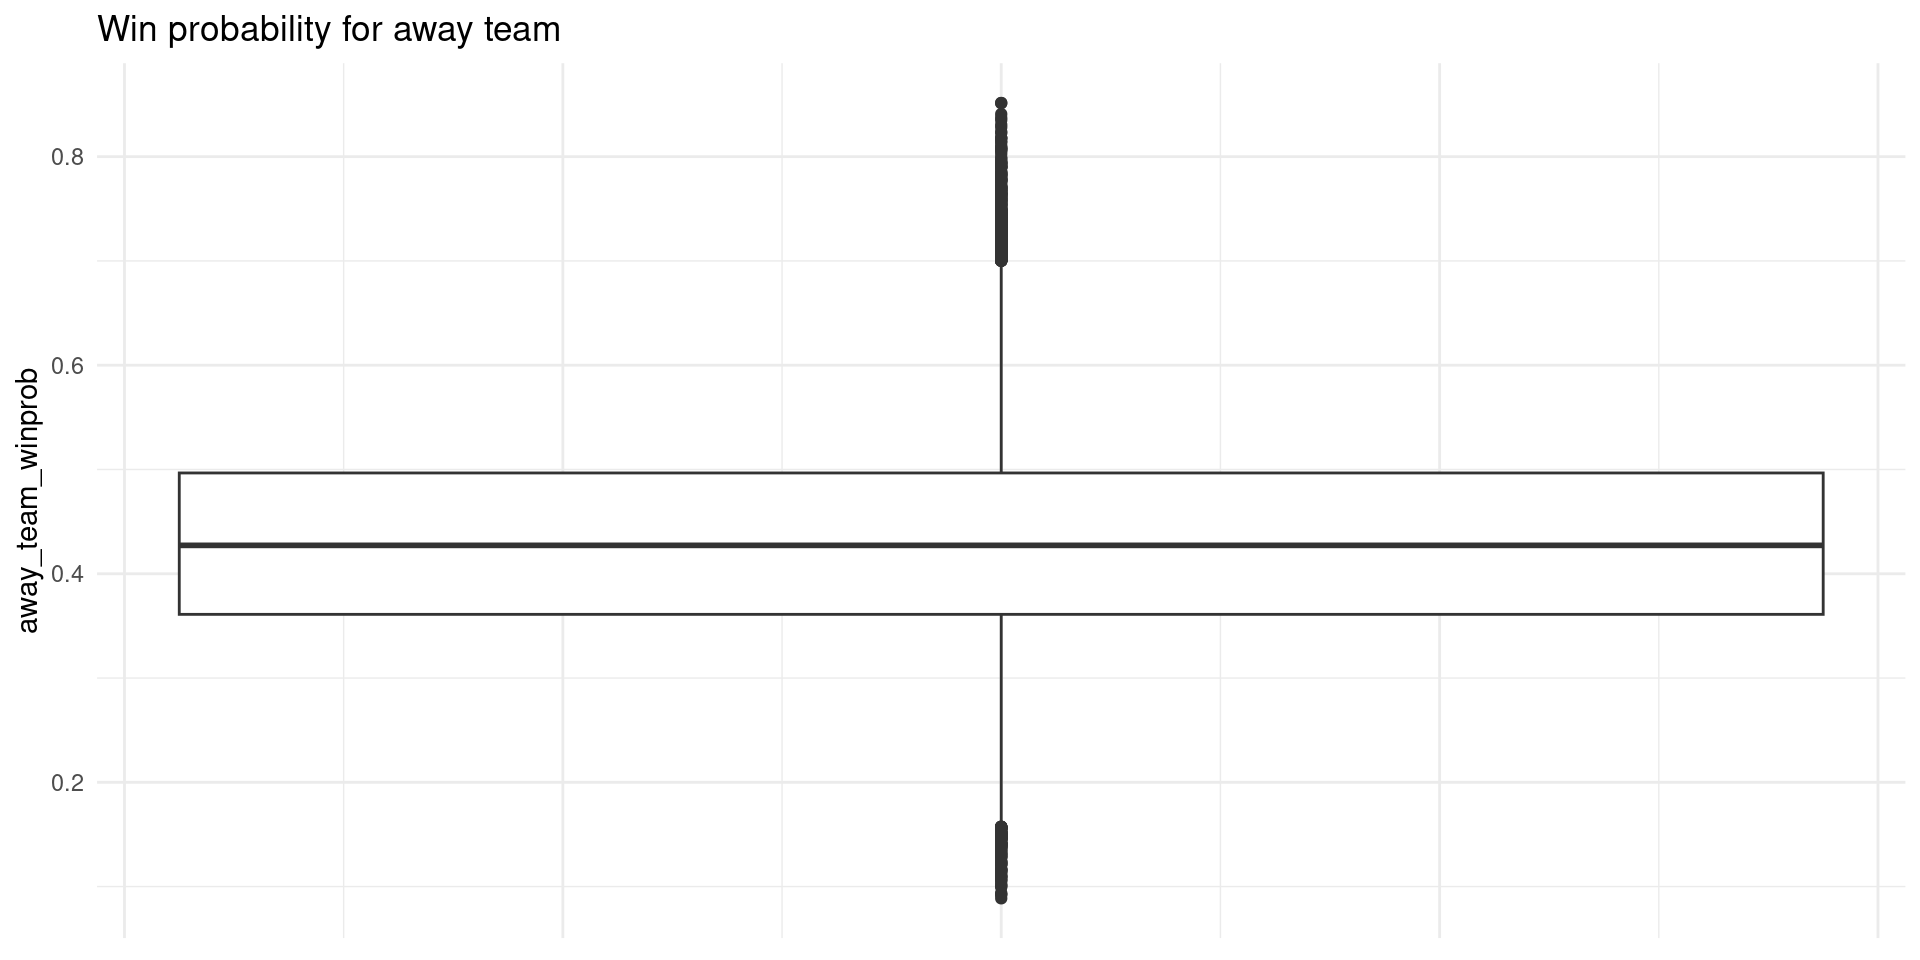
The mean win probability is higher for home teams than away
The outliers for away team probabilities had a larger range
Both home and away team probabilities increased at a similar rate in relation to higher scores (from scatterplot, not shown)
Inference/modeling/other analysis
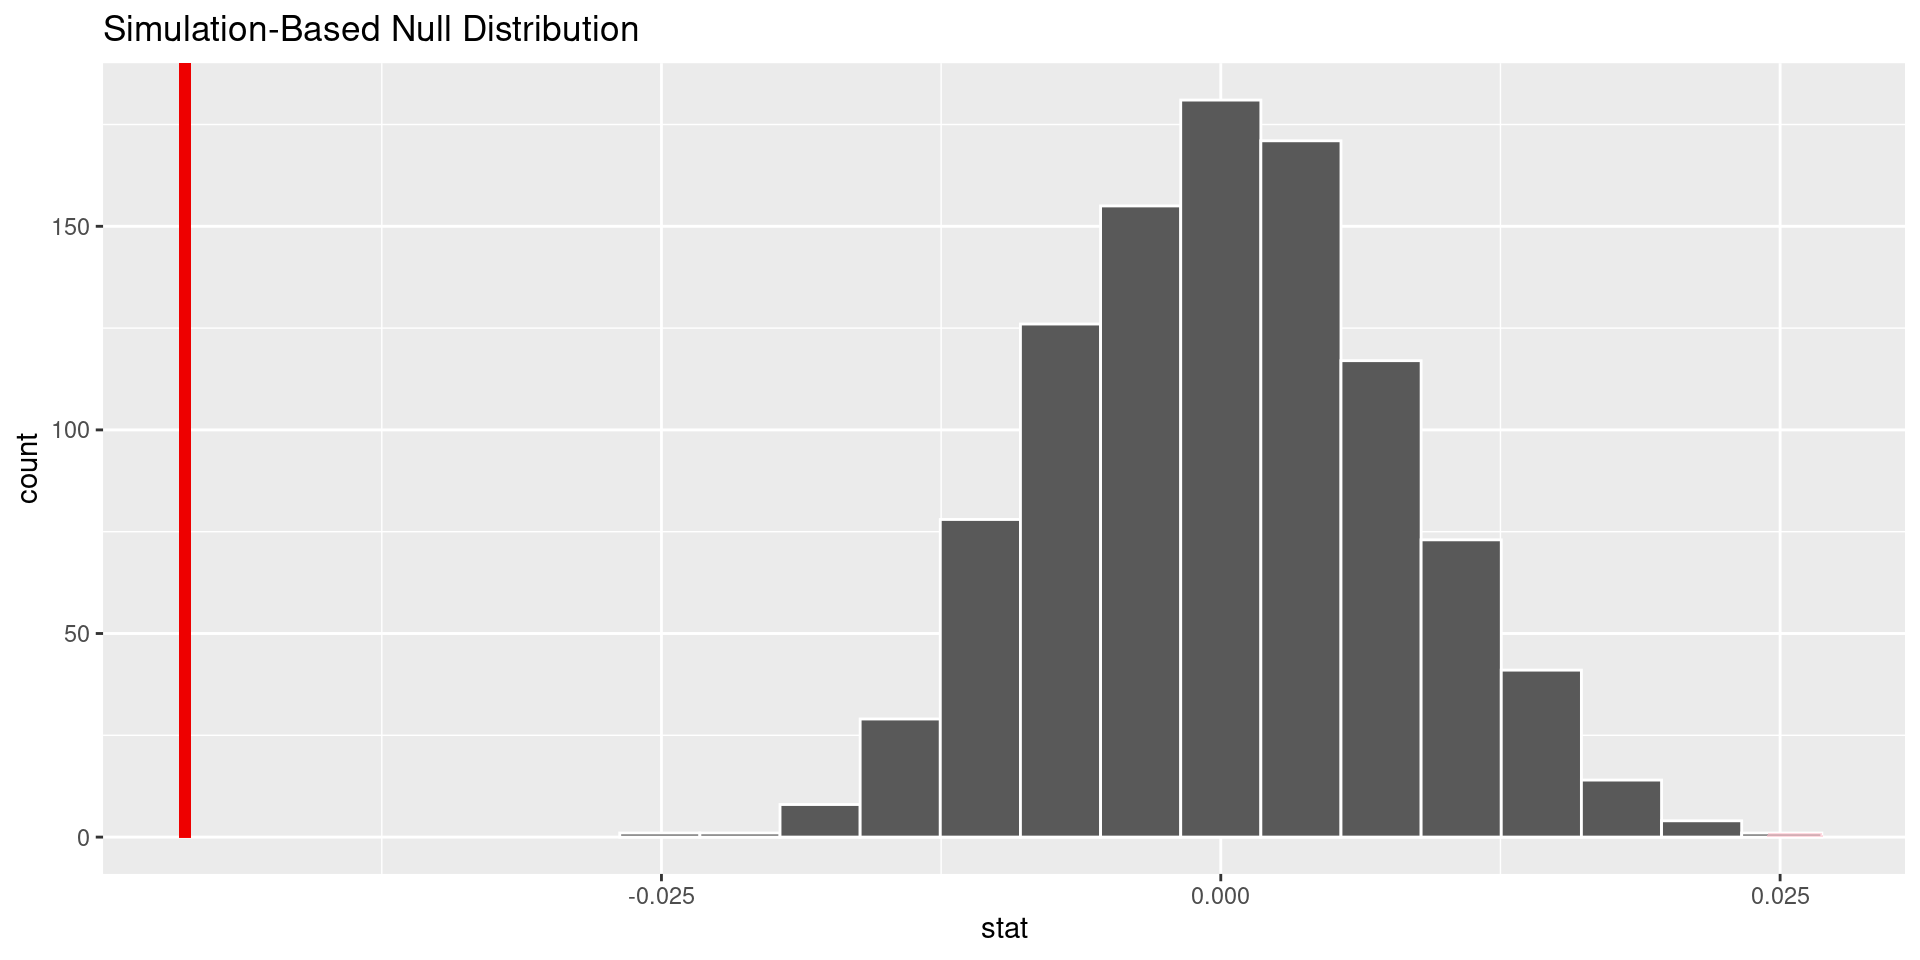
To answer our research questions, we first conducted 2 hypothesis tests, the first being a difference of proportions test for the proportion of home games won vs. the proportion of away games won. This test produced a p-value of ~0.001.
\[
H_0: P(win~|~home~game) = P (win~|~away~game)
\] \[
H_A: P(win~|~home~game) \neq P (win~|~away~game)
\]
The 2nd test is also a diff of props test for playoff vs. non-playoff wins.
\[
H_0: P(win~|~playoff) = P (win~|~nonplayoff)
\] \[
H_A: P(win~|~playoff) \neq P (win~|~nonplayoff)
\] p = ~0.001
Inference/modeling/other analysis
Our third hypothesis test is a diff of props on the proportion of home games won vs. the proportion of away games won, filtered for playoff games only.
\[
H_0: PlayoffPct(win~|~home) = PlayoffPct(win~|~away)
\]
\[
H_A: PlayoffPct(win~|~home) \neq PlayoffPct(win~|~away)
\]
This test also returned a p-value of ~0.001.
Conclusions + future work
We evaluated our hypotheses with a standard significance level of 5%. Due to all of the p-values being less than 5%, we rejected all of the null hypotheses. We can conclude:
- The proportion of wins does differ for home and away games, as well as playoff and non-playoff games, and finally for home and away games during playoffs.
Future Exploration:
Will win proportions be affected by other key variables not in the dataset, like player injuries?
Was the dataset biased towards certain teams or regions?
Did these trends change over time and how?