# A tibble: 10 × 10
   Title                 `Rotten Tomatoes` Netflix Hulu  `Prime Video` `Disney+`
   <chr>                             <int> <chr>   <chr> <chr>         <chr>
 1 Breaking Bad                        100 Yes     No    No            No
 2 Stranger Things                      96 Yes     No    No            No
 3 Attack on Titan                      95 Yes     Yes   No            No
 4 Better Call Saul                     94 Yes     No    No            No
 5 Dark                                 93 Yes     No    No            No
 6 Avatar: The Last Air…                93 Yes     No    Yes           No
 7 Peaky Blinders                       93 Yes     No    No            No
 8 The Walking Dead                     93 Yes     No    No            No
 9 Black Mirror                         92 Yes     No    No            No
10 The Queen's Gambit                   92 Yes     No    No            No
# ℹ 4 more variables: exclusive_netflix <lgl>, exclusive_hulu <lgl>,
# exclusive_prime_video <lgl>, exclusive_disney_plus <lgl>Streaming Wars
A Data-Driven Comparison of Exclusive and Non-Exclusive Shows on Popular Streaming Platforms
5/5/23
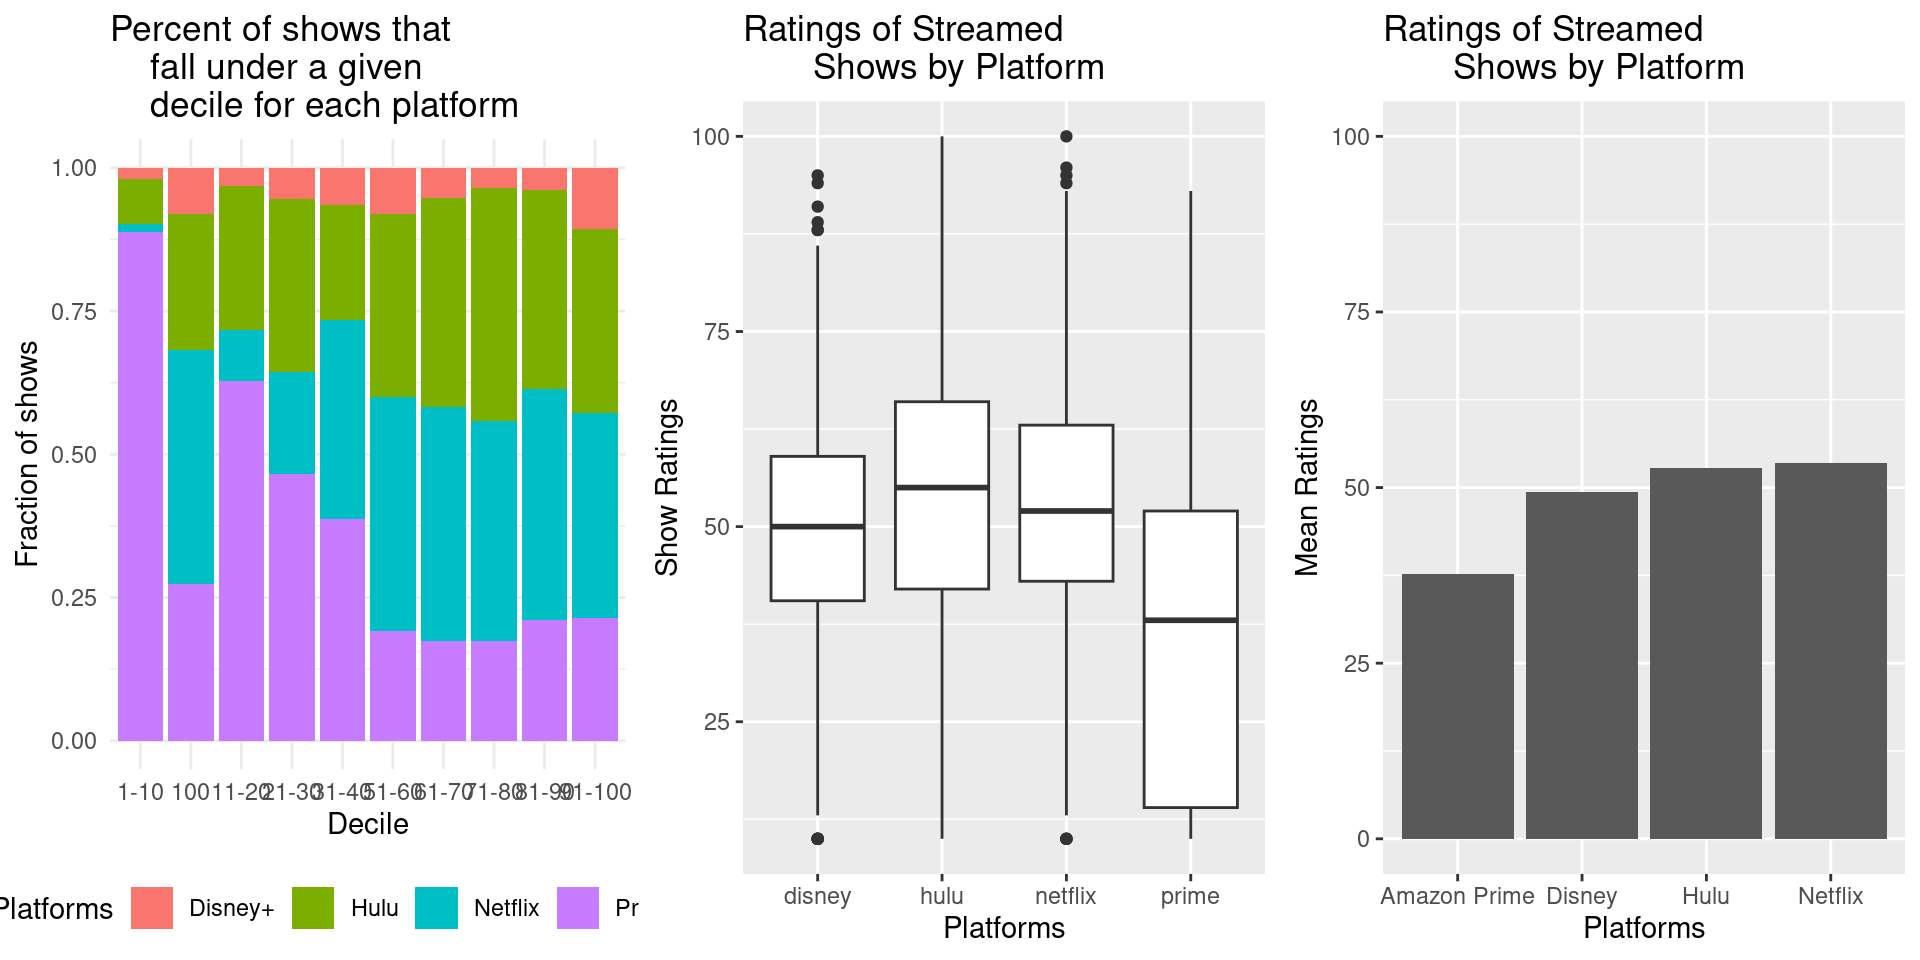
Highlights from EDA
Hypothesis Test #1
RQ #1: Is the quality of exclusive shows in the four platforms different from non-exclusive shows?
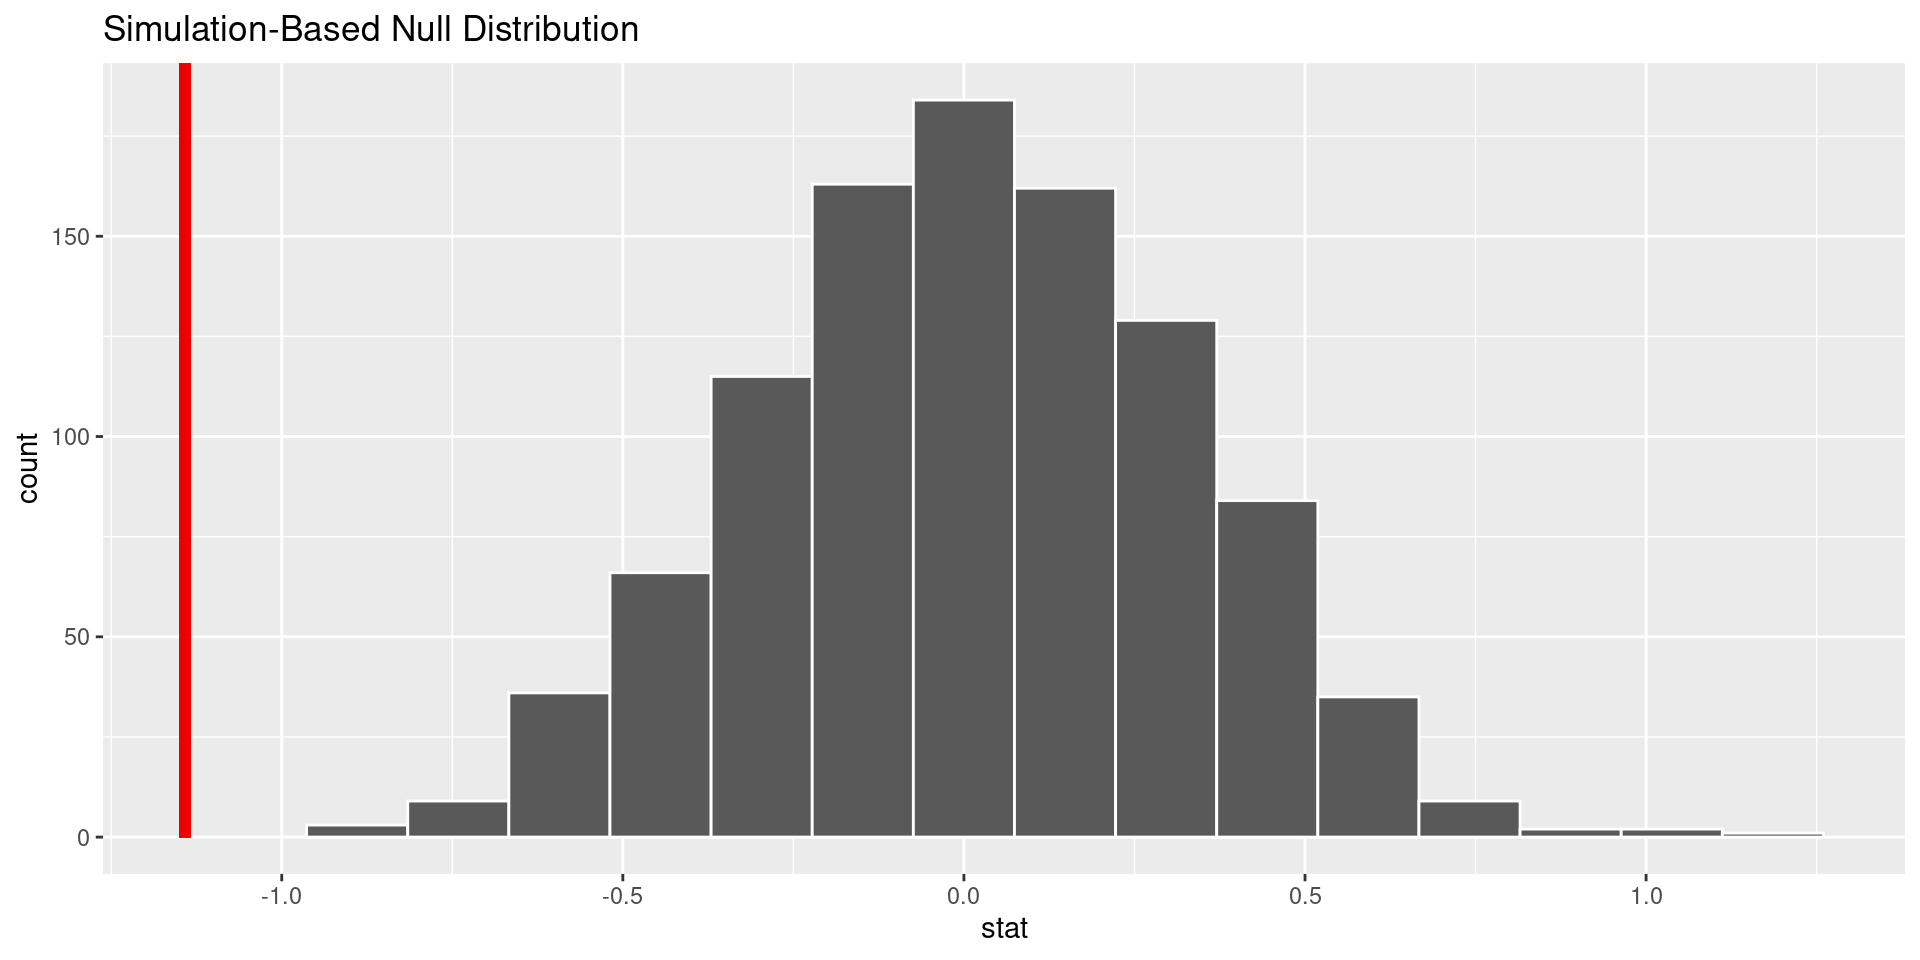
Null Hypothesis: The average Rotten Tomatoes score of exclusive shows is less than the average Rotten Tomatoes score of non-exclusive shows across all four platforms.
\[ H_0: \mu_{exclusive} < \mu_{non-exclusive} \]
Alternate Hypothesis: The average Rotten Tomatoes score of exclusive shows is greater than the average Rotten Tomatoes score of non-exclusive shows across all four platforms.
\[ H_A: \mu_{exclusive} > \mu_{non-exclusive} \]
Result: p-value = 0.001, we reject the null hypothesis.
Hypothesis Test #2
RQ #2: Are exclusive shows’ ratings different between the four platforms?
Null Hypothesis: There is no difference in quality of the exclusive shows between the four platforms.
\[ H_0: μ1 = μ2 = μ3 = μ4 \]
Alternate Hypothesis: There is a difference in quality of the exclusive shows between the four platforms.
\[ H_A: μ1 ≠ μ2 ≠ μ3 ≠ μ4 \]
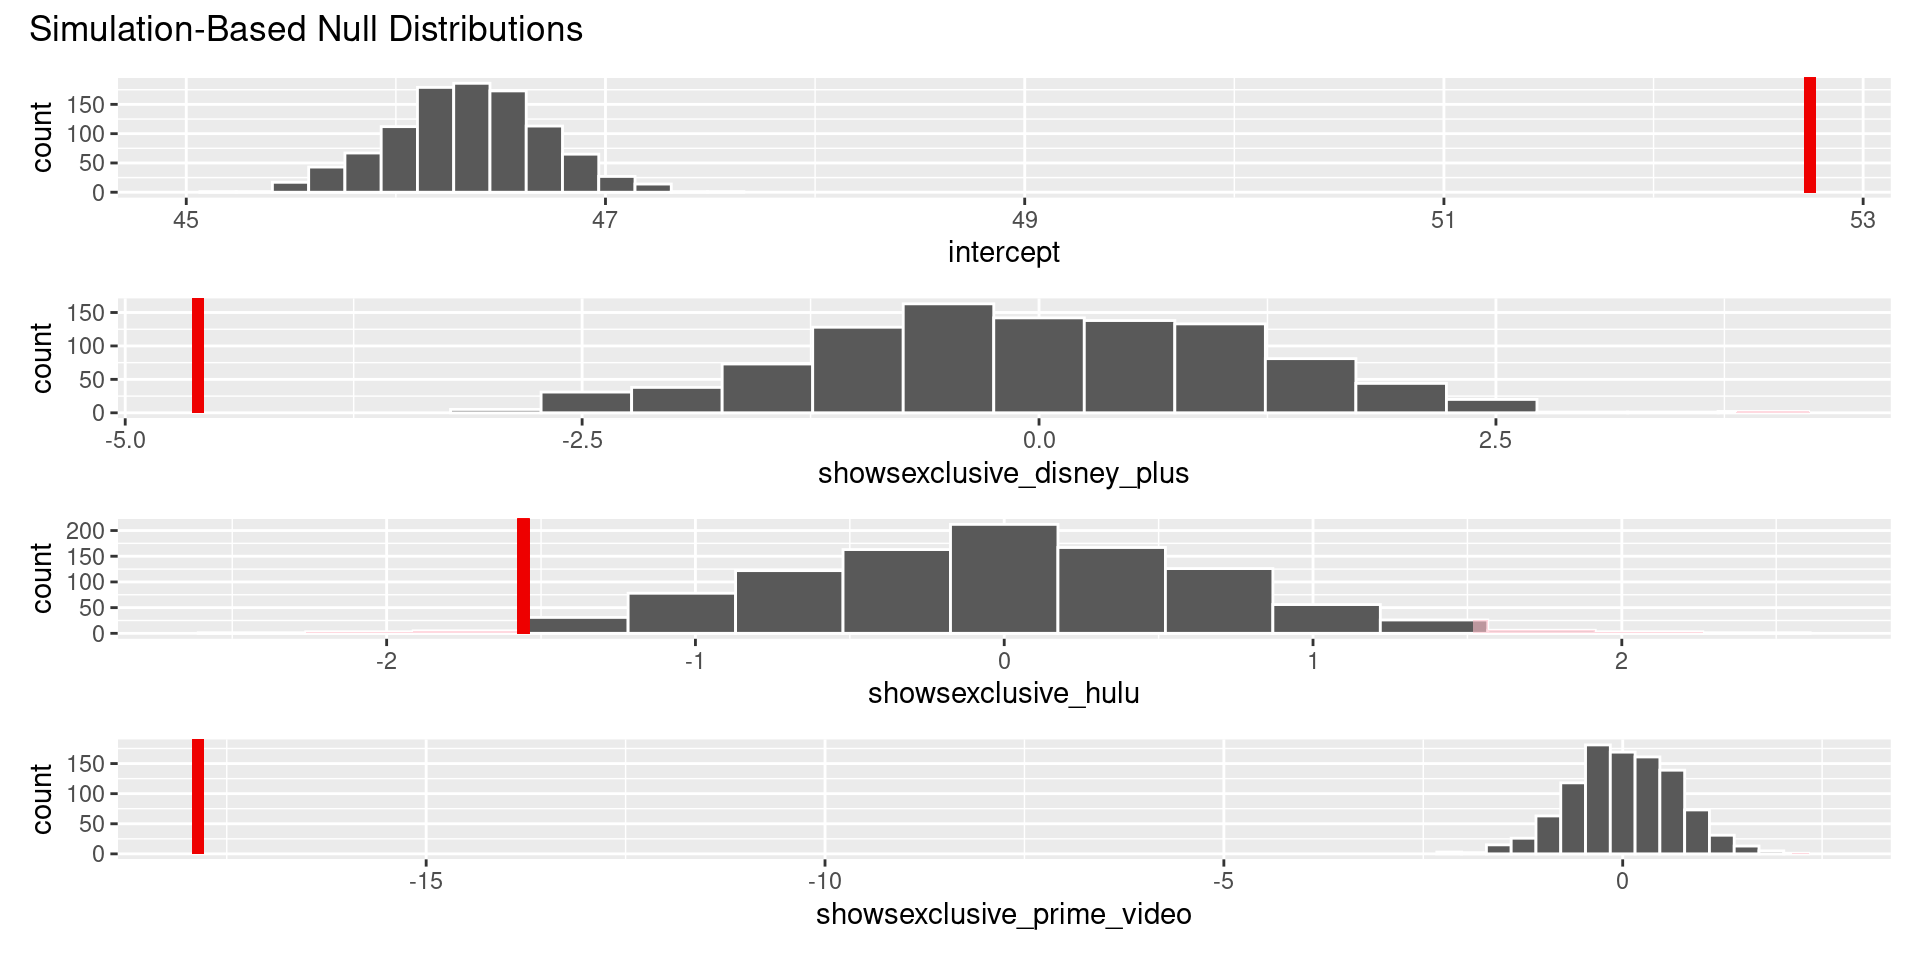
Results: Point Estimates: Intercept (52.75), Exclusive: Disney+ (-4.60), Hulu (-1.56), Prime Video (-17.86) P-Values: Intercept (0.001), Exclusive: Disney+ (0.001), Hulu (0.02), Prime Video (0.001)