Accident Severity in New York State
Report based on recorded vehicle accidents (2016-2021)
5/5/23
Introduce the topic and motivation
For our research project we utilized accident data in NY state to categorize different accidents by severity and utilized regression models to predict the severity based on surrounding characteristics such as weather and surrounding traffic infrastructure.
The motivation behind our data manipulation was to show what conditions led to more severe accidents and to help emergency responders and services better prepare and locate their resources based on conditions.
Introduce the data
This data comes from the paper Moosavi, Sobhan, Mohammad Hossein Samavatian, Srinivasan Parthasarathy, and Rajiv Ramnath. “A Countrywide Traffic Accident Dataset.”, 2019. This data set was posted to Kaggle.
While the data set originally contained information about traffic accidents around the country, we limited the data to NY state to increase personal relevance of our findings and make the data more manageable.
Highlights from EDA
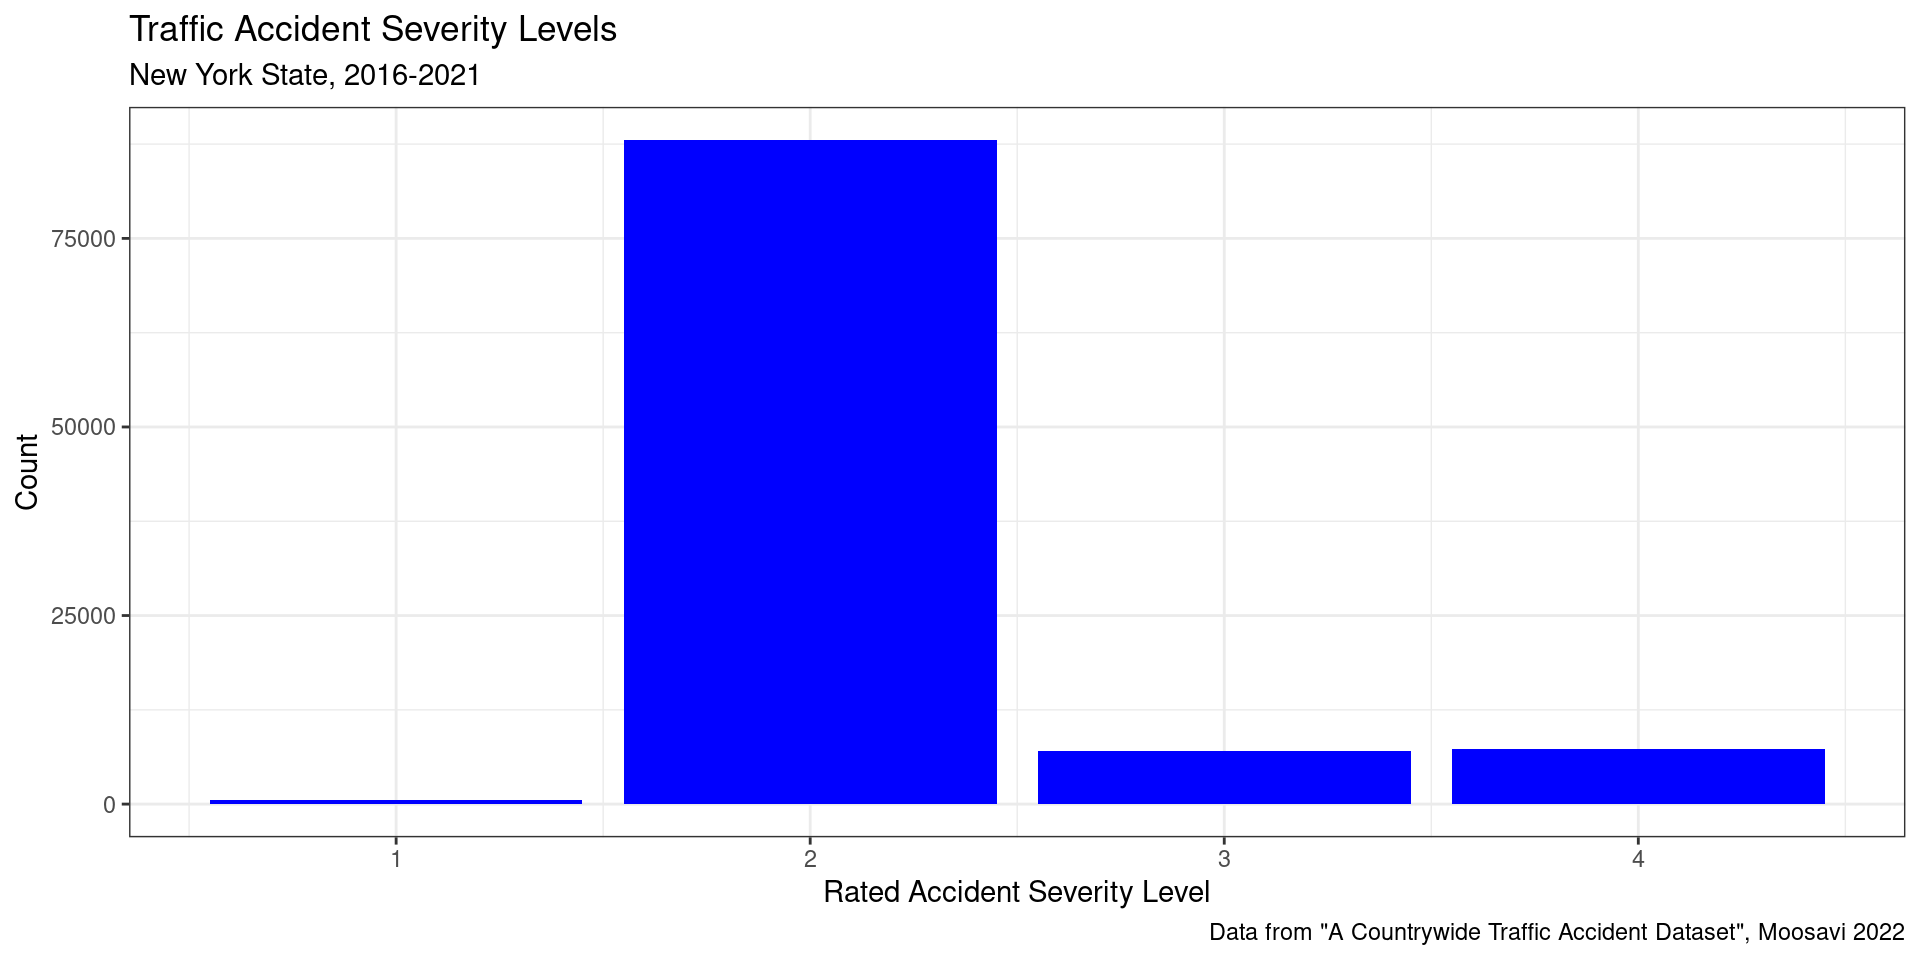
- Significant difference in each level of severity

- Solution: Group togther levels 1 and 2 as well as 3 with 4
Inference/modeling/other analysis
\[ \begin{equation*} \begin{aligned} \ln[p\ /\ (1-p)] = -0.404 + 0.42 \times \text{Precipitation.in} \ - \\ 0.006 \times \text{Visibility.mi} + 0.036 \times \text{WindSpeed.mph} \end{aligned} \end{equation*} \]
\[ \begin{split} \\ln[p\ /\ (1-p)] = -0.416 + 0.464 \times Precipitation.in \ + \\0.102 \times Junction - 0.005 \times Visibility.mi \ + \\ 0.037 \times WindSpeed.mph \ - \\0.190 \times Junction \times Precipitation.in \ - \\0.011 \times Junction \times Visibility.mi \ - \\ 0.009 \times Junction \times WindSpeed.mph \end{split} \]
Inference/modeling/other analysis
\[ \begin{split} H_0: P_{Day} - P_{Night} = 0 \\ H_a: P_{Day} - P_{Night} \neq 0 \end{split} \]

Conclusions + Future work
Additive Model: Precipitation and Wind Speed are statistically significantly
Interactive Model: Precipitation, Wind Speed are statistically significantly. Interaction between precipitation and junction is statistically significant.
Hypothesis Test: We cannot conclude that there is a difference in the proportion of severe accidents during the day vs the night in Tompkins county.
Future Work: Expand this study to the entire United States using the rest of the data. Fit machine learning classification models. Explore urban vs rural.