| Player Name | Player Age | Goals Scored |
|---|---|---|
| Son Heung-Min | 31 | 23 |
| Mohamed Salah | 31 | 23 |
| Cristiano Ronaldo | 38 | 18 |
| H. Kane | 30 | 17 |
| S. Mané | 31 | 16 |
Soccer Statistics Across Leagues
Henry Friedberg, Pranathi Adhikari, John Aclufi, Shara Shanmugasundaram
5/5/23
Topic and Motivation
Topic: Analyze offensive stats for soccer players in various leagues during 2021 season.
Motivation: Find relationships between soccer players, leagues, and their stats.
Research Questions:
- What factors influence booking frequency of players?
- Does aggressiveness differ between European and non-European leagues?
Data Introduction
Dataset contains the top 20 scorers from the top 27 football leagues for the 2021 league season.
Rows: Individual Players
Columns: Attributes (Ex: Bookings, Height, Rating, League)
The data is used by football fans, sports bettors, and researchers
Highlights from EDA Pt. 1

Analysis Pt. 1
# A tibble: 5 × 5
  term             estimate std.error statistic p.value
  <chr>               <dbl>     <dbl>     <dbl>   <dbl>
1 (Intercept)        9.18      5.62       1.63   0.103
2 player_height_cm   0.0344    0.0299     1.15   0.251
3 player_weight_lb  -0.0168    0.0128    -1.31   0.190
4 player_age        -0.0235    0.0336    -0.698  0.485
5 games_rating      -1.13      0.524     -2.15   0.0321
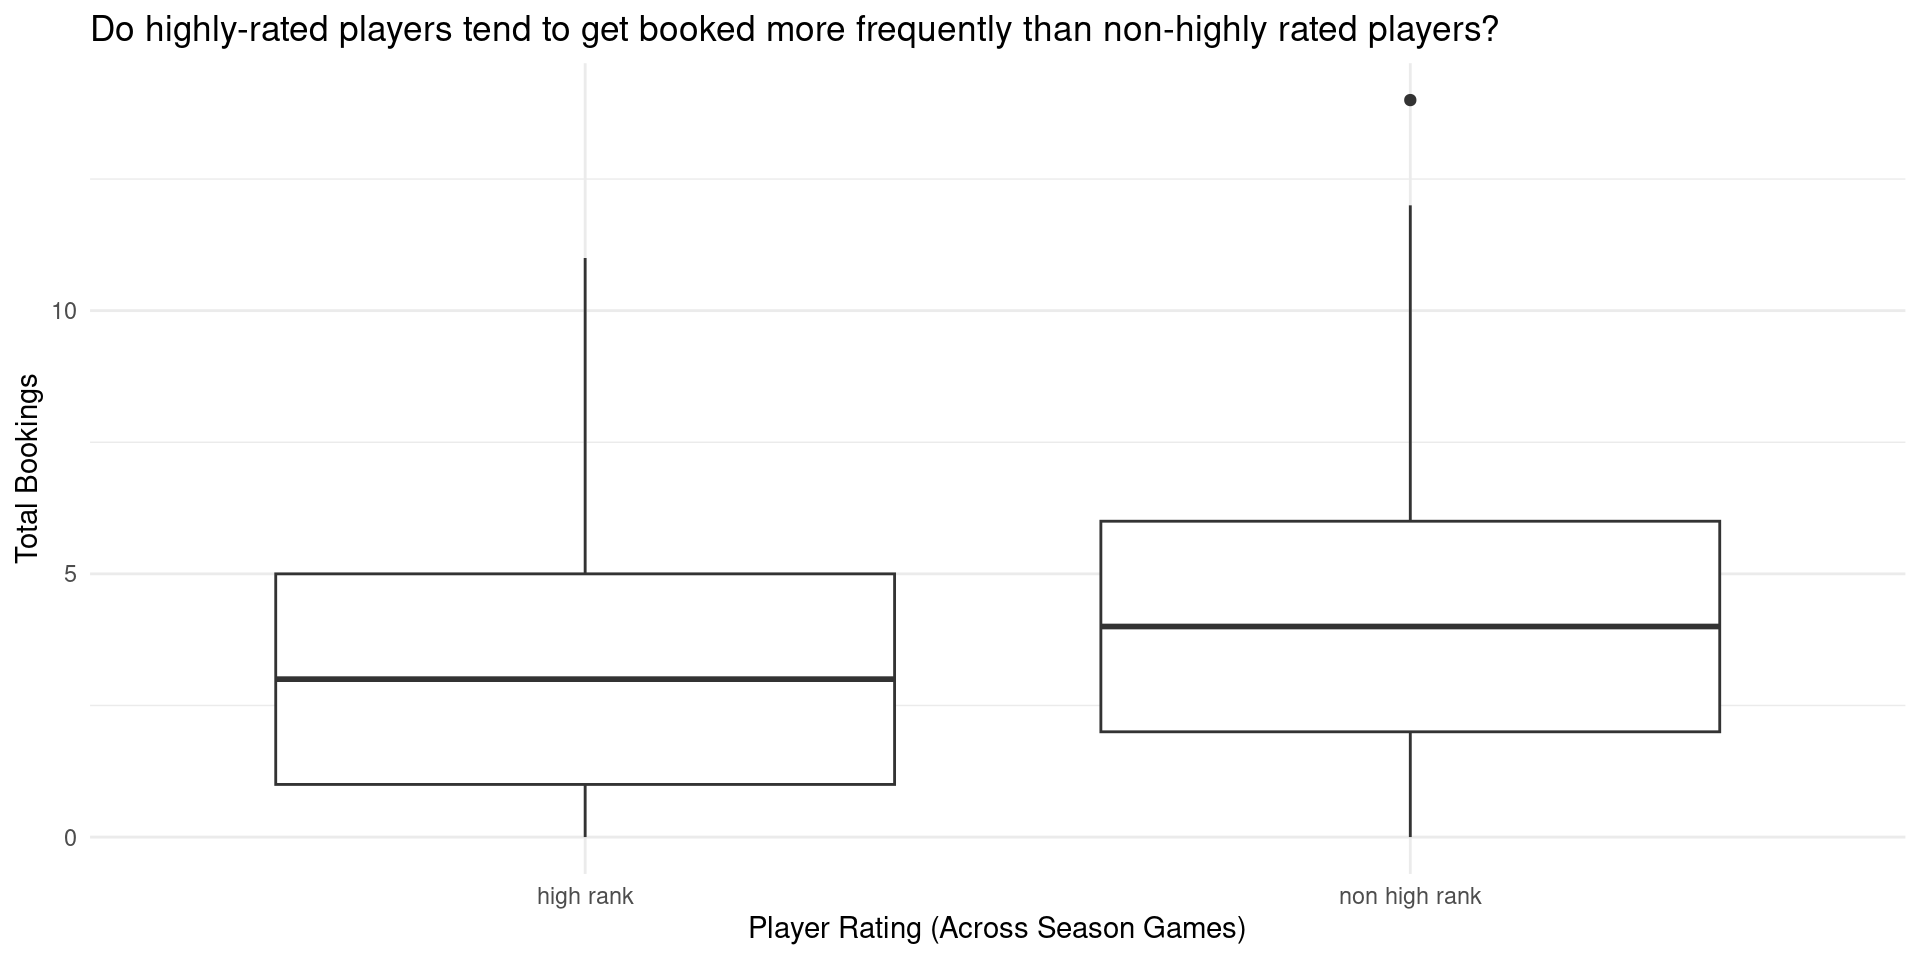
Used two-sided hypothesis test to determine whether or not the difference in true population means of highly rated players and non-highly rated players is significant
\(H_0 = \mu_{high} - \mu_{non-high} = 0\)
\(H_A = \mu_{high} - \mu_{non-high} \not= 0\)
Reject the null hypothesis (p-value = 0.02)
Conclusions Pt.1
Found that player rankings influence the bookings of players
- We are 95% confident that the difference between the true population means of bookings for non-highly ranked and highly ranked players is between 0.14 and 1.2 (i.e. positive), implying that non-highly ranked players are booked more than highly ranked players, on average
Highlights from EDA Pt. 2
Analysis Pt. 2
# A tibble: 5 × 5
  term                 estimate std.error statistic     p.value
  <chr>                   <dbl>     <dbl>     <dbl>       <dbl>
1 (Intercept)          -1.98      0.489      -4.04  0.0000528
2 avg_penalty_by_game  -2.76      1.51       -1.82  0.0686
3 avg_goals_per_min   305.       65.9         4.62  0.00000387
4 avg_shots_per_game   -0.196     0.210      -0.932 0.351
5 duels_total           0.00564   0.00106     5.29  0.000000120
Used two-sided hypothesis test to determine whether or not the difference in true population means of goals per minute/duels for European leagues and non-European leagues is significant
\(H_0 = \mu_{EU} - \mu_{non-EU} = 0\)
\(H_A = \mu_{EU} - \mu_{non-EU} \not= 0\)
Goals per minute: fail to reject the null hypothesis (p-value = 0.196)
Duels: reject the null hypothesis (p-value = 0)
Conclusion Pt. 2
Average goals per minute (a proxy for aggressiveness) does not differ between European and non-European leagues.
Total number of duels (a proxy for aggressiveness) differs between European and non-European leagues.
- We are 95% confident that the difference between the true population means of duels for European and non-European leagues is between 30.63766 and 86.54825 (i.e. positive), implying that European leagues duel more than non-European leagues, on average

