Introduction
I worked on this project with a team of 3 others: Noor-e-jehan Umar, Emily Sine, and Nolan Harrington.
Dataset
The United States Department of Agriculture collects quarterly survey data from beekeepers across the country to keep track of bee colony loss rates as well as risk factors. The bee colony datasets were used for TidyTuesday on January 11th, 2022 and contain information about colony numbers as well as colony health stressors from 2015-2021. Surveys were sent to operations which have reported having five or more bee colonies to the USDA.
In one dataset, called colony, each observation contains the year, the month range, and the state where colony numbers were reported. These numbers include number of colonies , maximum number of colonies, lost colonies, percentage lost, colonies added, colonies renovated, and percentage renovated within that time period. In the other dataset, called stressor, each observation contains the year, the month range, the state, the stressor (ie. the stress type experienced by the bees), and the percentage of bee colonies affected by the stressor in a given quarter. The dataset also takes into account that a colony can be affected by more than one stressor in the same quarter.
Question 1: Stressors and Colony Disappearance
What stressors are most common, and how are they related to colonies disappearing?
For this question, we will look at stressors based on geographical area as well as by season. We will then focus on the most common stressors and compare the number of stressed colonies to the number of colonies lost. From these results, we want to identify which conditions are most difficult for bee colonies to survive in. We are interested in this question because we believe that colony disappearance is closely associated with ecological stress. In 2019, US beekeepers reported their worst winter, citing losses of 40% of bee colonies despite more efforts over the past decade to combat colony loss (Milman). By exploring this data, we can determine which health stressors are most pervasive so that beekeepers can focus on implementing the proper protective measures.
Approach
Barplot
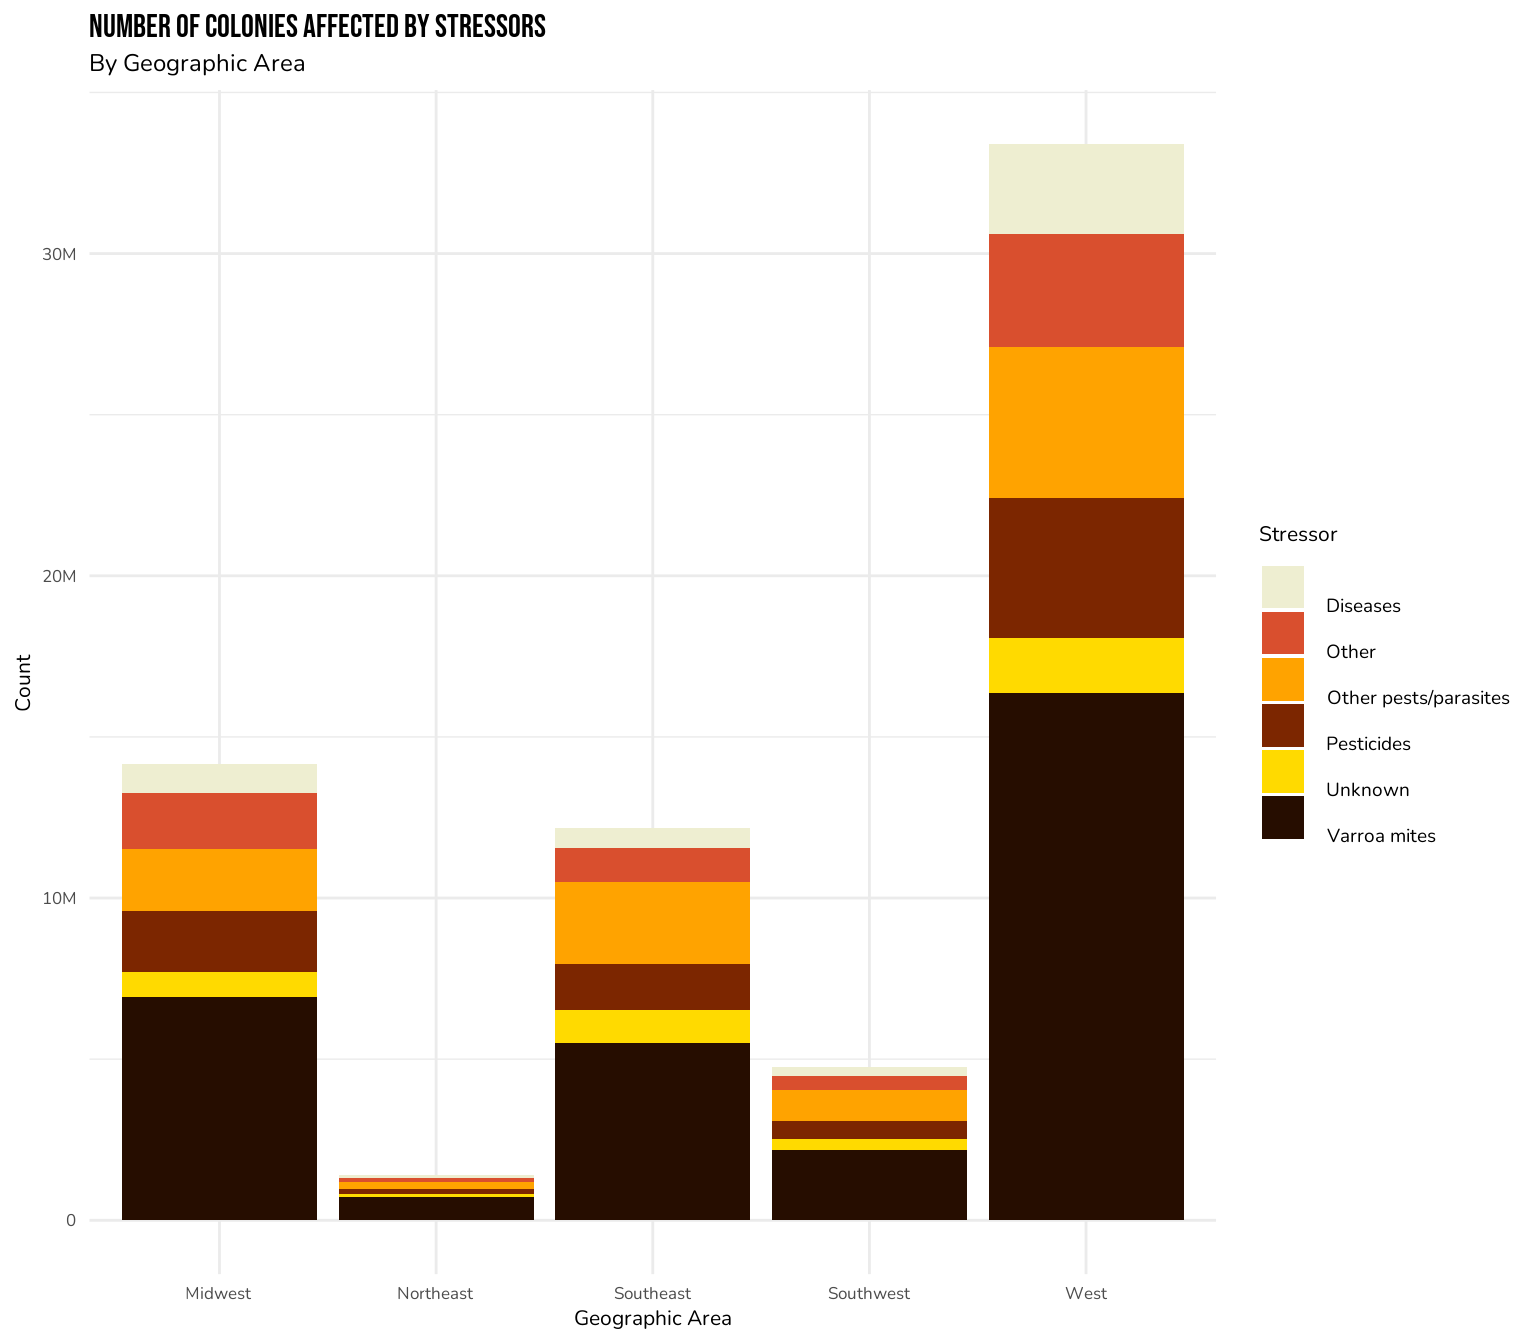
We will first create a stacked bar chart to explore which stressor is the most common across all colonies in each geographic region. We will do this by grouping by geographical area and stressor, and counting the total number of each stressor. We will show our results by putting the region on the x axis, count on the y axis, and coloring by the type of stressor. Because one datatype is discrete and the other two are categorical, a barplot is a simple but effective display of information. A barplot will help us determine which stressors are most common across regions so that we can then narrow down the data to look into the second part of our research question which surrounds colony loss.
Scatterplot
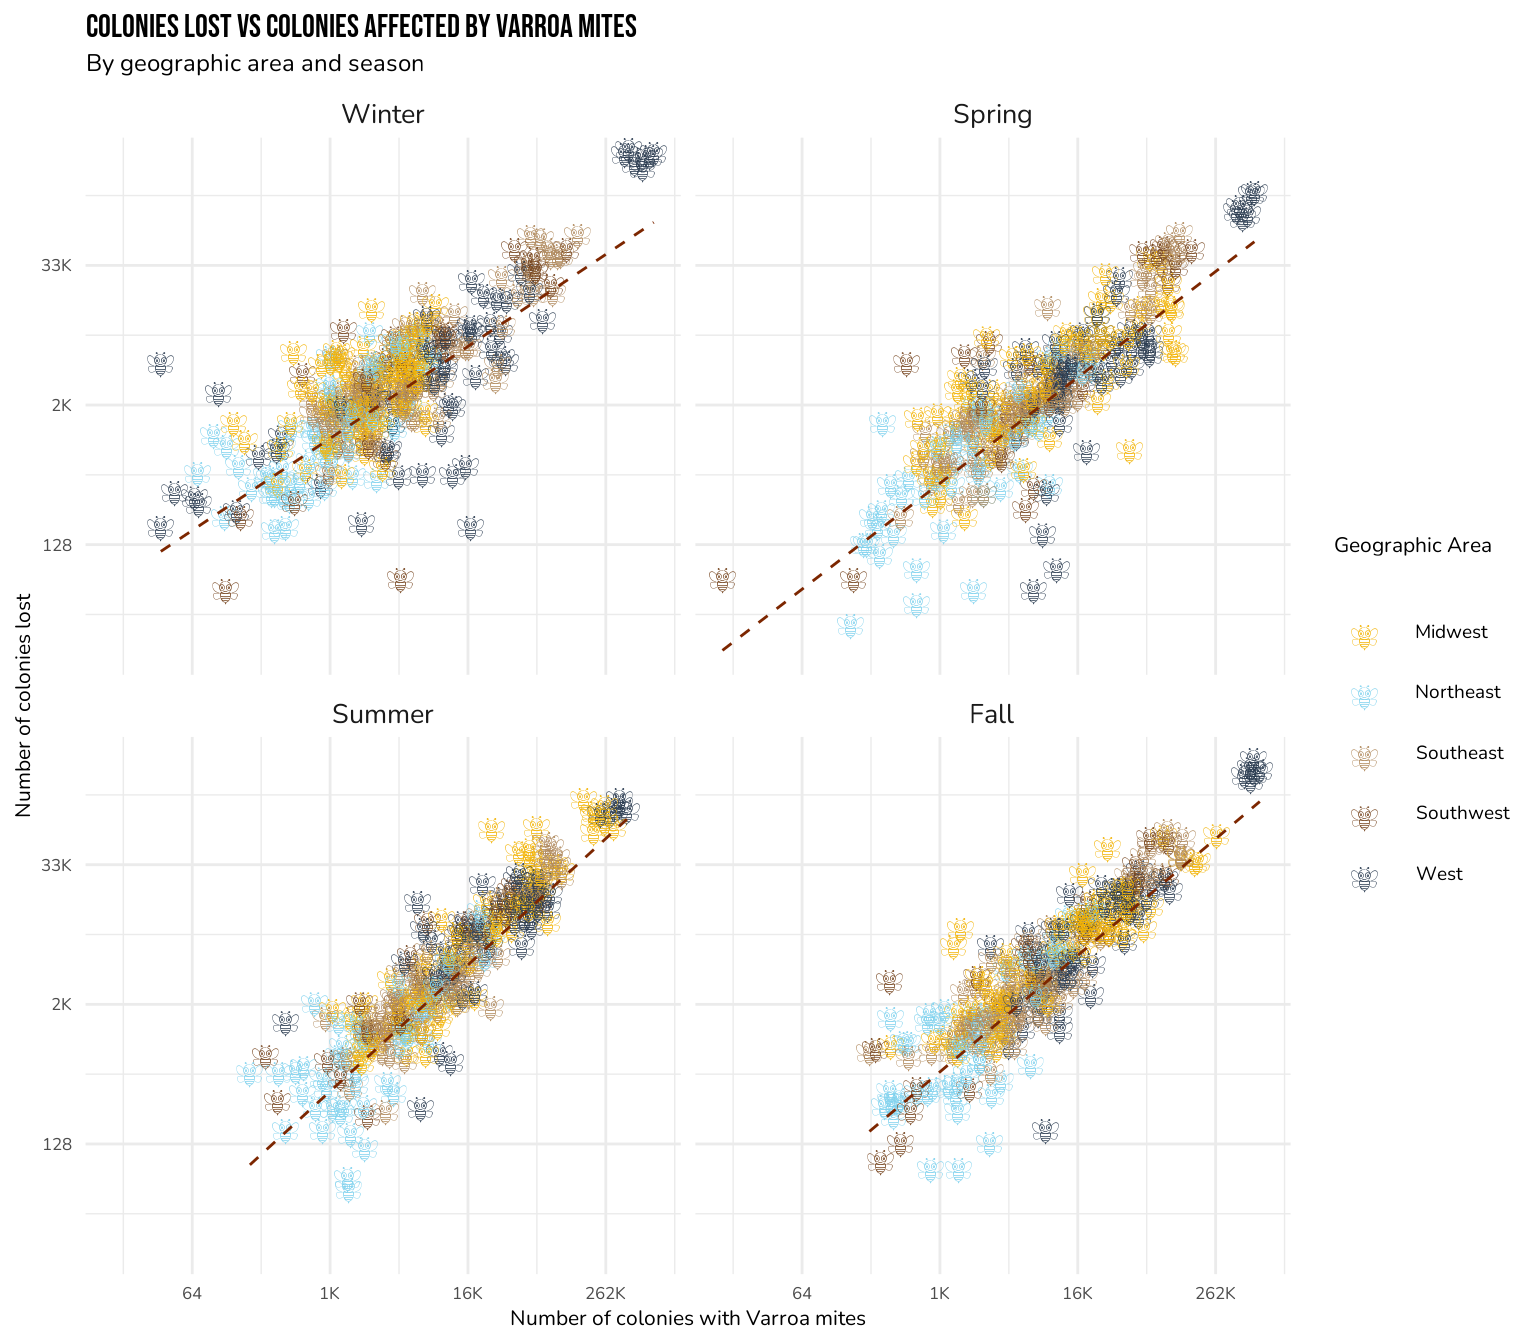
After identifying our top stressor, we will narrow down our approach to just focus on this stressor. This is because we believe the top stressor will give us more insights into potential relationships with renovations because it is more prevalent. For our second graph, we will create scatterplots, faceted by season, to explore the relationship between the number of colonies with the top stressor and the number of colonies lost. We decided to facet by season because the Varroa Mite infestation typically begins in fall (Hunt and Given). We will also color the points by geographic area to see if there are significant differences across geographic areas. We will use a logarithmic scale for the axes to reduce over-clustering. Finally, we will use smoothing lines in the scatter plots to identify if there are any significant relationships between the number of colonies with the top stressor and the number of colonies lost. We believe that this is the best visualization for this because it allows us to observe relationships between continuous variables easily, while faceting allows us to compare across different seasons.
NY State Plot
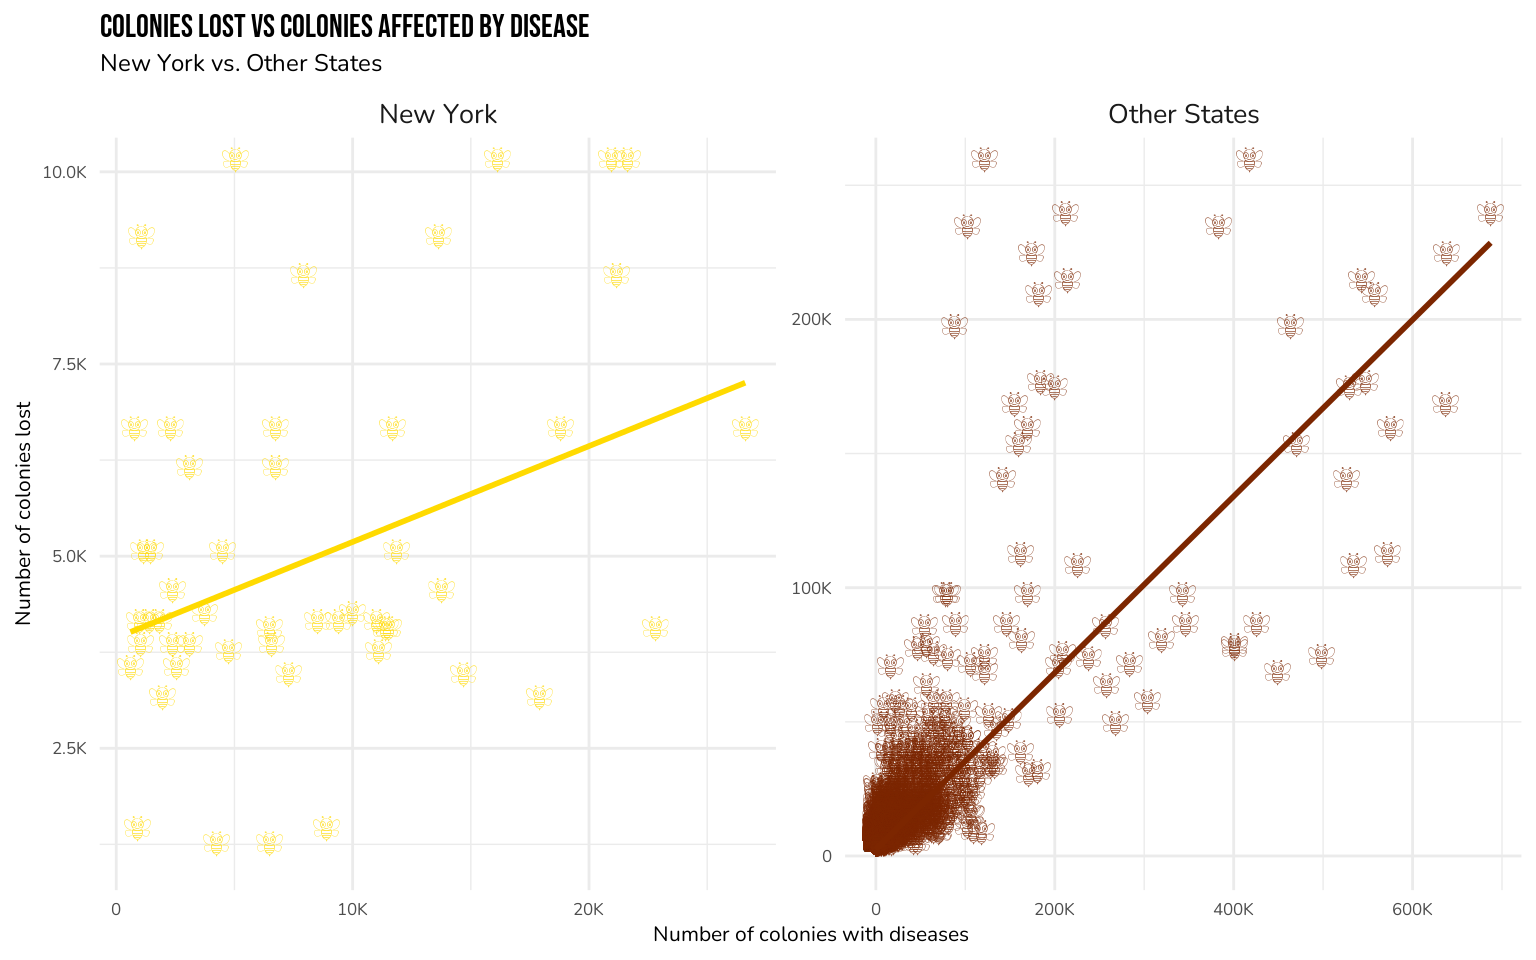
This graph looks at disease and infestation of all states and creates a faceted scatter plot of New York state against all other states. The scatter plot will demonstrate the number of colonies with disease on the x axis and colonies lost on the y axis. State will be colored on a discrete scale for New York vs not New York. This visualization is best as it shows the trend of disease and loss but highlights New York’s effort to target this phenomenon.
Analysis
Discussion
The stacked bar chart showed us that each geographical area had the same top stressor, Varroa mites. In fact, we saw that more than half of the colonies for each geographic region were affected by Varroa mites. We also noticed that certain geographic areas had significantly more counts of colonies stressed than others, specifically the West, which had more than twice the number of stressed colonies compared to other areas. This is the case for a couple of reasons, firstly that our categorization of “West” generally has significantly more colonies than the “North East”, maybe because the “West” has more land area. After realizing that the top stressor was Varroa mites, we changed our focus to look more closely at Varroa mites, since a lot of the colonies were affected by it.
The scatter plot highlighted that there was a positive correlation between the number of colonies with Varroa mites and the number of colonies lost. It was interesting to note that a few states in the West had the most number of mites as well as the most number of colonies lost. This makes sense because in our stacked barchart, we observed that there are a lot more colonies in the West compared to other geographic areas. Varroa mites need warmer temperatures and typically begin the infestation in fall. They can be undetectable if the farmer is unaware and uses the heat from the bee brood. There are more cases in the west because of the temperature. This could also explain why we saw more colony loss in the winter.
Furthermore, this also makes sense because when we were doing research on policy initiatives towards combating bee stressors, we saw a lot of the focus was on Varroa mites. In the ‘National Strategy to Promote the Health of Honey Bees and Other Pollinators’ released by the Pollinator Health Task Force within the White House, they talked about how they were focused on combating Varroa mites in the US bee colonies. Our visualizations support this because we see that Varroa mites are the most common stressor and probably need the most attention.
Through our policy research we discovered that New York state has been implementing strategies to save bee colonies since 2014 (Article 15). One of these initiatives is state level inspection of bee colonies prior to transport. When bees or queens are transported between colonies, they can sometimes carry with them disease. New York’s policy specifically addresses this – so we decided to see if New York had a noticeably lower rate of colony loss due to disease. From our findings, we see that New York state does in fact lose much less to disease than other states, as the maximum number of colonies lost is more than 20 times less than some of the other states. We cannot declare causation, however, because environmental factors like temperature play a large role in the high rates of collapse in western states.
To see part two of this project, go here.
Data
Mock, Thomas, 2022, “Bee Colonies,” Tidy Tuesday: A weekly data project aimed at the R ecosystem, viewed 16 February 2023, https://github.com/rfordatascience/tidytuesday/tree/master/data/2022/2022-01-11.
References
“Colony Collapse, Climate Change and Public Health Explained.” GW Online Public Health, 19 Sep 2019, https://onlinepublichealth.gwu.edu/resources/colony-collapse-climate-change-public-health/. Accessed 28 Feb 2023.
“Honey Bee Colonies.” USDA, National Agricultural Statistics Service, 2022, https://usda.library.cornell.edu/concern/publications/rn301137d?locale=en. Accessed 28 Feb 2023.
Hunt, Greg & Given, Kristen. Entomology, P. E. “SELECTING A TERMITE CONTROL SERVICE.” Purdue University, https://extension.entm.purdue.edu/publications/E-2/E-2.html. Accessed 3 Mar 2023.
“Legislation.” NY State Senate, https://www.nysenate.gov/legislation/laws/AGM/A15. Accessed 3 Mar 2023.
Milman, Oliver. “US Beekeepers Lost 40% of Honeybee Colonies over Past Year, Survey Finds.” The Guardian, 19 June 2019, https://www.theguardian.com/environment/2019/jun/19/us-beekeepers-lost-40-of-honeybee-colonies-over-past-year-survey-finds. Accessed 28 Feb 2023.
Mock, Thomas, 2022, “Bee Colonies,” Tidy Tuesday: A weekly data project aimed at the R ecosystem, viewed 16 February 2023, https://github.com/rfordatascience/tidytuesday/tree/master/data/2022/2022-01-11.
The White House. “National Strategy to Promote the Health of Honey Bees and Other Pollinators.” Pollinator Health Task Force, 2015, https://obamawhitehouse.archives.gov/sites/default/files/microsites/ostp/Pollinator%20Health%20Strategy%202015.pdf. Accessed 2 Mar 2023.