Introduction
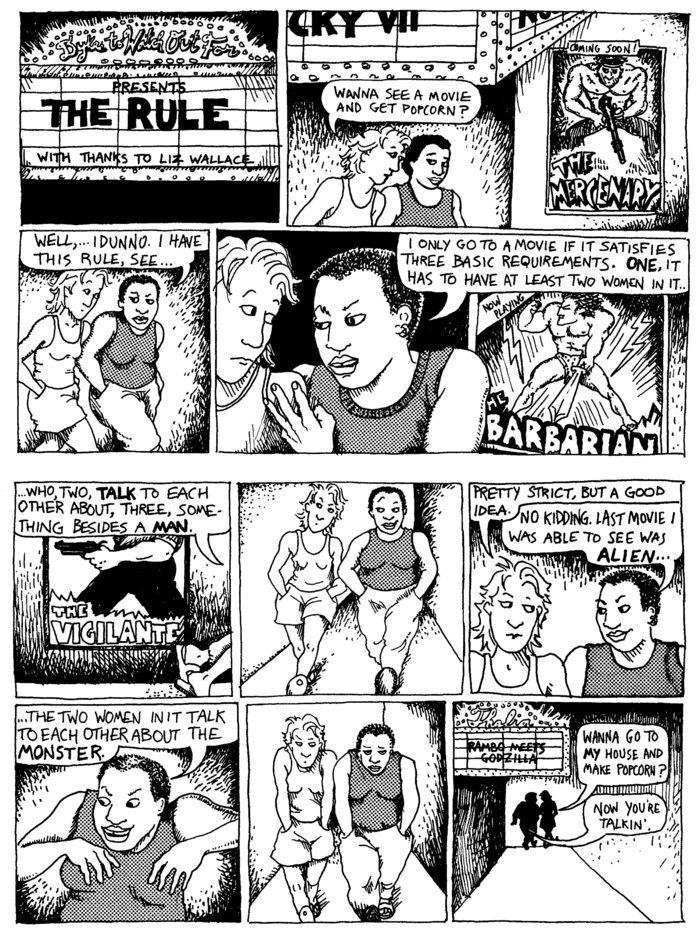
The Bechdel test was created in 1985 and is used to measure gender bias in Hollywood. If a movie includes two women who have a conversation together that is not about a male character, it passes the test. The test is based on this comic created by Alison Bechdel in 1985:
The dataset I will be using consists of two DataFrames, raw_bechdel.csv, which includes Bechdel test results from 1970-2020, and movies.csv, which includes thorough metadata and Bechdel test results for movies from 1970-2013. This dataset is provided by TidyTuesday and FiveThirtyEight.
Dataset: Bechdel Test Data
Question: How has gender bias in the movie industry changed over time and to what extent are we rewarding movies which pass the Bechdel Test?
I am interested in seeing whether or not the movie industry has evolved overtime to allow for more serious character development for female roles. My intuition is that the movie industry has made some progress, as we continue to see more diverse people represented in movies and winning awards. I am curious to see tangible differences between movies which pass the Bechdel test vs fail it such as the amount of money spent to create the movie, the amount of money the movie makes, and the ways that we as an audience are responding to them. I want to assess this based on audience ratings as well as awards. I would hope to see that we are giving higher ratings and paying more to see movies that pass, but I hypothesize that this might not be the case.
Approach
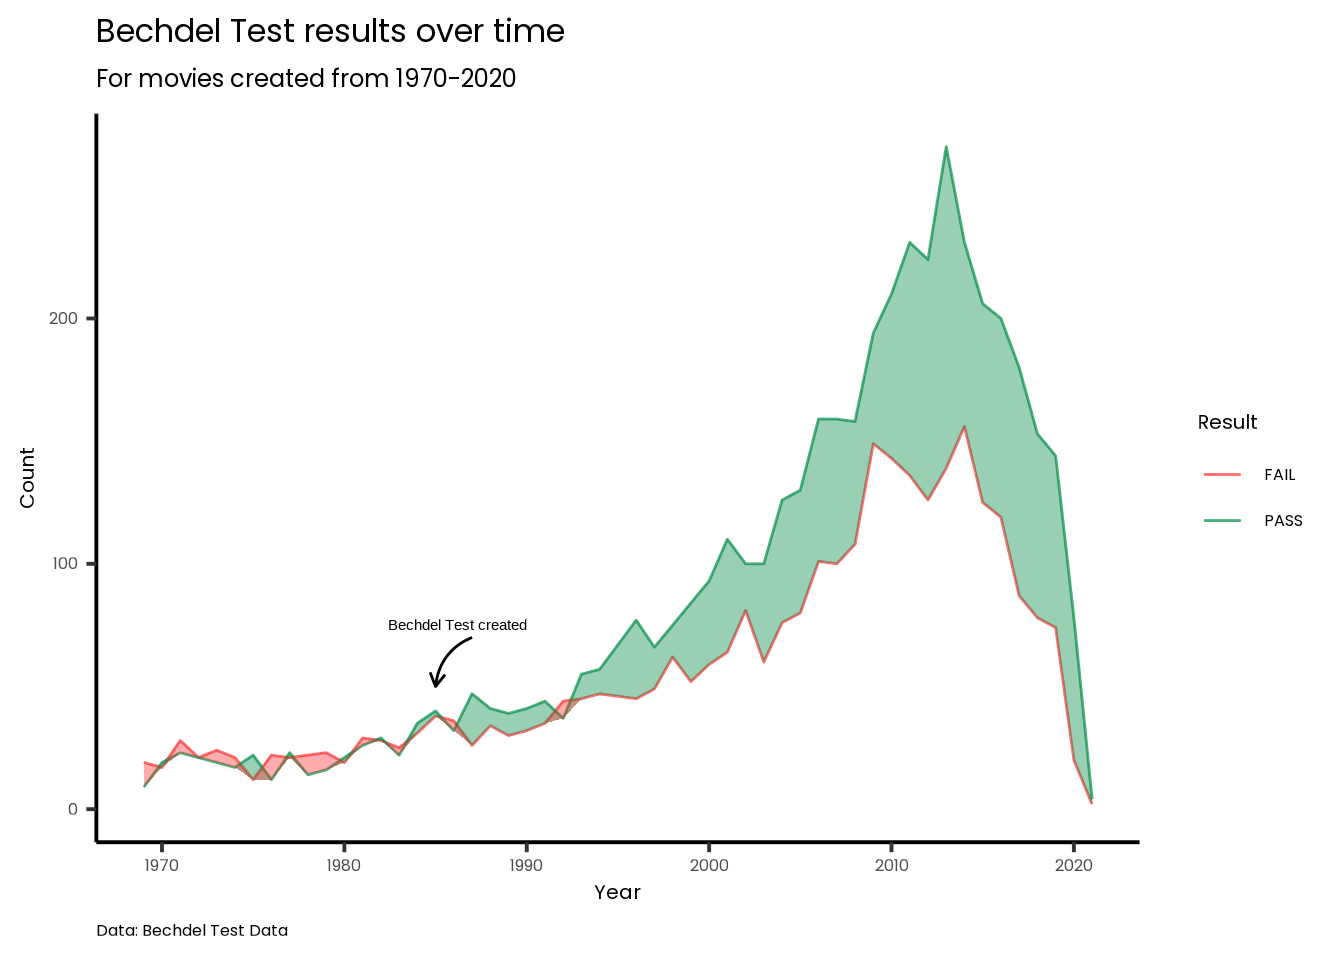
Line/Ribbon Plot: I will first create a lineplot with a ribbonplot overlay to show the gap between the movies that are passing vs failing the test. I am choosing to use a lineplot because it is a temporal chart, so it involves one ordinal and one discrete variable. Additionally, I am interested in determining whether or not the movie industry has improved in terms of casting more serious female roles since the Bechdel Test was created, so I will add an annotation to mark this point on the chart. Using a ribbonplot helps emphasize the relative change in the number of movies passing vs failing the test over time.
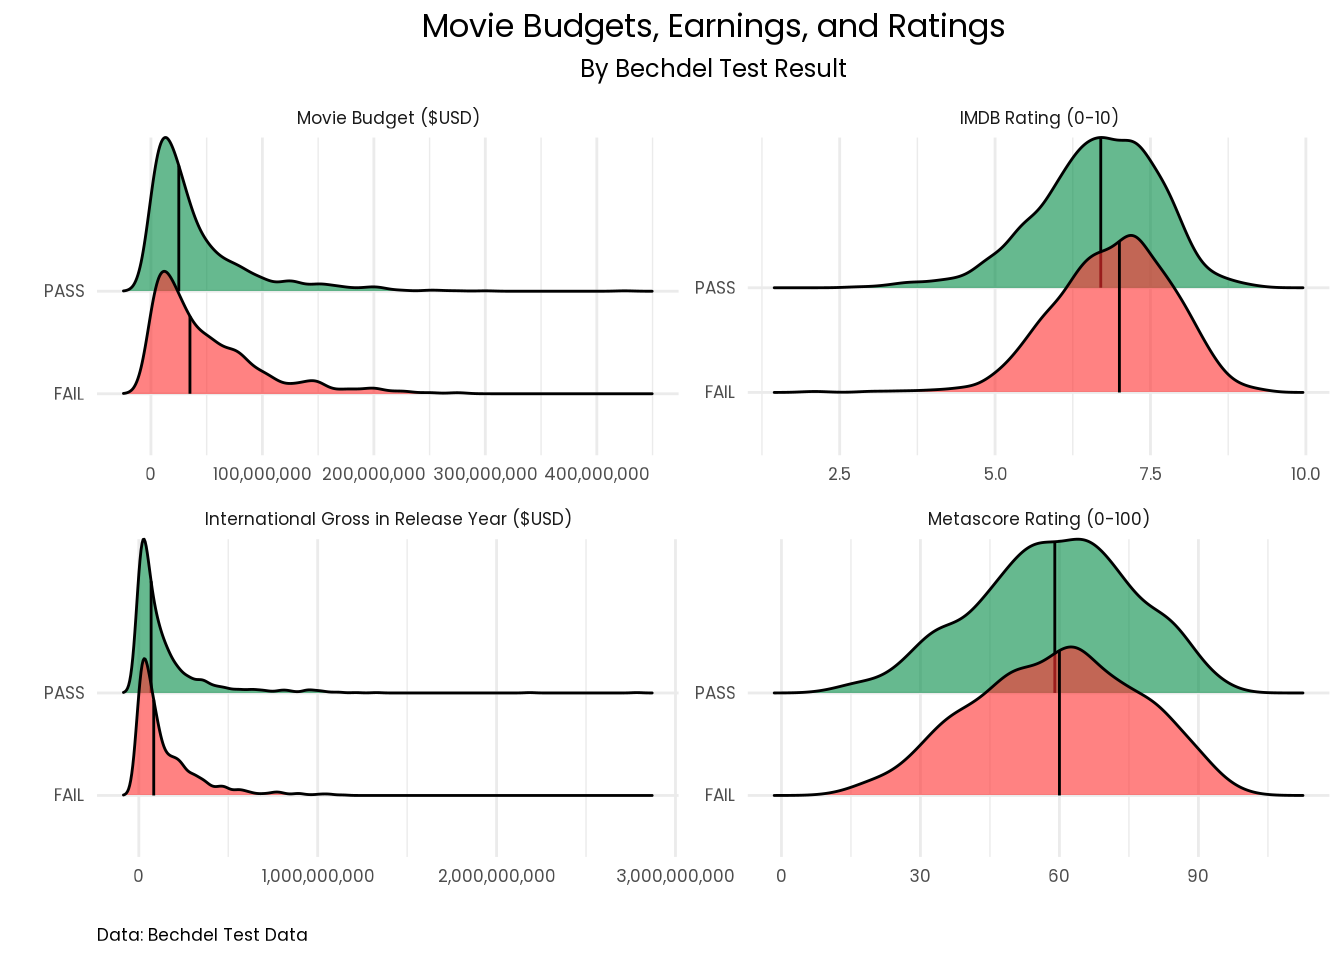
Ridgeline Plot: I will create a faceted ridgeline plot to show how movies that are passing vs failing are being rewarded through budgets, earnings, and audience ratings. This plot helps answer the second part of my question regarding rewards. I will also include a line to mark the median point for each distribution so that it is easy for the user to compare the two groups in each facet. A ridgeline plot is useful for showing a smoother distribution of an attribute for a given group. In this case, because I am looking to detect small differences between the two groups, it is helpful to look at a full distribution rather than just an average.
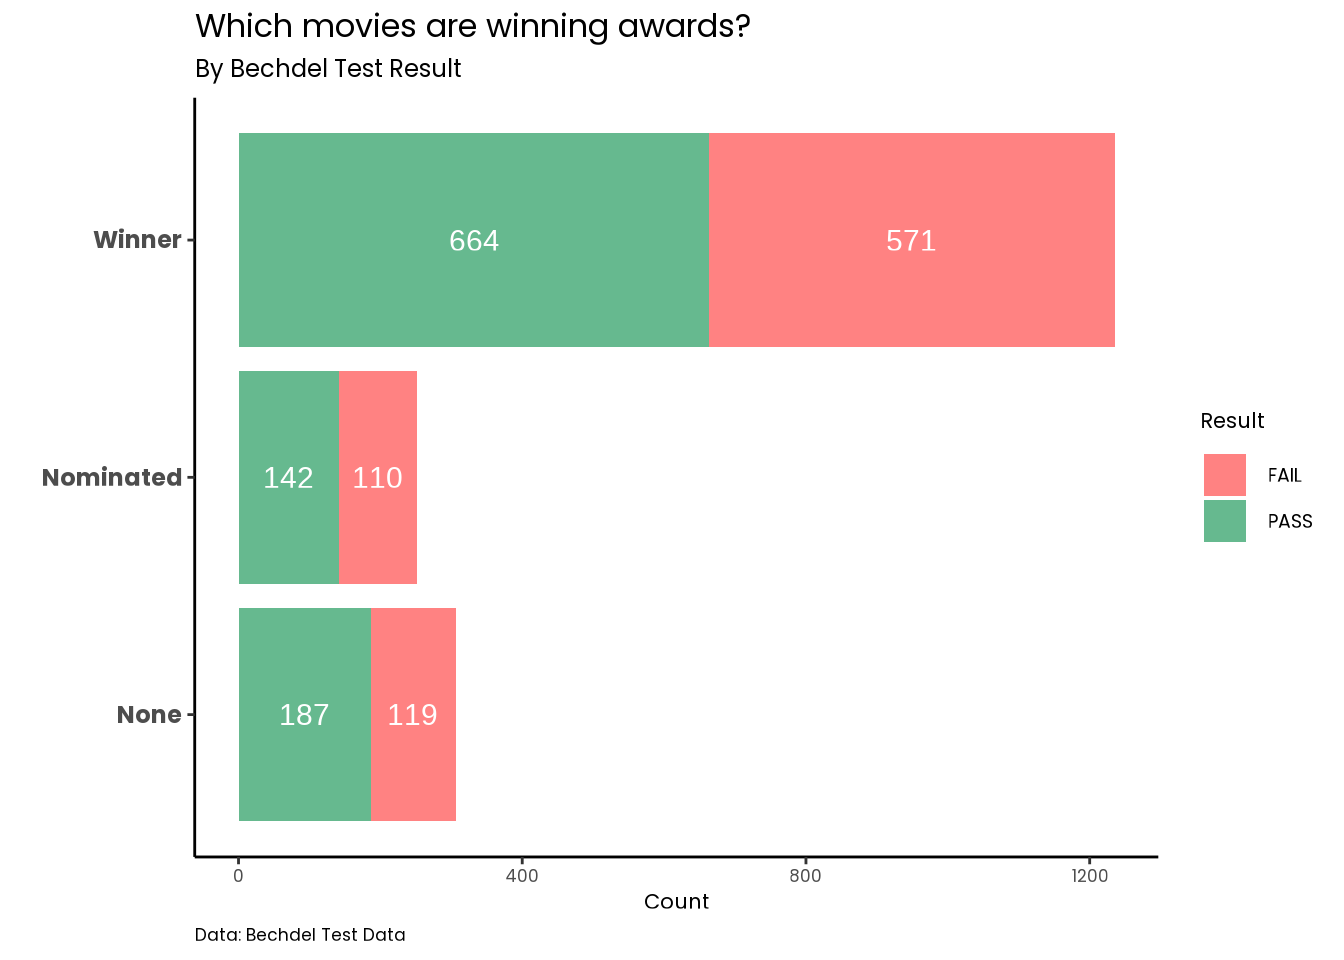
Barchart: I will create a supplementary chart to show how movies have performed during awards season. I think that this is another way to answer the second part of my question regarding how we reward (or don’t reward) movies which pass the Bechdel Test. A simple barchart makes for an easy display of frequency counts (discrete data) so that the user can easily compare the number of movies that have passed vs failed in each award category (qualitative data).
Analysis
Discussion
In the first chart, we can see that since 1970, the number of movies passing the bechdel test has surpassed the number of movies failing. This has been consistent since ~1992. This shows that the movie industry has definitely made some progress in terms of female representation. We can also see that overall, the number of movies being made each year increased substantially since 1980, peaking in 2015, with a slight decline in movies between 2015 and 2020. This decline could be due to the prevalence of streaming services as well as the pandemic causing a decline in the number of movies being released. Additionally, this dataset ends in 2020, which could be causing the line to appear as a steep decline.
In the second chart, my hypothesis that we are still rewarding movies that fail the Bechdel Test proves to be true. In each category, we can see that the median for failed movies is higher than the median for the passed movies. This shows that although the movie industry has made some progress, there has not been a substantial change in terms of economics of the production side or the audience side. These differences, however, are not huge, so I do hope that the movie industry continues to move in the right direction.
In the third supplementary chart, we do see that in this dataset, more passing movies are getting nominated and winning awards during awards season. This chart does show that this particular dataset includes a large number of movies which have won awards. This is most likely because this dataset is a subset of the most popular movies. Unfortunately, this raw count might not be indicative of a common trend in the industry. One limitation of this analysis is that the dataset is not comprehensive, as the movie.csv dataset contained only 1700 entries. Thus, further research is needed to determine whether the trends I have found exist across a larger dataset.