Gold Dingo Lourenço Belleau, Muhammad Dossani,Chrishana Wickham
2024-02-29
Introduction
The dataset for our project represents a fusion of UFO sighting records sourced from the National UFO Research Center
This integration provides a unique perspective on the environmental conditions prevalent at the time of each UFO sighting.
The dataset comprises three distinct data frames: ‘day_parts_map’, ‘places’, and ‘ufo_sightings’
Dataset Reason: Our selection of this dataset stems from a keen interest in exploring the phenomena of UFOs, offering us a rich foundation for our presentation.
Time of Day by Location and Year
How does the time of day at which UFO sightings change over time and by location?
Trends in time over the years
Strong consistency across time
Evening surge
Nighttime peak between midnight and 5am
Possible explanations: Increased transit during evening hours, reduced visibility during morning hours.
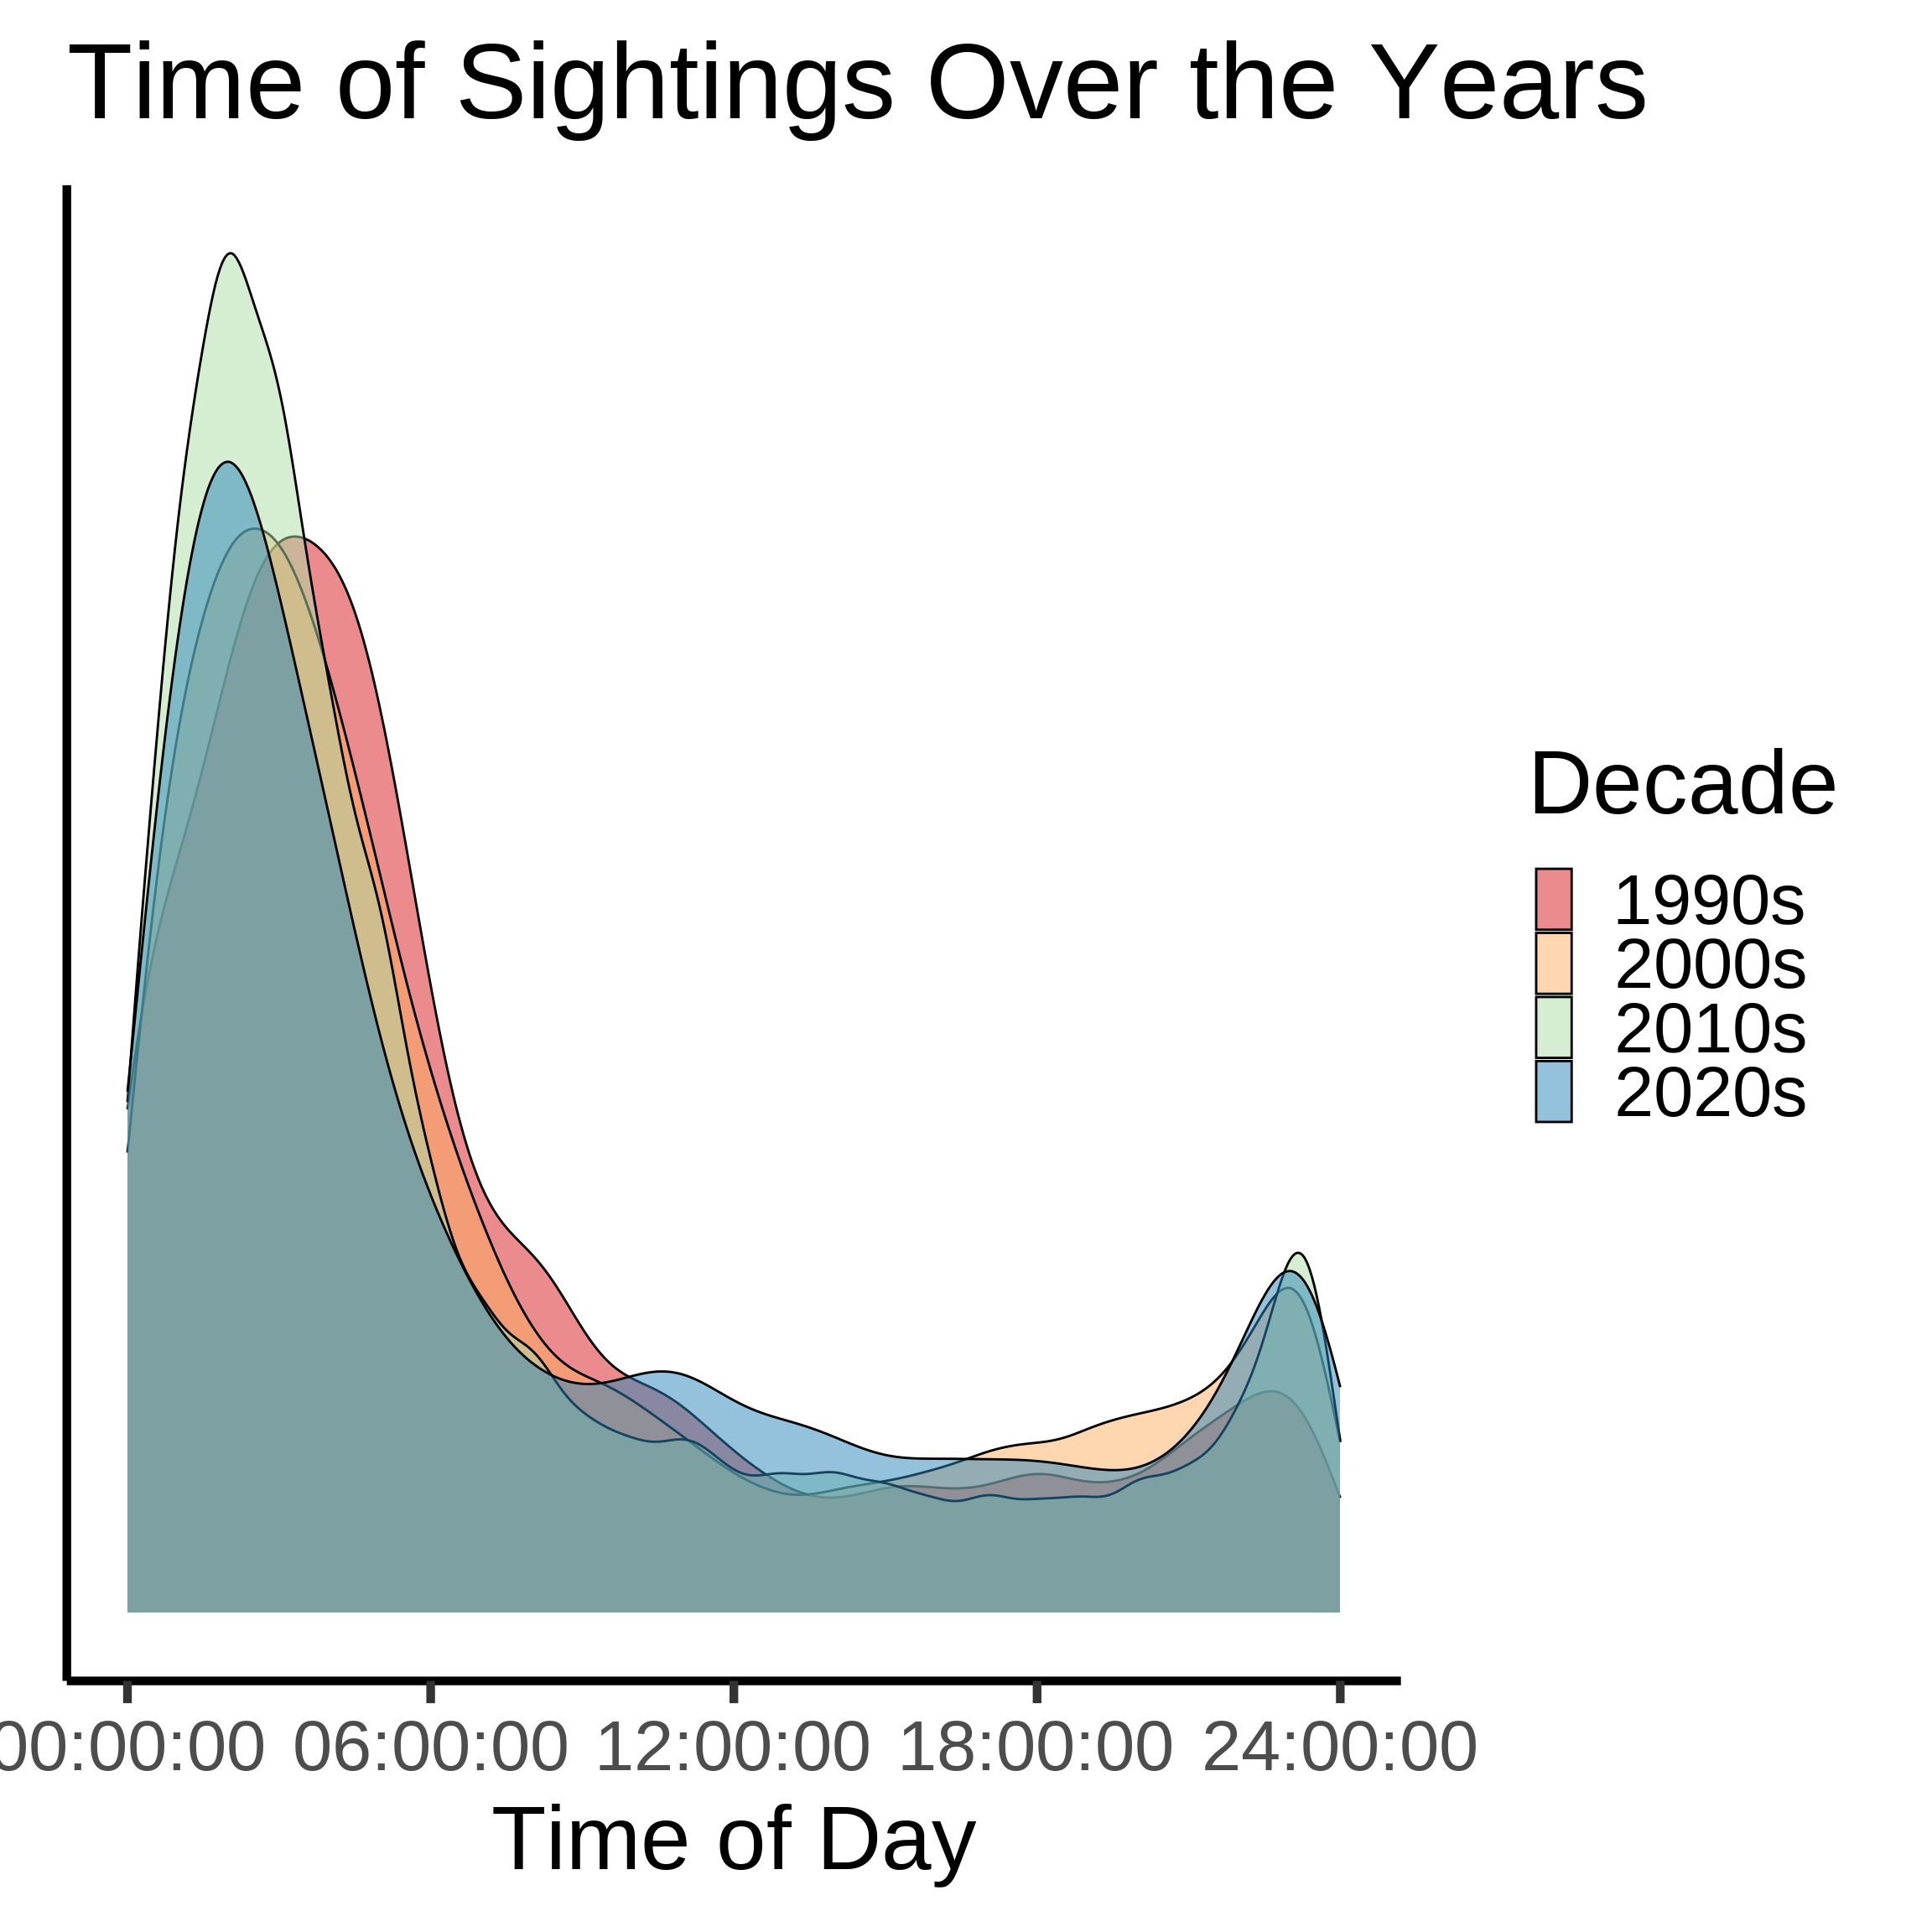
Time of day around the world
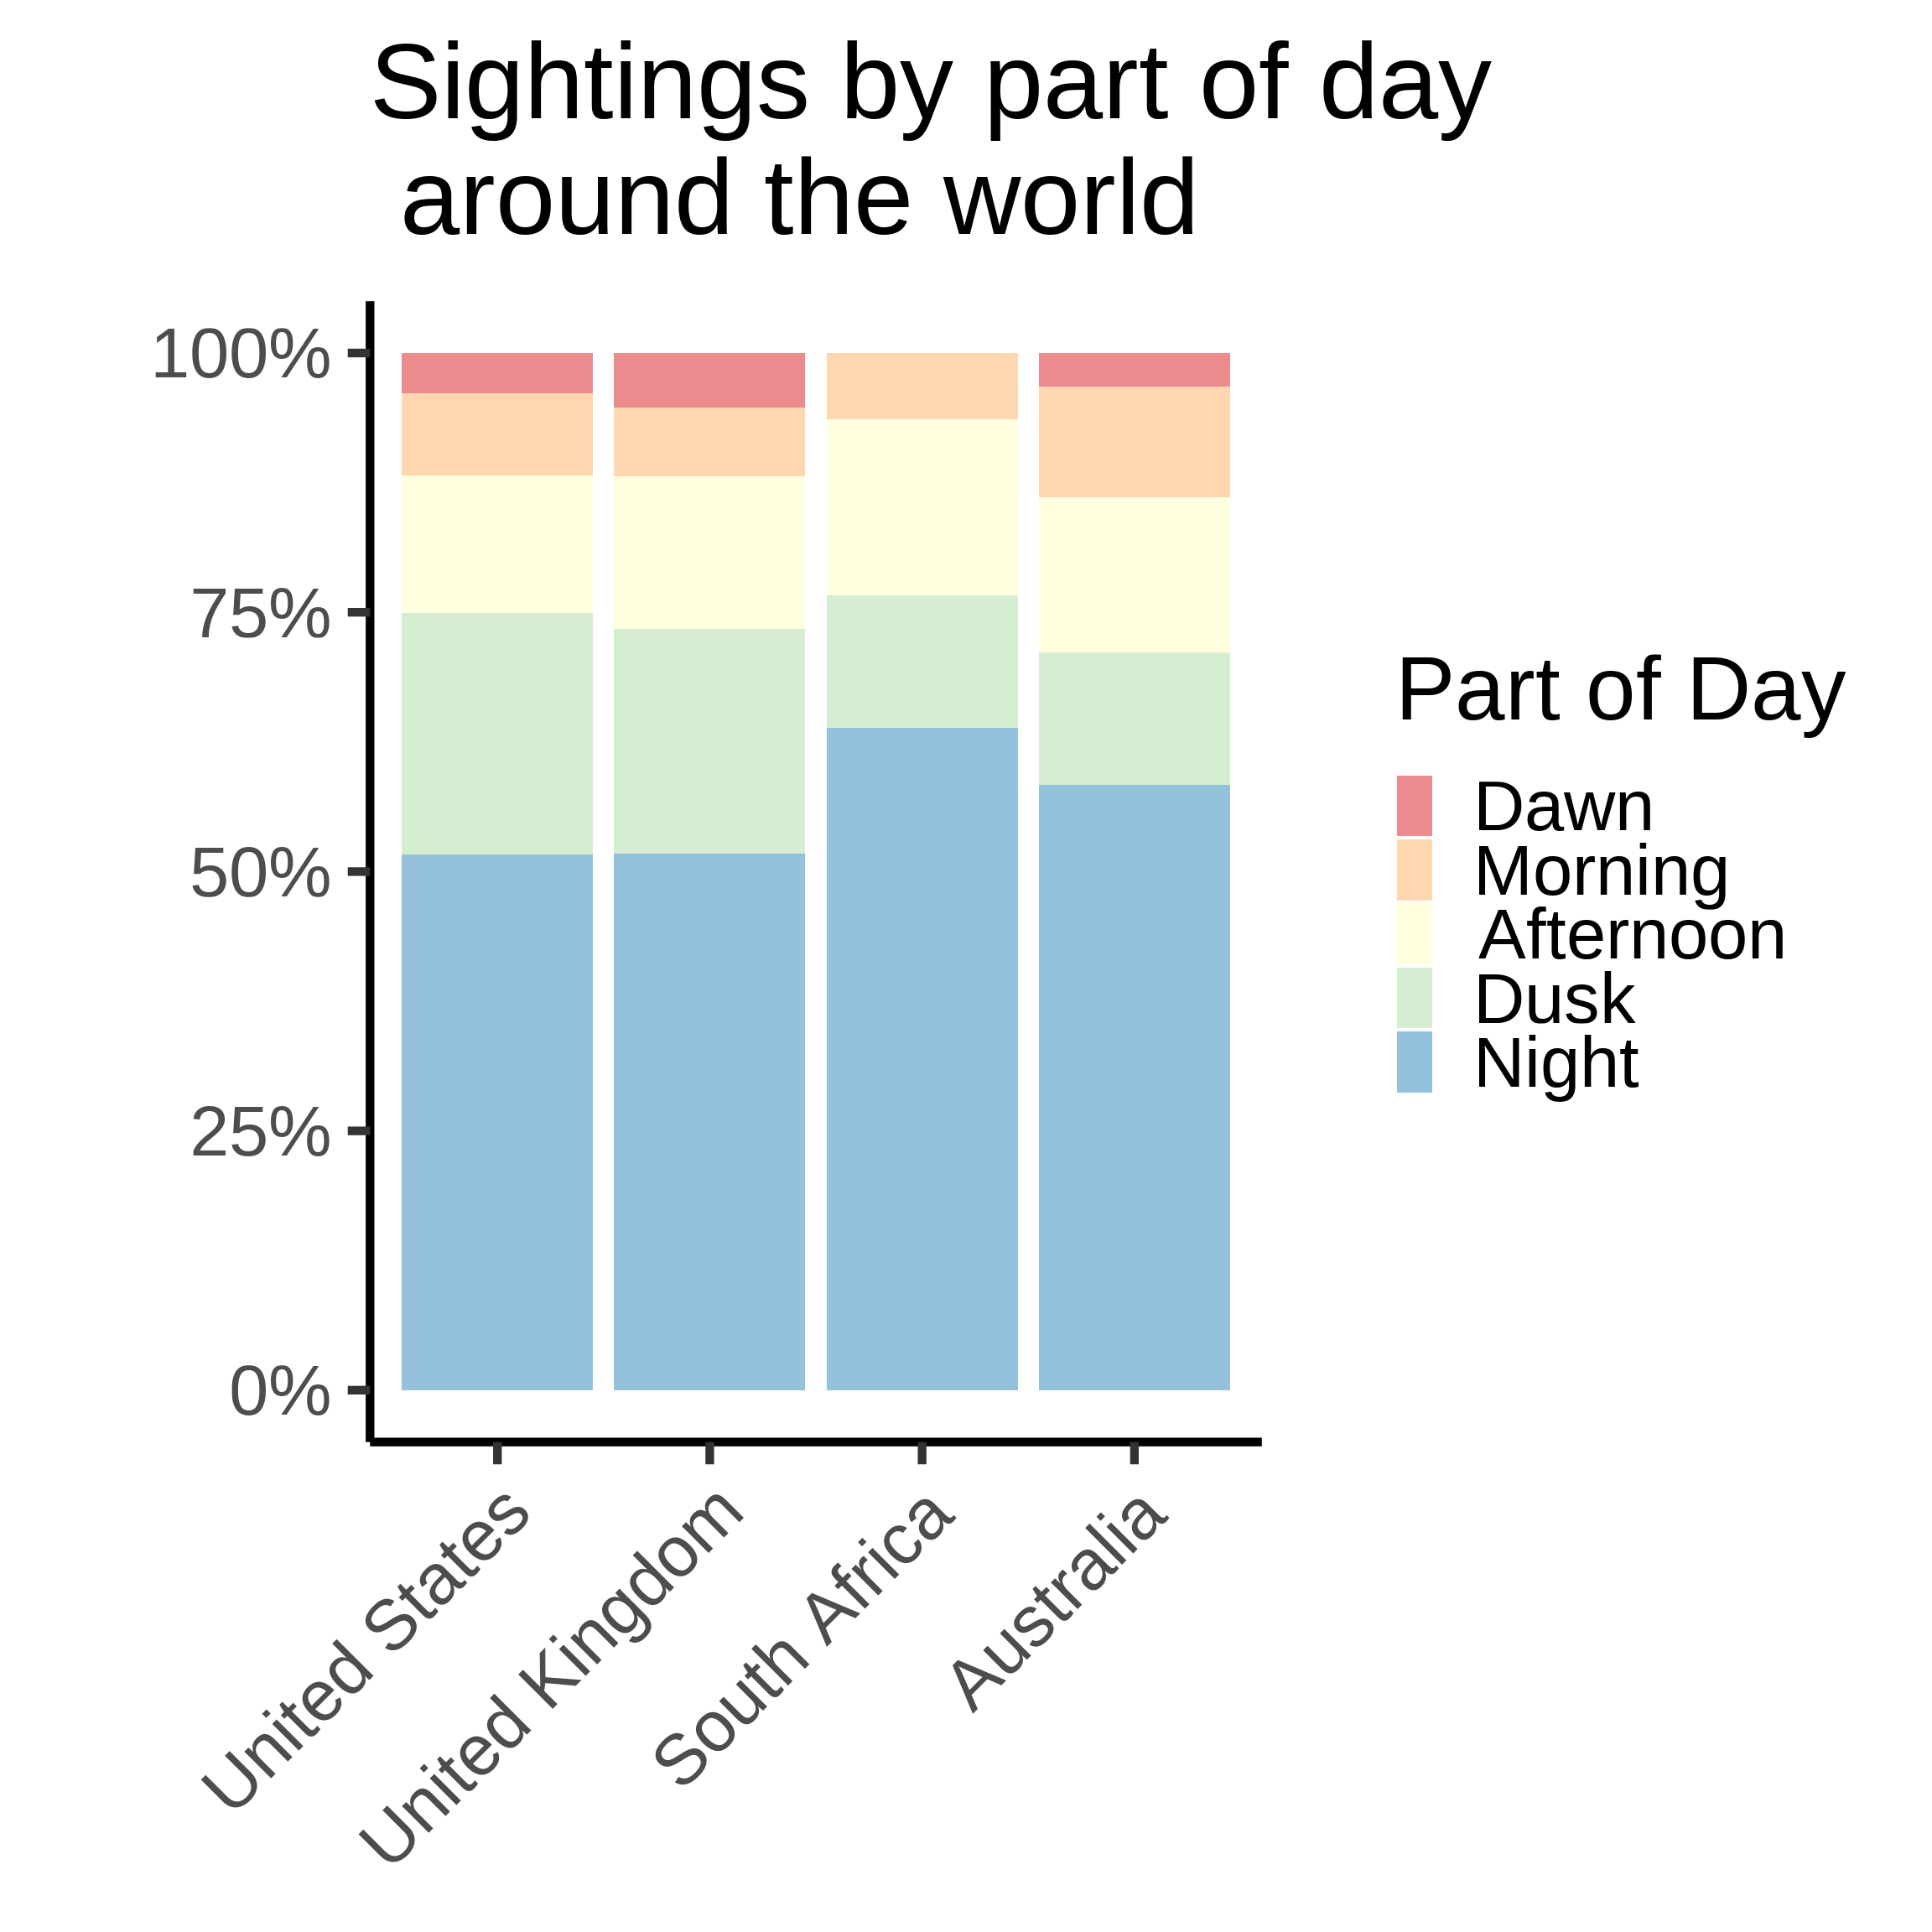
Geographic dispersion
Statistical relevance: at least 300 sightings per country
Strong consistency across chosen countries
UFO Shape vs. Location over Time
How is the shape of a UFO dependent on location? Is there a relationship between the shape of a UFO and where it is sighted?
Top 5 Shapes in Top 5 U.S. Cities
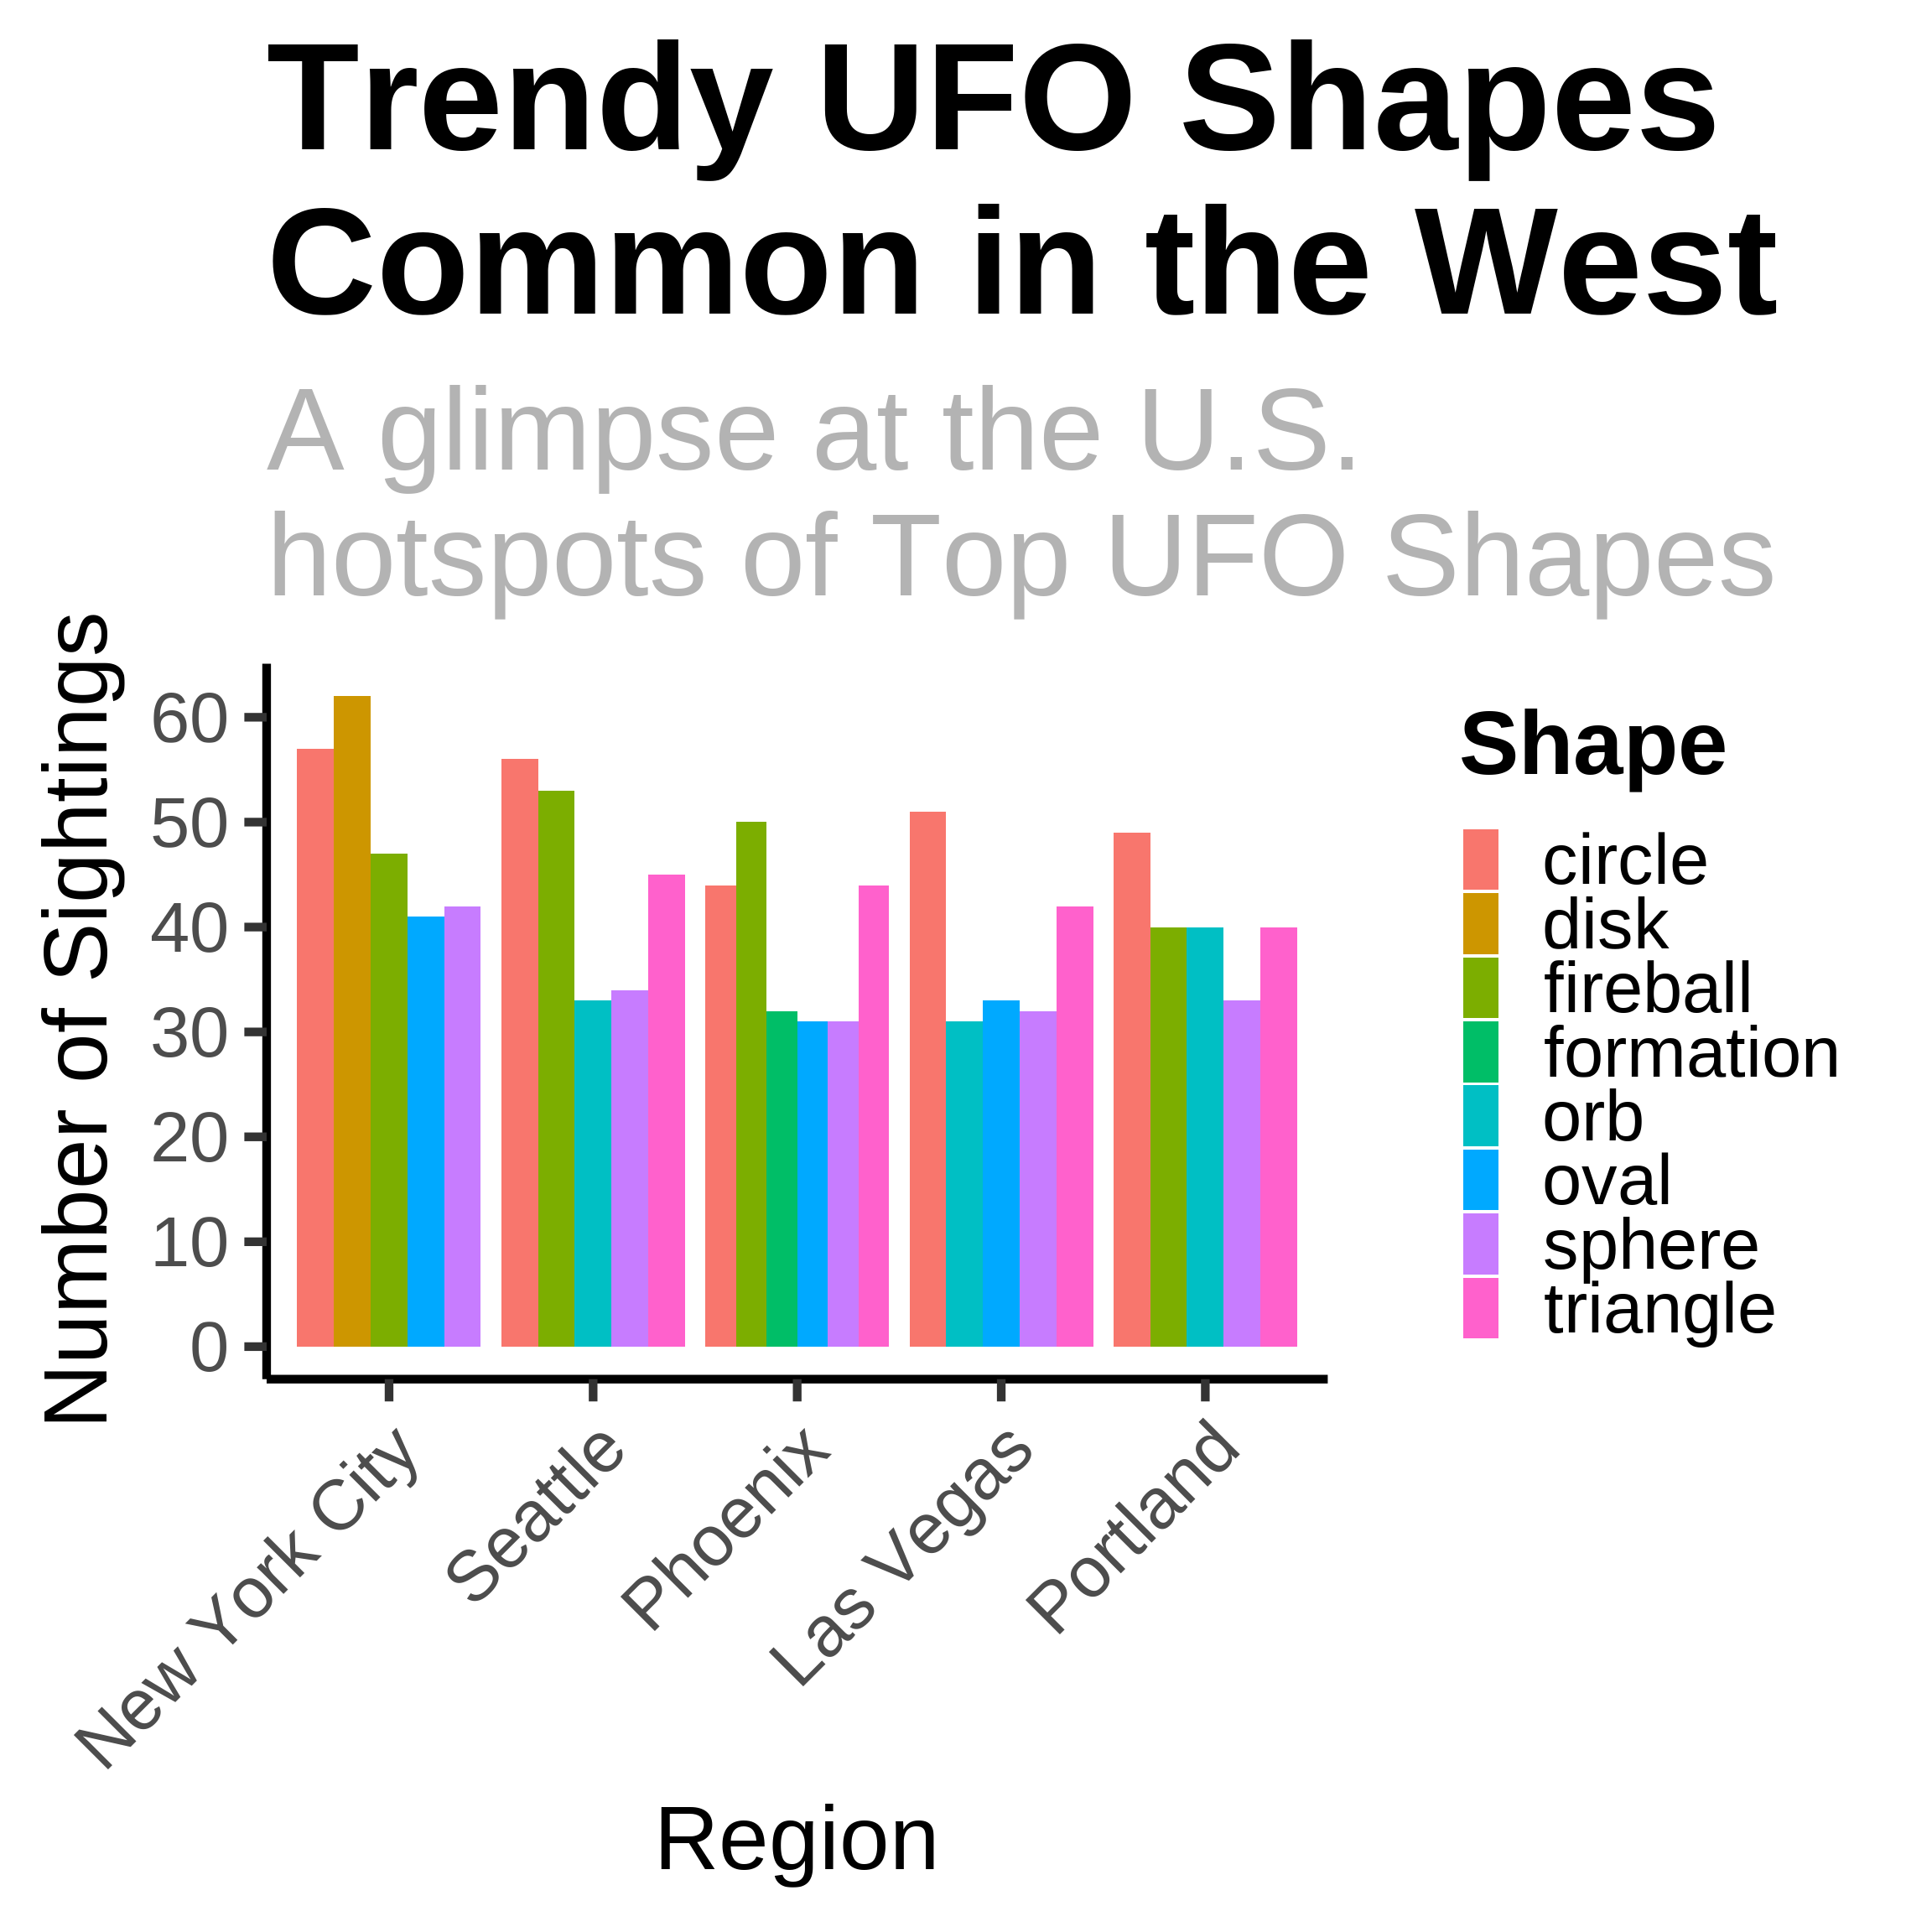
Higher concentration of UFO’s in the Western U.S.
Triangle, Circle, and Fireball are the most common shapes
No shape that exceeds others in terms of sighting numbers.
Possible explanations: Military Bases, natural conditions, UFO lore.
Shape Sightings Over Time
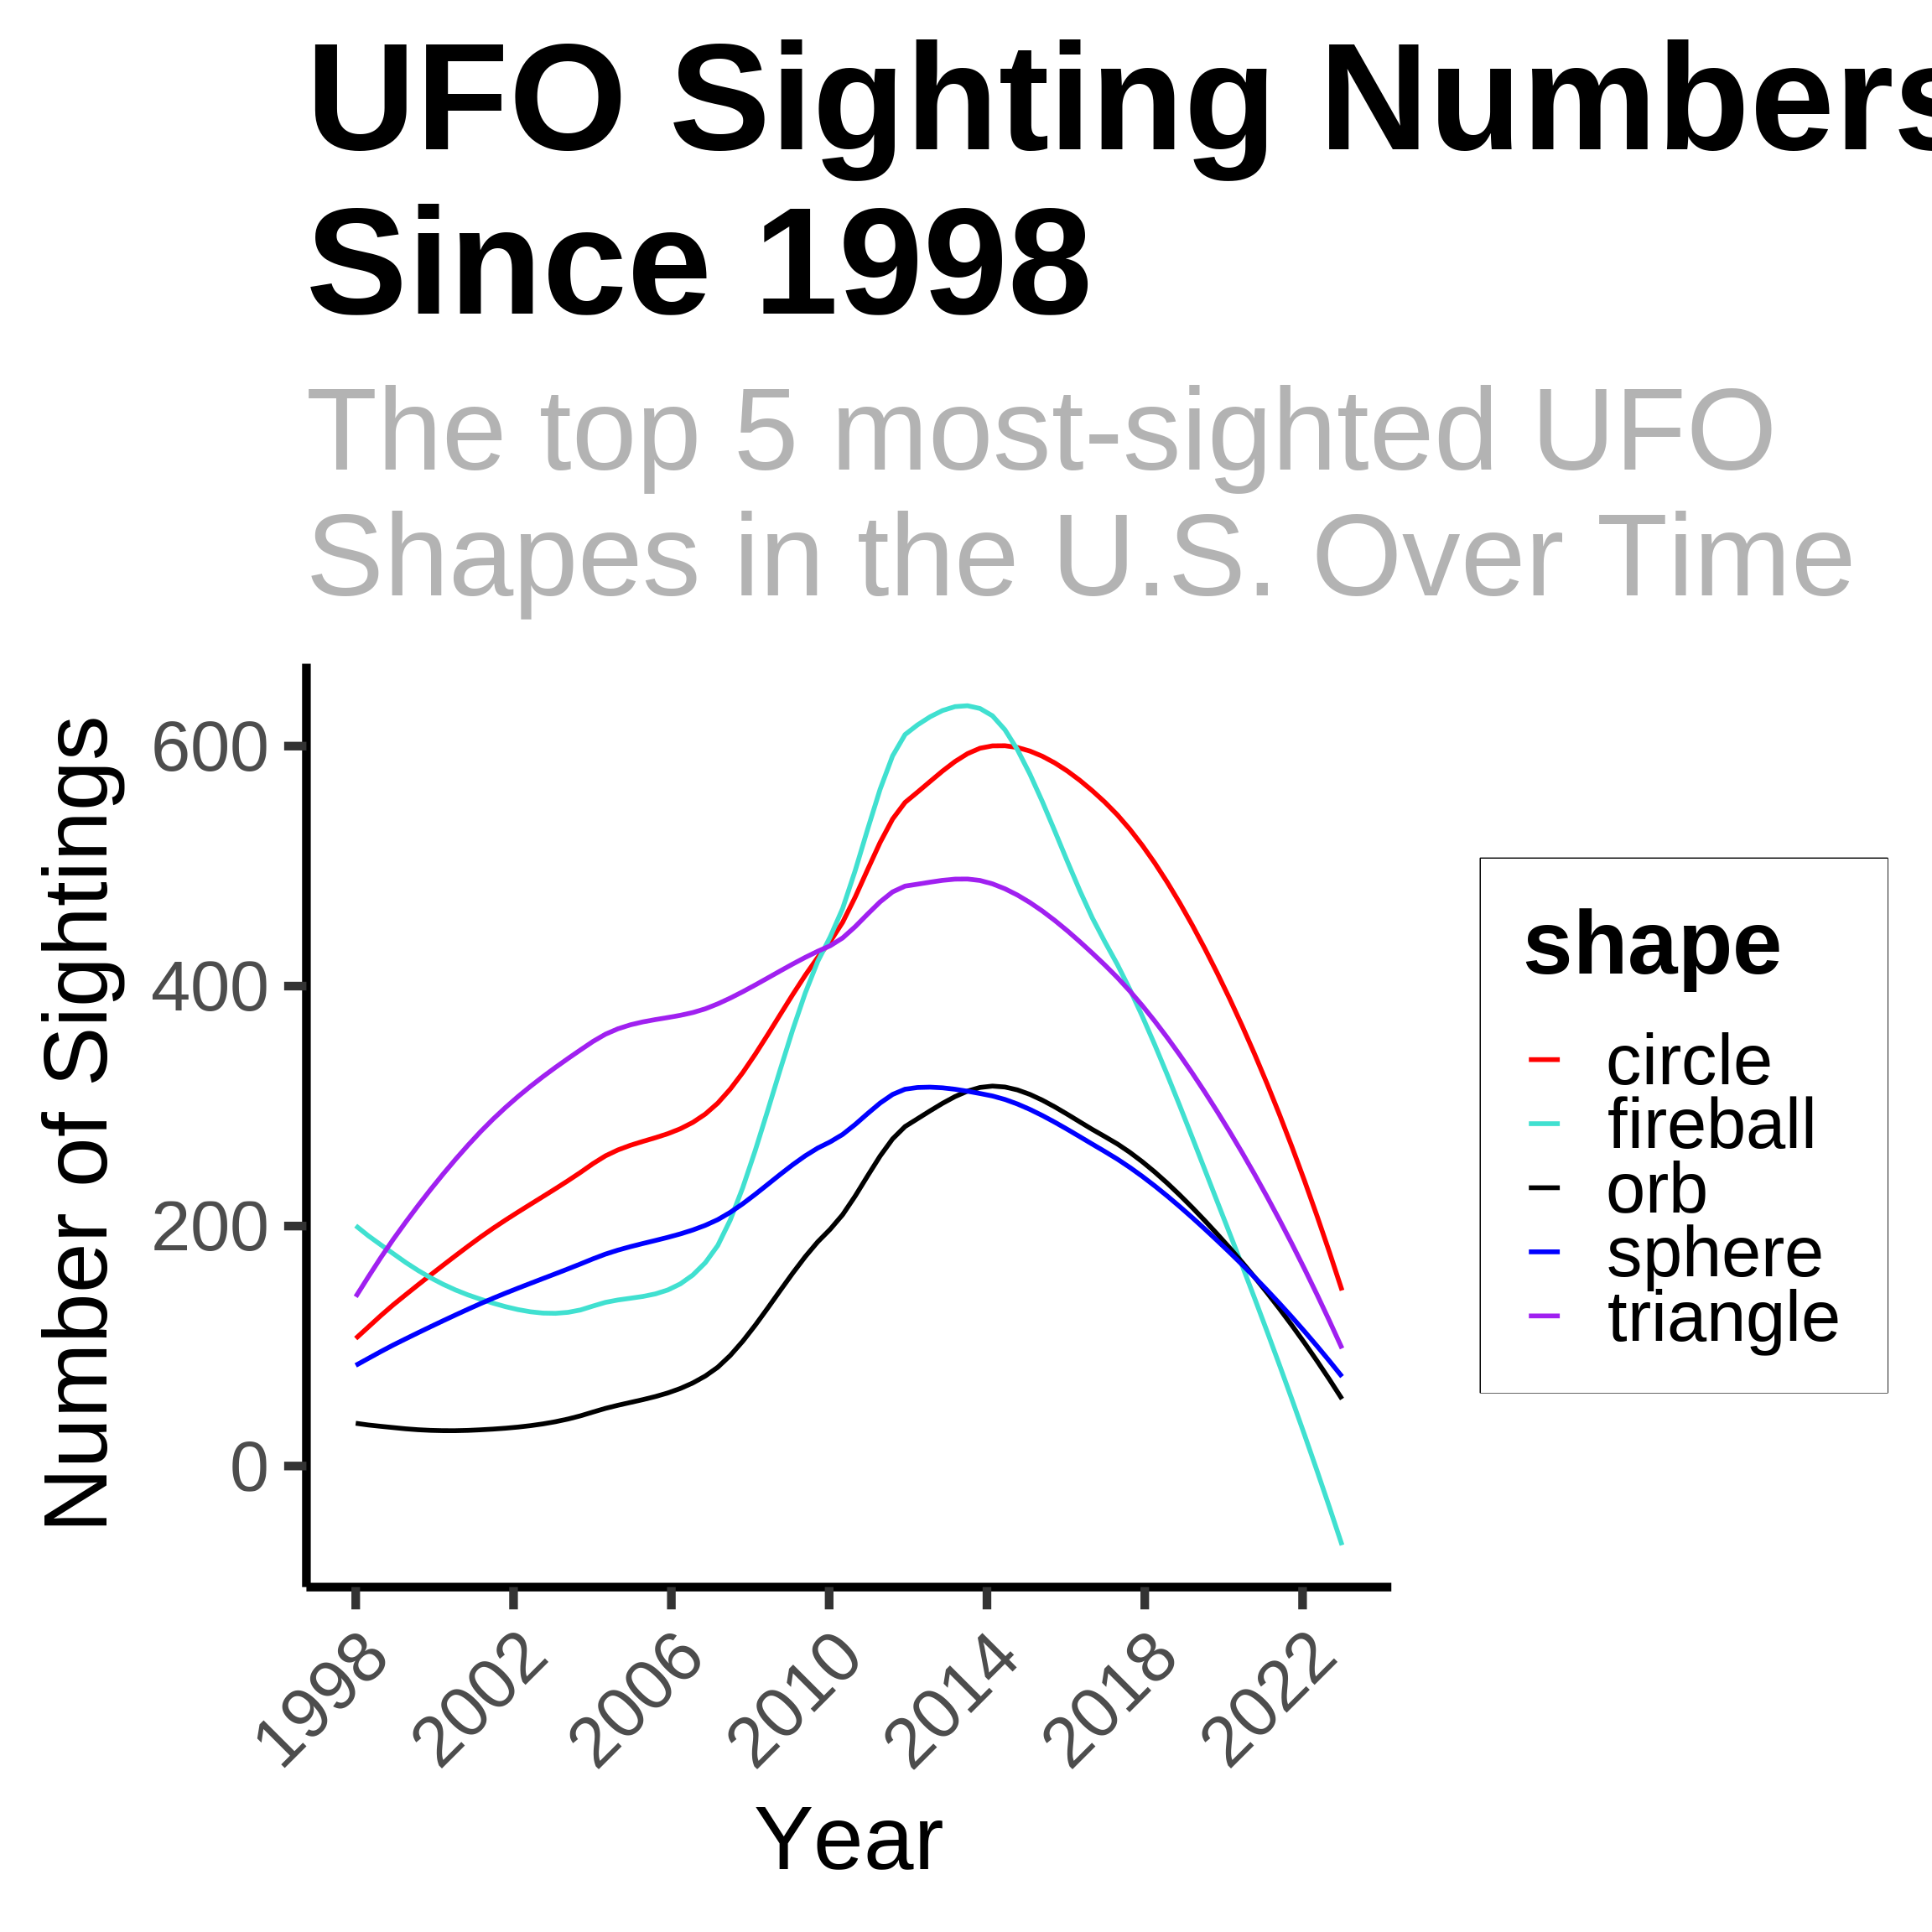
Big surge of UFO sightings in early 2010s.
Large drop in recent years, similar levels from start of study.
All prominently sighted UFO shapes shared similar sightings trends over time.
Possible explanations: Advancement of Technology, Social Media, Drones.