Solidarity Forever? The Success and Prevalance of Labor Unions in the US

Author

Red Cassowary - Ming DeMers, Tasnimul Taher, Isabel Dawson, and Anthony Ma

Introduction

“Unions, the workers who brought you the 40-hour work week.” So goes the famous saying about the success and virtue of labor unions. Formed out of necessity due to the deadly working conditions of the Industrial Revolution, unions gave workers power through collective bargaining. Ideally, unions reduce exploitation, improve working conditions, and increased wages. They fought for the 40-hour work week, minimum wage, and ended child labor. However, to accomplish these feats, many unions had to resort to drastic measures: picketing, striking, and even violence. The history of unions is long and complicated, so how has the fight been successful? Do workers in unions fare better than those who aren’t? In what sectors are unions most appropriate and successful? And most importantly, do unions still have a place in the modern American workplace?

Dataset

The data1 we used in this project comprises three separate data sets:

  • union_demos2: demographic information including number of union workers, percent of union workers, and number of workers covered by the union (may be more than membership) by year and industry sector. Data spans 1973-2023.

  • union_wages3: includes the mean hourly wage of union and non-union members, the percent of high-earning workers, and more. Rows are specified by year and sector. Data spans 1973-2023.

  • union_states4: data including employment numbers, union membership numbers, and the number of workers covered by collective bargaining entities. Rows are separated by year, state, and sector. Data spans 1983-2023.

    It should be noted that for all three data sets, the definition of union membership was expanded in 1977 to include “employee associations similar to a union”.

Here is a glimpse at all three data sets:

glimpse(union_demos) 
Rows: 1,355
Columns: 8
$ year        <dbl> 1973, 1974, 1975, 1976, 1977, 1978, 1979, 1980, 1981, 1983…
$ sample_size <dbl> 49095, 48245, 46488, 47648, 57191, 57321, 58080, 68594, 15…
$ employment  <dbl> 75519.29, 77101.10, 75703.92, 78776.94, 81334.13, 84966.08…
$ members     <dbl> 18088.57, 18176.48, 16778.28, 17402.98, 19335.10, 19548.35…
$ covered     <dbl> NA, NA, NA, NA, 21534.60, 21897.54, 23540.08, 22493.37, 21…
$ p_members   <dbl> 0.2395225, 0.2357486, 0.2216303, 0.2209147, 0.2377243, 0.2…
$ p_covered   <dbl> NA, NA, NA, NA, 0.2647671, 0.2577209, 0.2702135, 0.2571273…
$ facet       <chr> "all wage and salary workers", "all wage and salary worker…
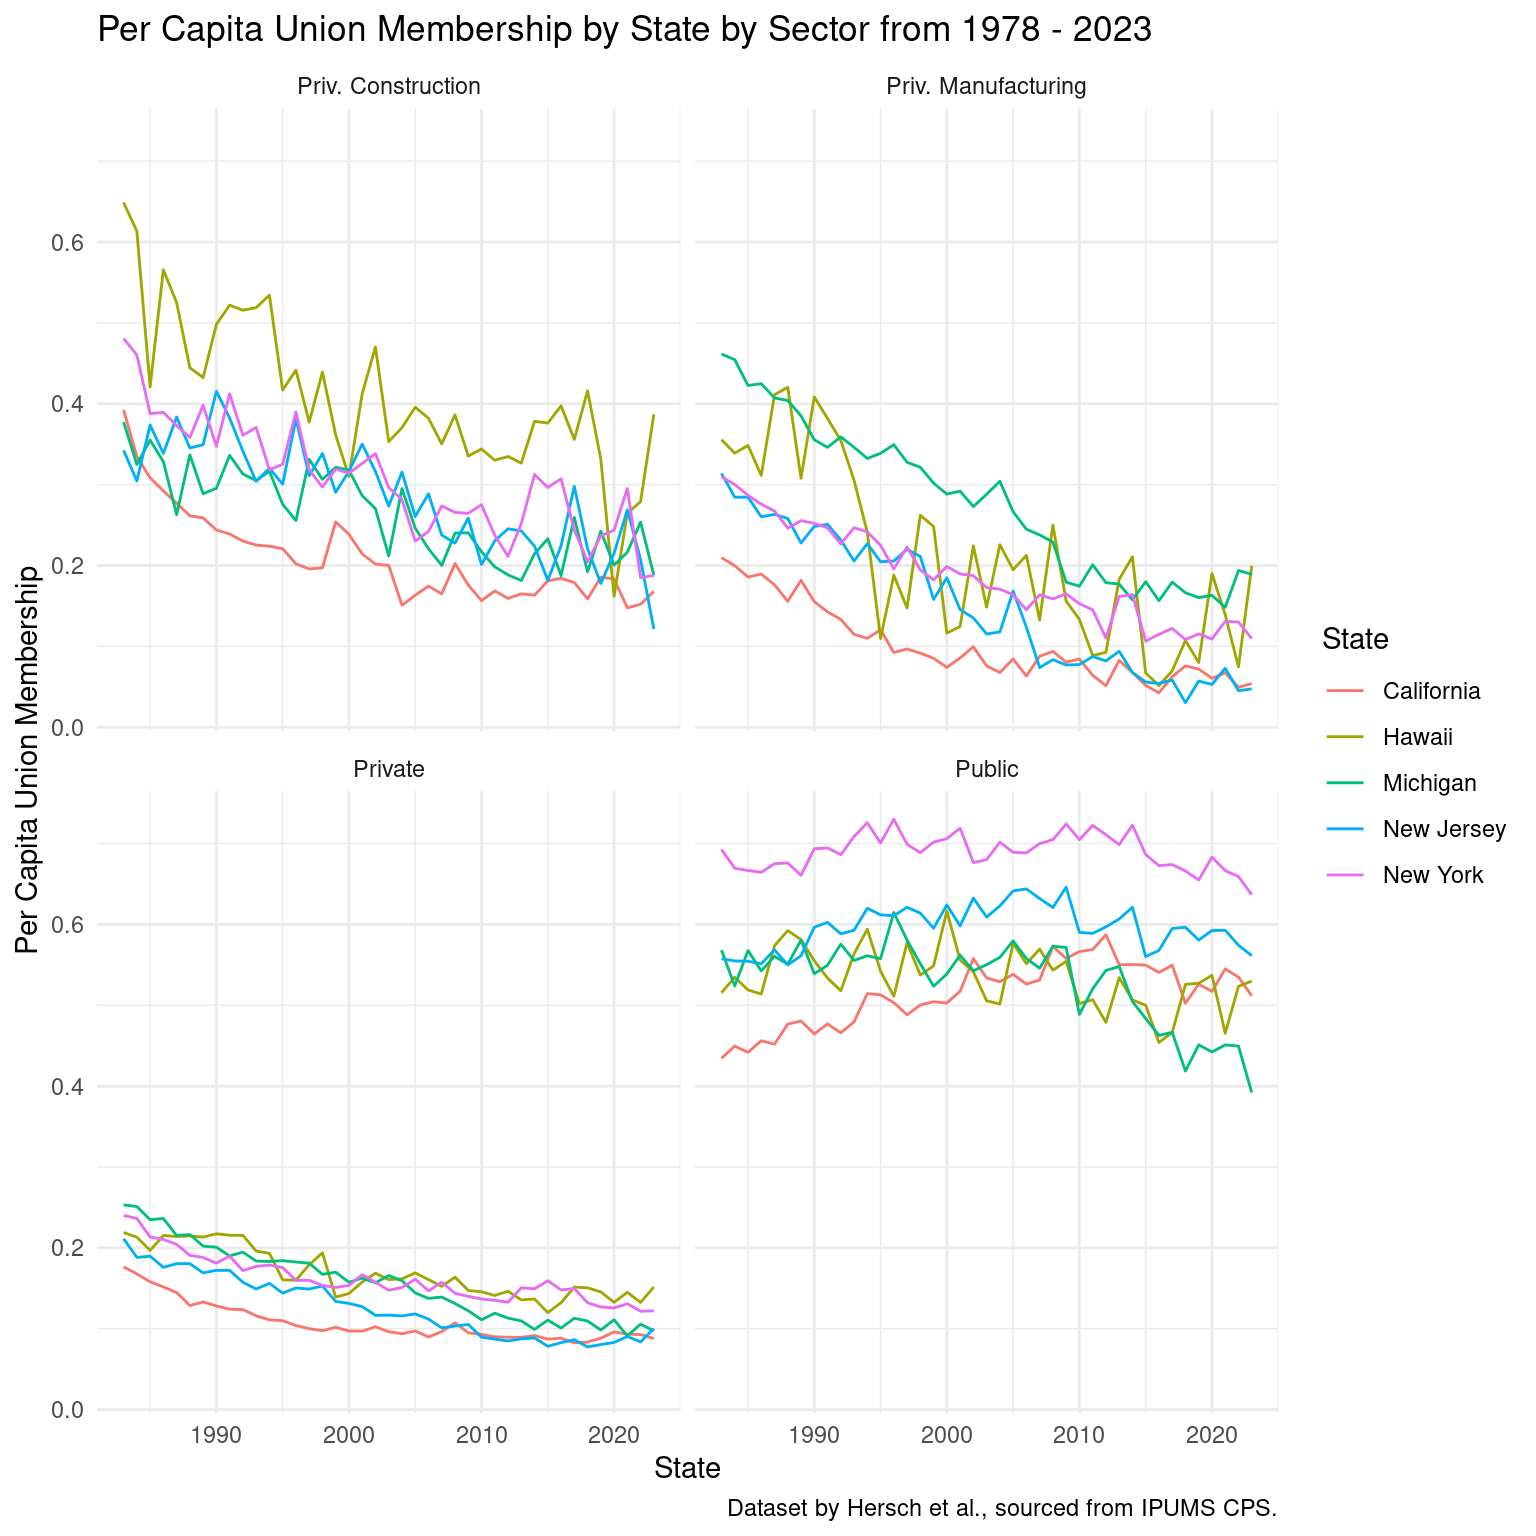
glimpse(union_states) 
Rows: 10,455
Columns: 11
$ state_census_code  <dbl> 11, 11, 11, 11, 11, 11, 11, 11, 11, 11, 11, 11, 11,…
$ state              <chr> "Maine", "Maine", "Maine", "Maine", "Maine", "Maine…
$ sector             <chr> "Priv. Construction", "Priv. Construction", "Priv. …
$ observations       <dbl> 85, 93, 95, 89, 114, 117, 119, 109, 78, 62, 59, 55,…
$ employment         <dbl> 16917.99, 20170.49, 23411.73, 22873.16, 28033.17, 3…
$ members            <dbl> 2207.3308, 2207.7742, 2490.9525, 1917.4617, 3377.06…
$ covered            <dbl> 2420.3100, 2207.7742, 2787.8625, 1917.4617, 3377.06…
$ p_members          <dbl> 0.13047244, 0.10945567, 0.10639764, 0.08383022, 0.1…
$ p_covered          <dbl> 0.14306135, 0.10945567, 0.11907975, 0.08383022, 0.1…
$ state_abbreviation <chr> "ME", "ME", "ME", "ME", "ME", "ME", "ME", "ME", "ME…
$ year               <dbl> 1983, 1984, 1985, 1986, 1987, 1988, 1989, 1990, 199…
glimpse(union_wages)
Rows: 1,273
Columns: 9
$ year                        <dbl> 1973, 1974, 1975, 1976, 1977, 1978, 1979, …
$ sample_size                 <dbl> 39774, 37966, 37812, 37888, 46591, 44577, …
$ wage                        <dbl> 3.963343, 4.258988, 4.622152, 4.914102, 5.…
$ at_cap                      <dbl> 0.001110298, 0.001568906, 0.002267337, 0.0…
$ union_wage                  <dbl> 4.613008, 5.021364, 5.428930, 5.835837, 6.…
$ nonunion_wage               <dbl> 3.754528, 4.019072, 4.386672, 4.646127, 4.…
$ union_wage_premium_raw      <dbl> 0.2286519, 0.2493840, 0.2375963, 0.2560648…
$ union_wage_premium_adjusted <dbl> 0.1717432, 0.1761086, 0.1858174, 0.1967221…
$ facet                       <chr> "all wage and salary workers", "all wage a…

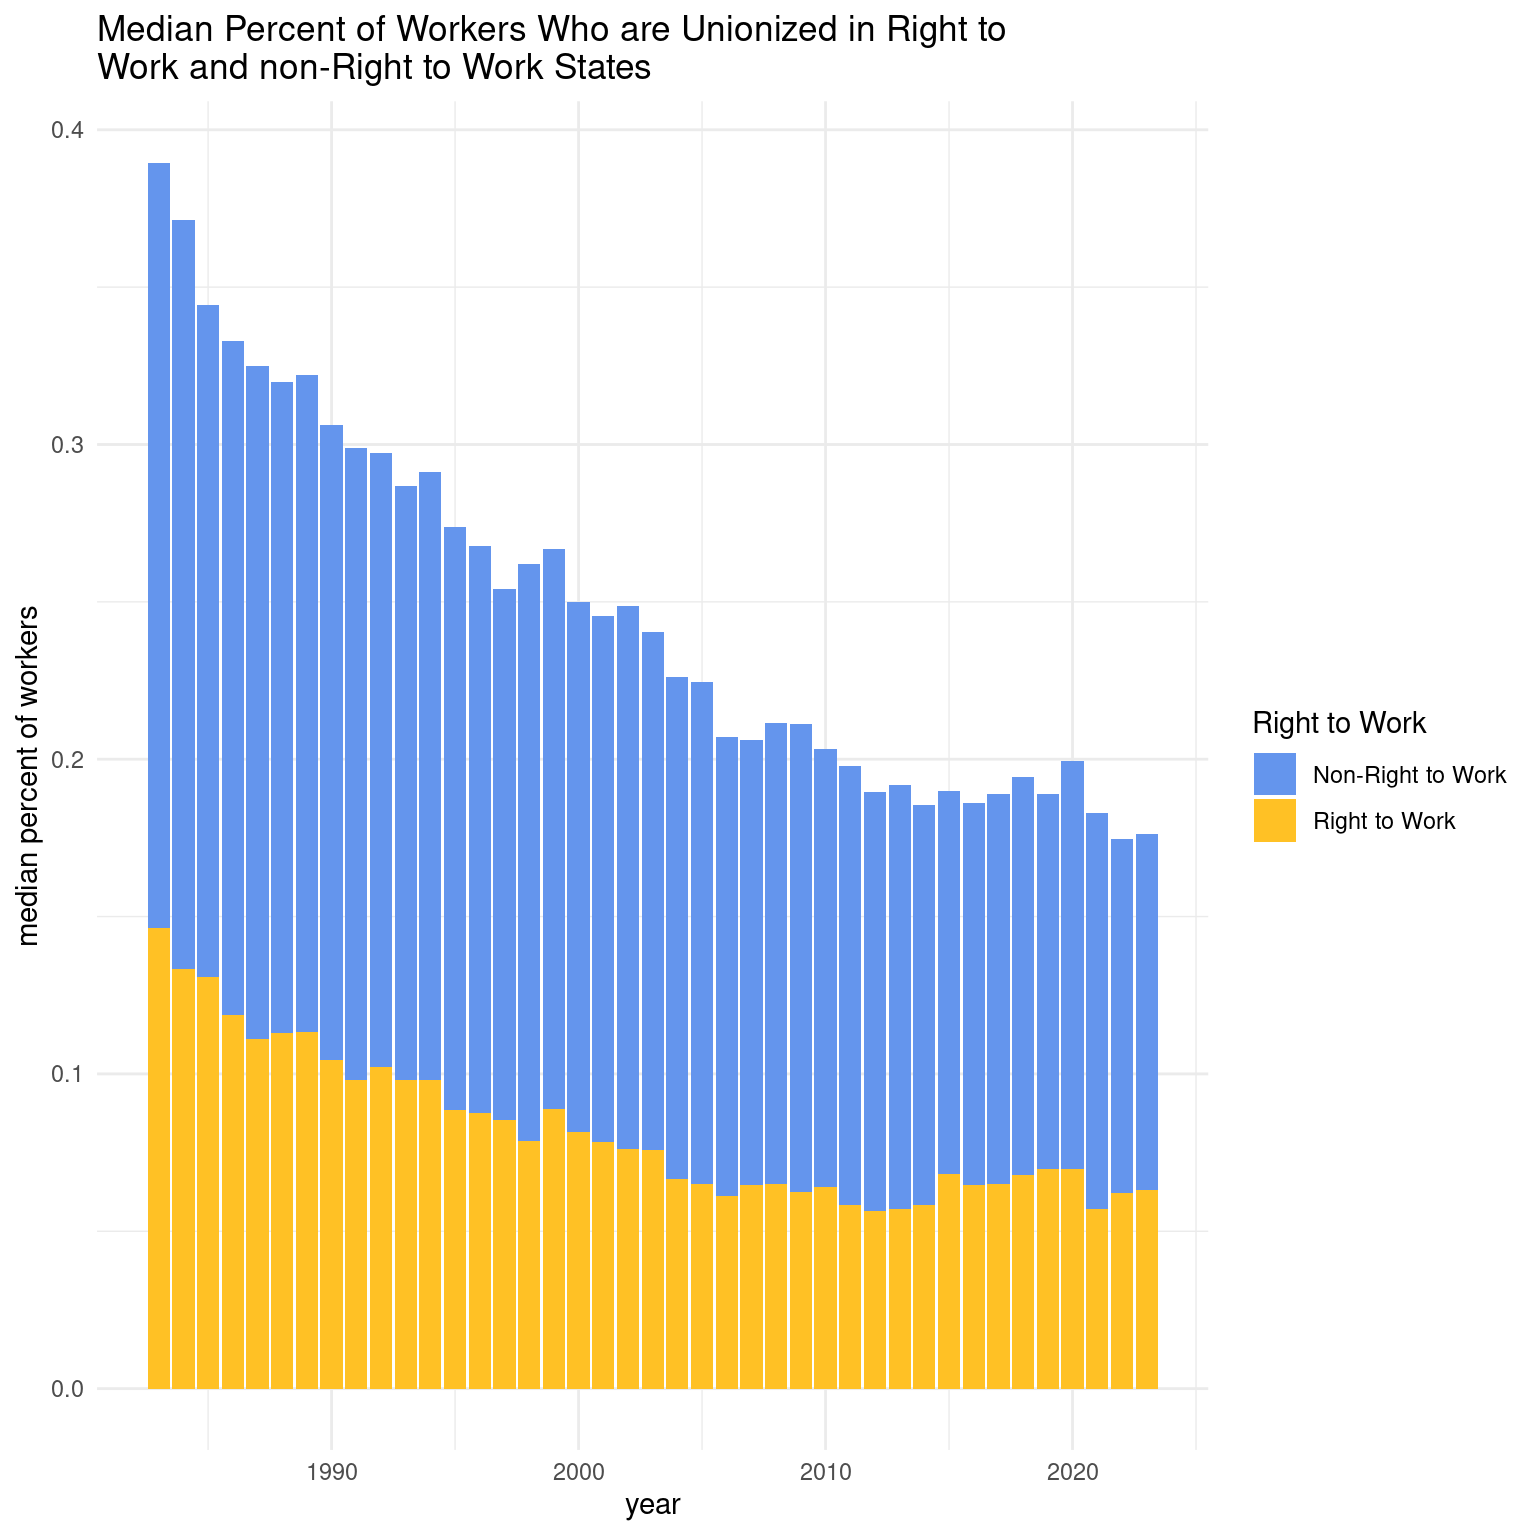
We will also join two additional data sets: one showing inflation over time so we can adjust the wages and dues, and one listing when Right to Work laws went into effect in each state (if at all).

Question 1: How has union membership expanded or contracted over time, and in what states and sectors are these changes most dramatic?

Introduction

At the core of a labor union are numbers: the more members of a union, the louder the voice and stronger the negotiating power. So how was union membership changed since the 1980s? Are unions as prevalent as they used to be? What is their place in the American workplace, and which sectors? We use the demographics data to do this to see state, sector, and membership. Depending on the trend of membership, the result will paint a picture of unions as a growing trend, a stable institution, or declining monument.

Approach

We will first show a geographic heatmap of membership in the US in 1983 and 2023, to best show which states have the highest union memberships, and how membership has changed in the past 50 years. Then, we will generate a line graph of membership of the top 5 states by membership and sector to see a more granular perspective of union membership.

Analysis

states <- read_csv("data/states.csv")
Rows: 10455 Columns: 11
── Column specification ────────────────────────────────────────────────────────
Delimiter: ","
chr (3): state, sector, state_abbreviation
dbl (8): state_census_code, observations, employment, members, covered, p_me...

ℹ Use `spec()` to retrieve the full column specification for this data.
ℹ Specify the column types or set `show_col_types = FALSE` to quiet this message.
wages <- read_csv("data/wages.csv")
Rows: 1273 Columns: 9
── Column specification ────────────────────────────────────────────────────────
Delimiter: ","
chr (1): facet
dbl (8): year, sample_size, wage, at_cap, union_wage, nonunion_wage, union_w...

ℹ Use `spec()` to retrieve the full column specification for this data.
ℹ Specify the column types or set `show_col_types = FALSE` to quiet this message.
demographics <- read_csv("data/demographics.csv")
Rows: 1355 Columns: 8
── Column specification ────────────────────────────────────────────────────────
Delimiter: ","
chr (1): facet
dbl (7): year, sample_size, employment, members, covered, p_members, p_covered

ℹ Use `spec()` to retrieve the full column specification for this data.
ℹ Specify the column types or set `show_col_types = FALSE` to quiet this message.
map <- map_data("state")

states |>
  filter(year %in% c(1983, 2023), 
         sector == "Total", 
         state != "District of Columbia") |>
  mutate(state = tolower(state)) |>
  ggplot(mapping = aes(fill = p_members)) +
  geom_map(aes(map_id = state), map = map, show.legend = T) + 
  expand_limits(x = map$long, y = map$lat) +
  theme_void() +
  theme(legend.position = 'right', 
        legend.direction = "vertical") +
  facet_wrap(~ year, nrow = 2) +
  scale_fill_viridis_c(option = "viridis", direction = -1) +
  labs(
    title = "Per Capita Union Membership by State in 1983 and 2023",
    caption = "Dataset by Hersch et al., sourced from IPUMS CPS.",
    x = "",
    y = "",
    fill = "Union Membership"
  )

states_of_interest <- c("New York", "California", 
                        "Michigan", "New Jersey",
                        "Hawaii")

states |>
  filter(sector != "Total", state %in% states_of_interest) |>
  ggplot(mapping = aes(x = year, y = p_members, color = state)) +
  geom_line() +
  facet_wrap(~ sector) +
  theme_minimal() +
  labs(
    title = "Per Capita Union Membership by State by Sector from 1978 - 2023",
    color = "State",
    x = "State",
    y = "Per Capita Union Membership",
    caption = "Dataset by Hersch et al., sourced from IPUMS CPS."
  )

Discussion

We see an obvious decline in union membership overall. Whereas, in 1983, it seems that just about every state had at least a 0.15 per capita membership (except South Carolina), with New York and Michigan having over 30% of workers unionized. Within 50 years, however, most states have a less than 18% membership, with New York falling to one quarter membership, and Michigan to less than 20%. It is clear that union have fallen out of favor in the past decades.

Today, the top five states by membership are New York, Hawaii, Alaska, California, and New Jersey. We choose these states to investigate (except we switch Alaska for Michigan).

It is clear, that in every sector, there is decline in union membership over the past five decades. Only in the public sector (teachers, police, firefighters, librarians, etc.) there is a less dramatic decline, and even some minor growth. For the private sectors we see rates around 50% falling to less than 18%. Over the years, workers have seen less and less the benefit of unions, and become more trusting of their employers.

The question remains: is this trust well-placed?

Question 2: How do Right to Work laws impact union membership and union coverage?

Introduction

Right to Work laws enable workers across various employment sectors to benefit from the actions of unions without actually having to be union members. In states with Right to Work laws on the books, individual workers can choose whether or not they personally want to be part of a union. In states without Right to Work laws, entire workplaces must vote to unionize and if they vote yes, then every worker in the workplace is required to join the union and pay union dues5. Critics of Right to Work laws argue that these laws allow workers to reap the benefits of unionization without contributing any support (thereby undermining the spirit of unionization and further benefiting anti-union capitalists), while Right to Work supporters argue that unionization should be an individual choice that nobody is forced to make. Our goal with this question is to investigate how Right to Work laws impact union membership across all industry sectors.

By investigating the question of how Right to Work laws impact union membership and union coverage, we wanted to look into claims made on both sides of the Right to Work debate using a data-driven approach. While it is up for debate whether or not workers should have to be union members in order to benefit from union actions, it is undeniable that unions do benefit workers7.

In order to address this question, we will be using the variables year, state, and p_members, and p_covered from the union_states data set, as well as data on the historical timeline of Right to Work states. This additional data set features a variable for each Right to Work state, as well as the date when each Right to Work state adopted their Right to Work laws.

Approach

In order to investigate how Right to Work laws impact union membership across all employment sectors, we will look at the percent of workers who are part of a union over time in Right to Work and non-Right to Work states. We will begin by creating a new variable called rtw (Right to Work)6 and joining it with the union_states data set. This variable represents whether or not each state was a Right to Work state in each year since 1983. Most Right to Work states adopted their policies in the mid 1900s, but some did not get Right to Work laws on the books until very recently. This new variable addresses how different states changed their Right to Work policies over time.

After the rtw variable is created, we will visualize the median percent of unionized workers over time in Right to Work and non-Right to Work states via a bar chart. For each year there will be two bars: one representing the median percent of unionized workers in Right to Work states and the other representing the median percent of unionized workers in non-Right to Work states. Next, we will look at the percent of workers covered by unions compared to the percent of workers who are actually union members in Right to Work and non-Right to Work states once again using a bar chart. In order to make this second bar chart, we will need the state, year, and p_covered variables from the union_states data set, as well as the new variable we made, rtw.

Analysis

rtw_states <- c('Arkansas', 'Florida', 'Arizona', 'Virginia', 'Nebraska', 'Tennessee', 'North Carolina', 'Georgia', 'Iowa', 'South Dakota', 'Texas', 'North Dakota', 'Nevada', 'Alabama', 'Mississippi', 'South Carolina', 'Utah', 'Kansas', 'Wyoming', 'Lousisiana')

union_states$year <- as.numeric(union_states$year)

union_states$rtw <- ifelse(union_states$state %in% rtw_states, 'Right to Work', 
  ifelse(union_states$state == 'Idaho' & union_states$year > 1985, 'Right to Work',  
  ifelse(union_states$state == 'Oklahoma' & union_states$year > 2001, 'Right to Work', 
  ifelse(union_states$state == 'Indiana' & union_states$year > 2012, 'Right to Work', 
  ifelse(union_states$state == 'Michigan' & union_states$year > 2013, 'Right to Work', 
  ifelse(union_states$state == 'Wisconsin' & union_states$year > 2015, 'Right to Work', 
  ifelse(union_states$state == 'West Virginia' & union_states$year > 2016,'Right to Work', 
  ifelse(union_states$state == 'Kentucky' & union_states$year > 2017, 'Right to Work', 'Non-Right to Work'))))))))

union_states_medians <- union_states |>
  group_by(year, rtw) |>
  summarise(med_p_covered = median(p_covered), med_p_members = median(p_members))
`summarise()` has grouped output by 'year'. You can override using the
`.groups` argument.
ggplot(union_states_medians, aes(x=year, y=med_p_members, fill=factor(rtw))) +
  geom_bar(stat='identity') +
  labs(title="Median Percent of Workers Who are Unionized in Right to \nWork and non-Right to Work States", y='median percent of workers', x='year') + 
  guides(fill=guide_legend(title="Right to Work")) +
  scale_fill_manual(values = c("cornflowerblue", "goldenrod1")) +
  theme_minimal()

union_states_medians2 <- union_states_medians |>
  pivot_longer(cols = c(med_p_members, med_p_covered),
               names_to = "members_or_covered",
               values_to = "median_percent")

ggplot(union_states_medians2, aes(x=year, y=median_percent, fill=members_or_covered)) +
  geom_bar(stat='identity') +
  facet_wrap(~ rtw, ncol = 1) +
  labs(title = "Percent of Workers Who are Union Members and \nPercent of Workers Covered by Unions \nin Right to Work and non-Right to Work States", x = "Year", y = "Median Percent of Workers", fill = "") +
  scale_fill_manual(values = c("cornflowerblue", "goldenrod1"), labels = c("Median Percent Covered", "Median Percent Members")) +
  theme_minimal()

Discussion

From the visualizations above, it is clear that Right to Work laws correlate with lower union membership numbers and lower levels of union coverage for non-union members. Right to Work critics argue that these laws allow non-union members to benefit from union actions thereby weakening direct support for unions, and while that is true, our analysis shows that Right to Work laws actually seem to go hand in hand with diminished union protections.

Additionally, our analysis revealed that union membership and union coverage have been steadily declining over the last 40 years. This trend is consistent across Right to Work and non-Right to Work states. This seems to indicate a larger erosion in support for unions that goes beyond Right to Work laws. The concentration of extreme wealth and virtual monopolies by large companies could potentially account for at least part of this observed trend, but this is just speculation.

Presentation

Our presentation can be found here.

Data

Hirsch, B., Macpherson, D., & Even, W. (2024). Union membership, coverage, and earnings from the CPS [Dataset]. Unionstats.com. https://www.unionstats.com/

References

1Union Membership, Coverage, and Earnings from the CPS by Barry Hirsch (Georgia State University), David Macpherson (Trinity University), and William Even (Miami University)

2Data sources:

  • 1973-1981: May Current Population Survey (CPS)

  • 1982: No union questions available

  • 1983-2022: CPS Outgoing Rotation Group (ORG) Earnings Files

3Data sources:

  • 1973-1981: May Current Population Survey (CPS)
  • 1982: No union questions available
  • 1983-2022: CPS Outgoing Rotation Group (ORG) Earnings Files

4Data source: Current Population Survey (CPS) Outgoing Rotation Group (ORG) Earnings Files

5Investopedia What Is a Right-to-Work Law, and How Does It Work?

6Right to Work States Timeline

7Labor Unions and the Middle Class