Unveiling UFO Sighting Patterns Across Education, Politics, and Time 🛸
Using TidyTuesday’s UFO sightings dataset
2024-03-01
About the Dataset
ufo_sightings.csv- This csv file gives information about when, where, how, and important information pertinent to the sighting itself
places.csv- Gives additional information about the geography
day_parts_map.csv- Gives information about the sunrise, sunset, and astronomy information about the day in particular
- We have an accompanying dataset of states with their low-literacy rates and political leaning
Question 1
Are the prevalence of UFO reports related to states with lower literacy rates or certain political leanings?
UFO sighting relative to literacy rates

Question 1
Are the prevalence of UFO reports related to states with lower literacy rates or certain political leanings?
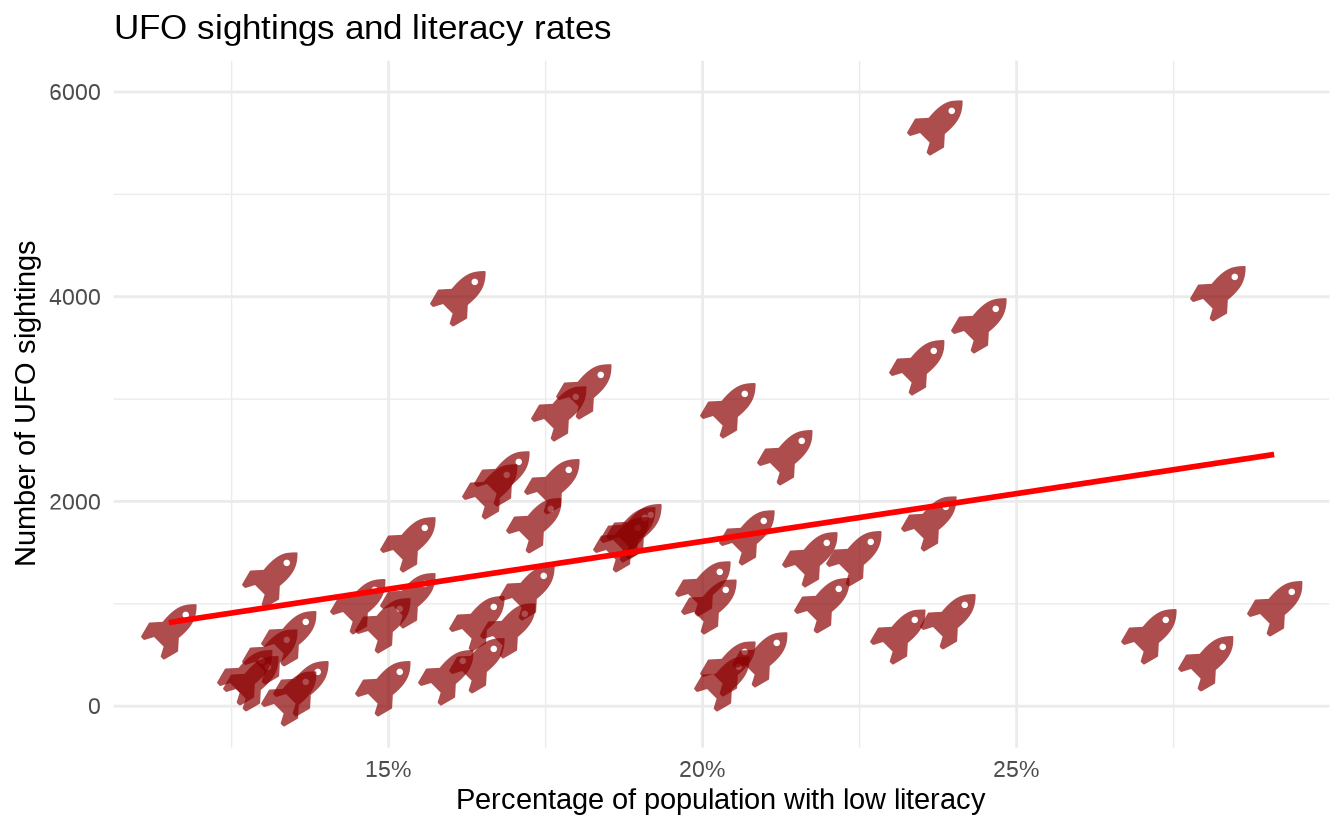
In the first graph, with the percentage with low literacy being in the x axis, and number of UFO sightings in the y axis, we can see increase in UFO sightings when there is a larger porportion in the population with a lower literacy rate.
In other words, as the lower-literacy rate (percentage of individuals who are illiterate) increases of a state/region, the number of UFO sightings increase.
UFO sighting relative to political leaning

Question 1
Are the prevalence of UFO reports related to states with lower literacy rates or certain political leanings?
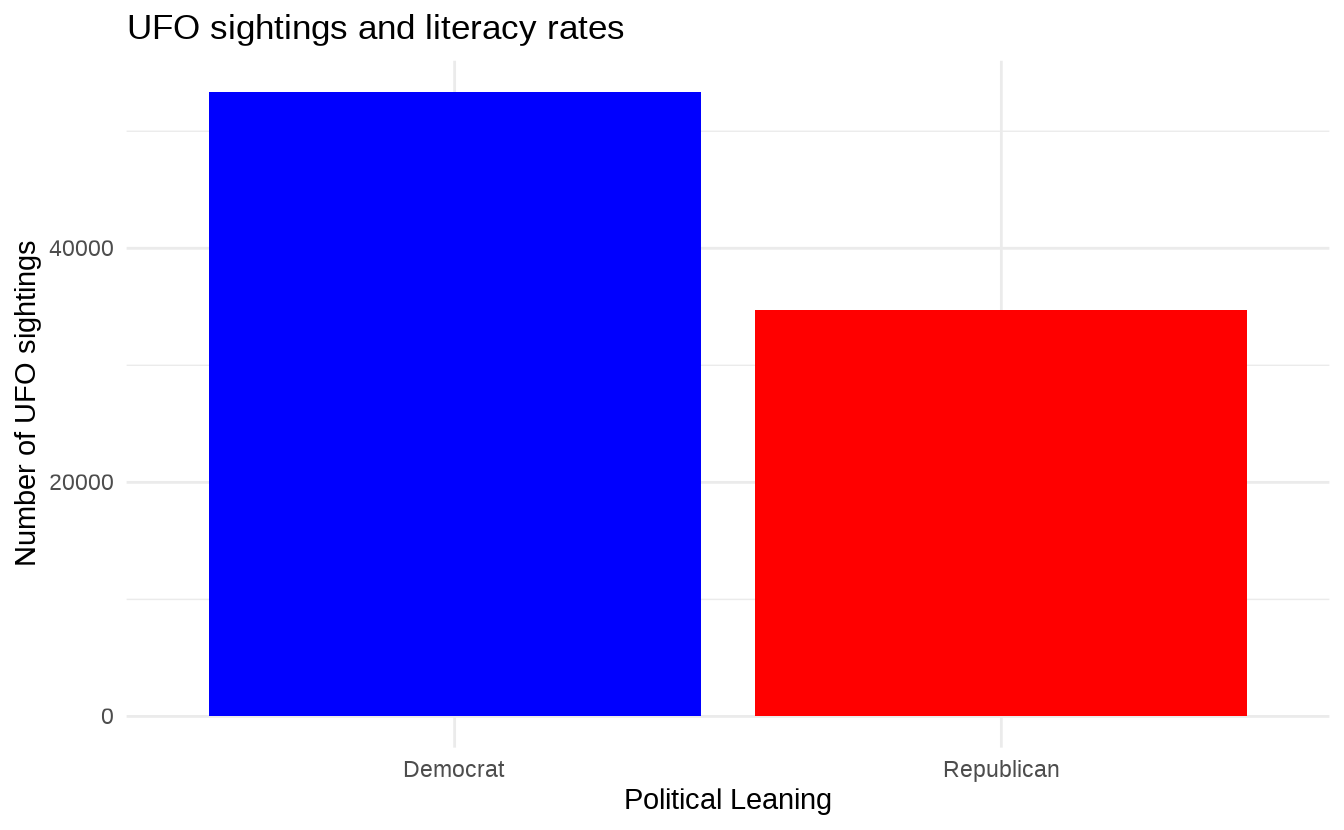
In the second graph, we see that Democrat represented states have an overall more UFO sightings then Republican represented states.
- This may also be attributed to age and population in these states which may not be accounted for
Question 2
During what part of year is UFO sighting more frequent and how does these trends change over the years?
UFO Sighting Frequency by Season

Question 2
During what part of year is UFO sighting more frequent and how does these trends change over the years?
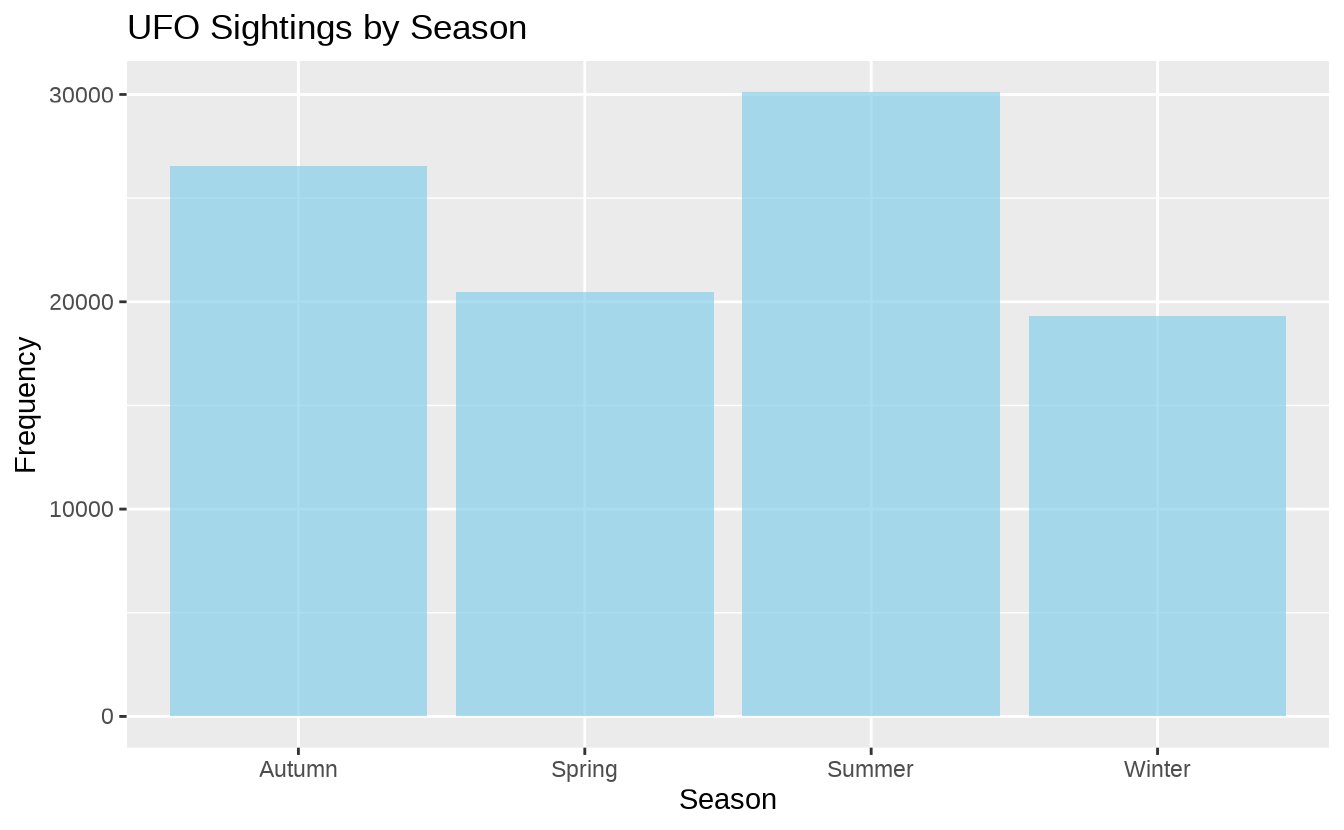
According to the results, for the first graph, UFO Sighting Frequency by Season, we discovered that UFO sightings tend to be more frequent in summer and autumn than spring and winter.
- One possible cause is the correlation of summer with increased outdoor activities, increasing the chance of spotting an ufo.
UFO Sighting Season Trend Over Time

Question 2
During what part of year is UFO sighting more frequent and how does these trends change over the years?
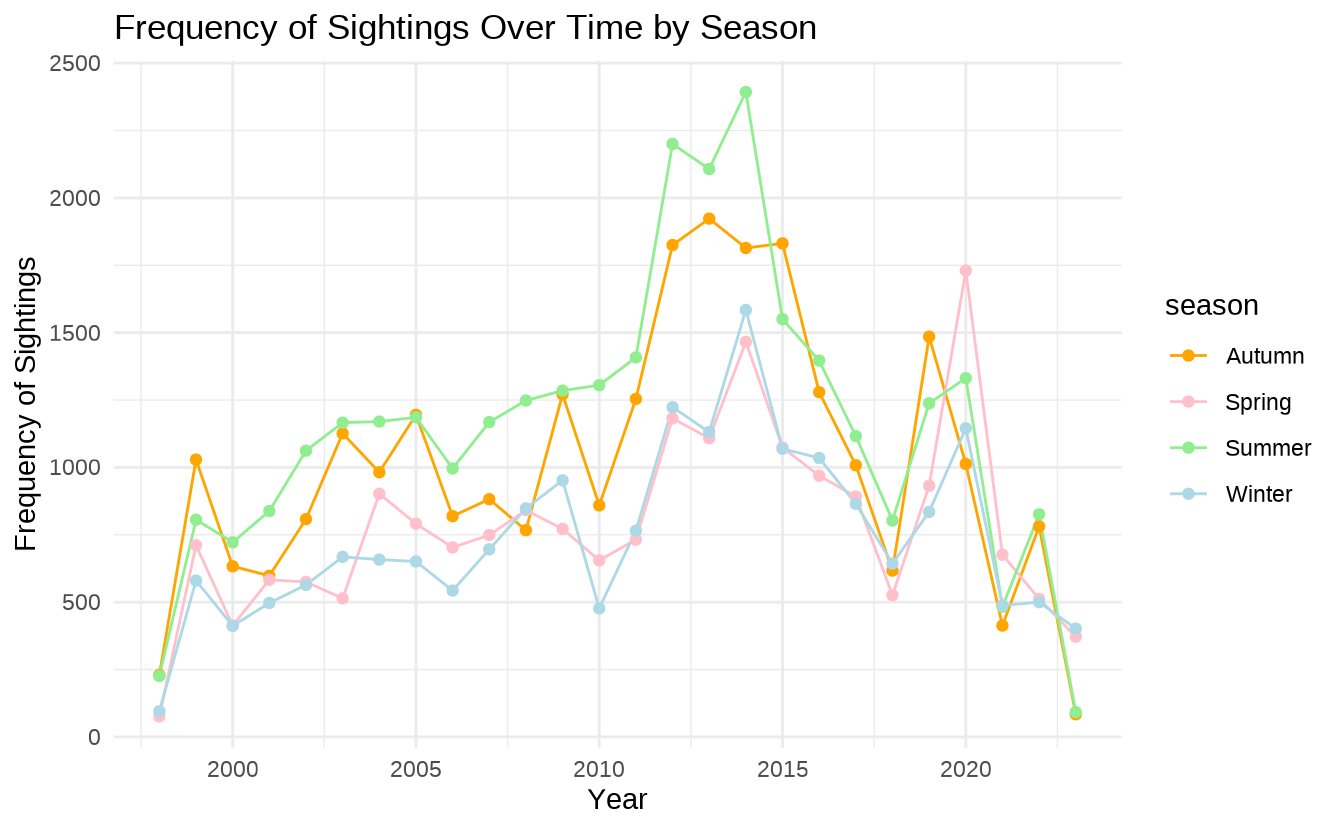
For the second graph, it reconfirms the summer as the prime time to spot and report an ufo.
The trend for all seasons increased up to the peak in 2014, then reached a drastic decline until around 2018.
This is possibly related to the news that in 2015, Californians called law enforcement regarding an “UFO”, a bright light cutting through the sky, which turned out to be a test missile of the US Navy. This may have dampened the enthusiasm of the reporting crowd.