── Attaching core tidyverse packages ──────────────────────── tidyverse 2.0.0 ──
✔ dplyr     1.1.4     ✔ readr     2.1.5
✔ forcats   1.0.0     ✔ stringr   1.5.1
✔ ggplot2   3.4.4     ✔ tibble    3.2.1
✔ lubridate 1.9.3     ✔ tidyr     1.3.0
✔ purrr     1.0.2
── Conflicts ────────────────────────────────────────── tidyverse_conflicts() ──
✖ dplyr::filter() masks stats::filter()
✖ dplyr::lag()    masks stats::lag()
ℹ Use the conflicted package (<http://conflicted.r-lib.org/>) to force all conflicts to become errors
Loading required package: lattice


Attaching package: 'caret'


The following object is masked from 'package:purrr':

    lift


Attaching package: 'plotly'


The following object is masked from 'package:ggplot2':

    last_plot


The following object is masked from 'package:stats':

    filter


The following object is masked from 'package:graphics':

layoutHoliday Movies & Their Changes
Introduction
Our dataset includes CSV files about movies with holiday themes. From those datasets, the one we are using, ‘holiday_movies.csv’, contains detailed information about each movie, including identifiers, titles, release years, runtime, genres, ratings, vote counts, and boolean flags indicating the presence of specific holiday keywords in the title (like “Christmas,” “Hanukkah,” “Kwanzaa,” and “holiday”).
The ‘tconst’ column is a unique alphanumeric identifier for each movie, typical for movie databases like IMDb. The ‘title_type’, ‘primary_title’, ‘original_title’, and ‘simple_title’ fields provide different formats of the movie’s title. The ‘title_type’ shows the format of the title (movie, video, or tvMovie), ‘primary_title’ shows the promotional title, ‘original_title’ shows the original language title, and ‘simple_title’ contains titles for filtering and grouping. The ‘year’, ‘runtime_minutes’, ‘average_rating’, and ‘num_votes’ fields contain numerical data about the release year, movie duration, IMDb user rating, and the number of votes, respectively. The ‘genres’ field contains up to three genres associated with each movie. Lastly, The ‘christmas’, ‘hanukkah’, ‘kwanzaa’, and ‘holiday’ fields are boolean (logical) indicators that reflect whether the movie’s title contains particular holiday-related terms.
Question 1 <- What’s the average rating and counts of different holiday movie genres across the decades, and which genres are the most popular for each decade?
Introduction
The question looks into the changes in average ratings and counts of the diverse genres of holiday movies in our dataset. We were interested in this question as we wanted to see whether there was a particularly preferred genre over the years, as that information could then be utilized for future production of popular holiday movies.
We plan to answer the first question by utilizing variables, ‘average_rating’, ‘genres’, and ‘year’. We will create a new variable for decades and group the data from ‘year’ accordingly. Then, we will calculate the average rating for each decade and find the number of movies in each genre within ‘genres’ for each decade.
Approach
We will use stacked bar charts to visualize genre distribution over the decades and a line chart to visualize average ratings over decades. We plan to plot the line chart with interactivity, showing which genre is which to visualize trends better. The stacked bar chart will help visualize the different distribution of genres per decade through different color coding. Moreover, the line chart will help show the changes in average ratings more clearly. For further analysis, we will also create faceted bar charts showing each genre’s count change per decade and faceted line charts showing the change in average rating per genre. The faceted charts will help us visualize each genre’s changes more clearly.
Along with the interactive visualization, we plan on employing multivariate regression analysis. The regression analysis will help quantify the relationship between the ‘average_rating’ of the movies and the popularity of ‘genres’ over the decades. We will work with the dependent variable of ‘average_rating’ and the independent variables of genre, decade (new variable), and ‘movies_per_genre’ (new variable). These analyses will provide us with patterns in genre shifts over decades that may correlate with major cultural or global events, highlighting the cultural influence on the movie industry.
Analysis
holiday_movies_q1 <- holiday_movies |>
  mutate(
    decade = 10 * (year %/% 10),
    genre_list = strsplit(as.character(genres), ",\\s*")
  )


# Count the number of movies per genre for each decade
genre_count_decade <- holiday_movies_q1 |>
  unnest(genre_list) |>
  group_by(decade, genre_list) |>
  summarise(count = n())
`summarise()` has grouped output by 'decade'. You can override using the
`.groups` argument.# Calculate the average rating for each genre within each decade
genre_rating_decade <- holiday_movies_q1 |>
unnest(genre_list) |>
group_by(decade, genre_list) |>
summarise(average_rating = mean(average_rating, na.rm = TRUE))`summarise()` has grouped output by 'decade'. You can override using the
`.groups` argument.# Visualize the genre distribution over the decades with a stacked bar chart
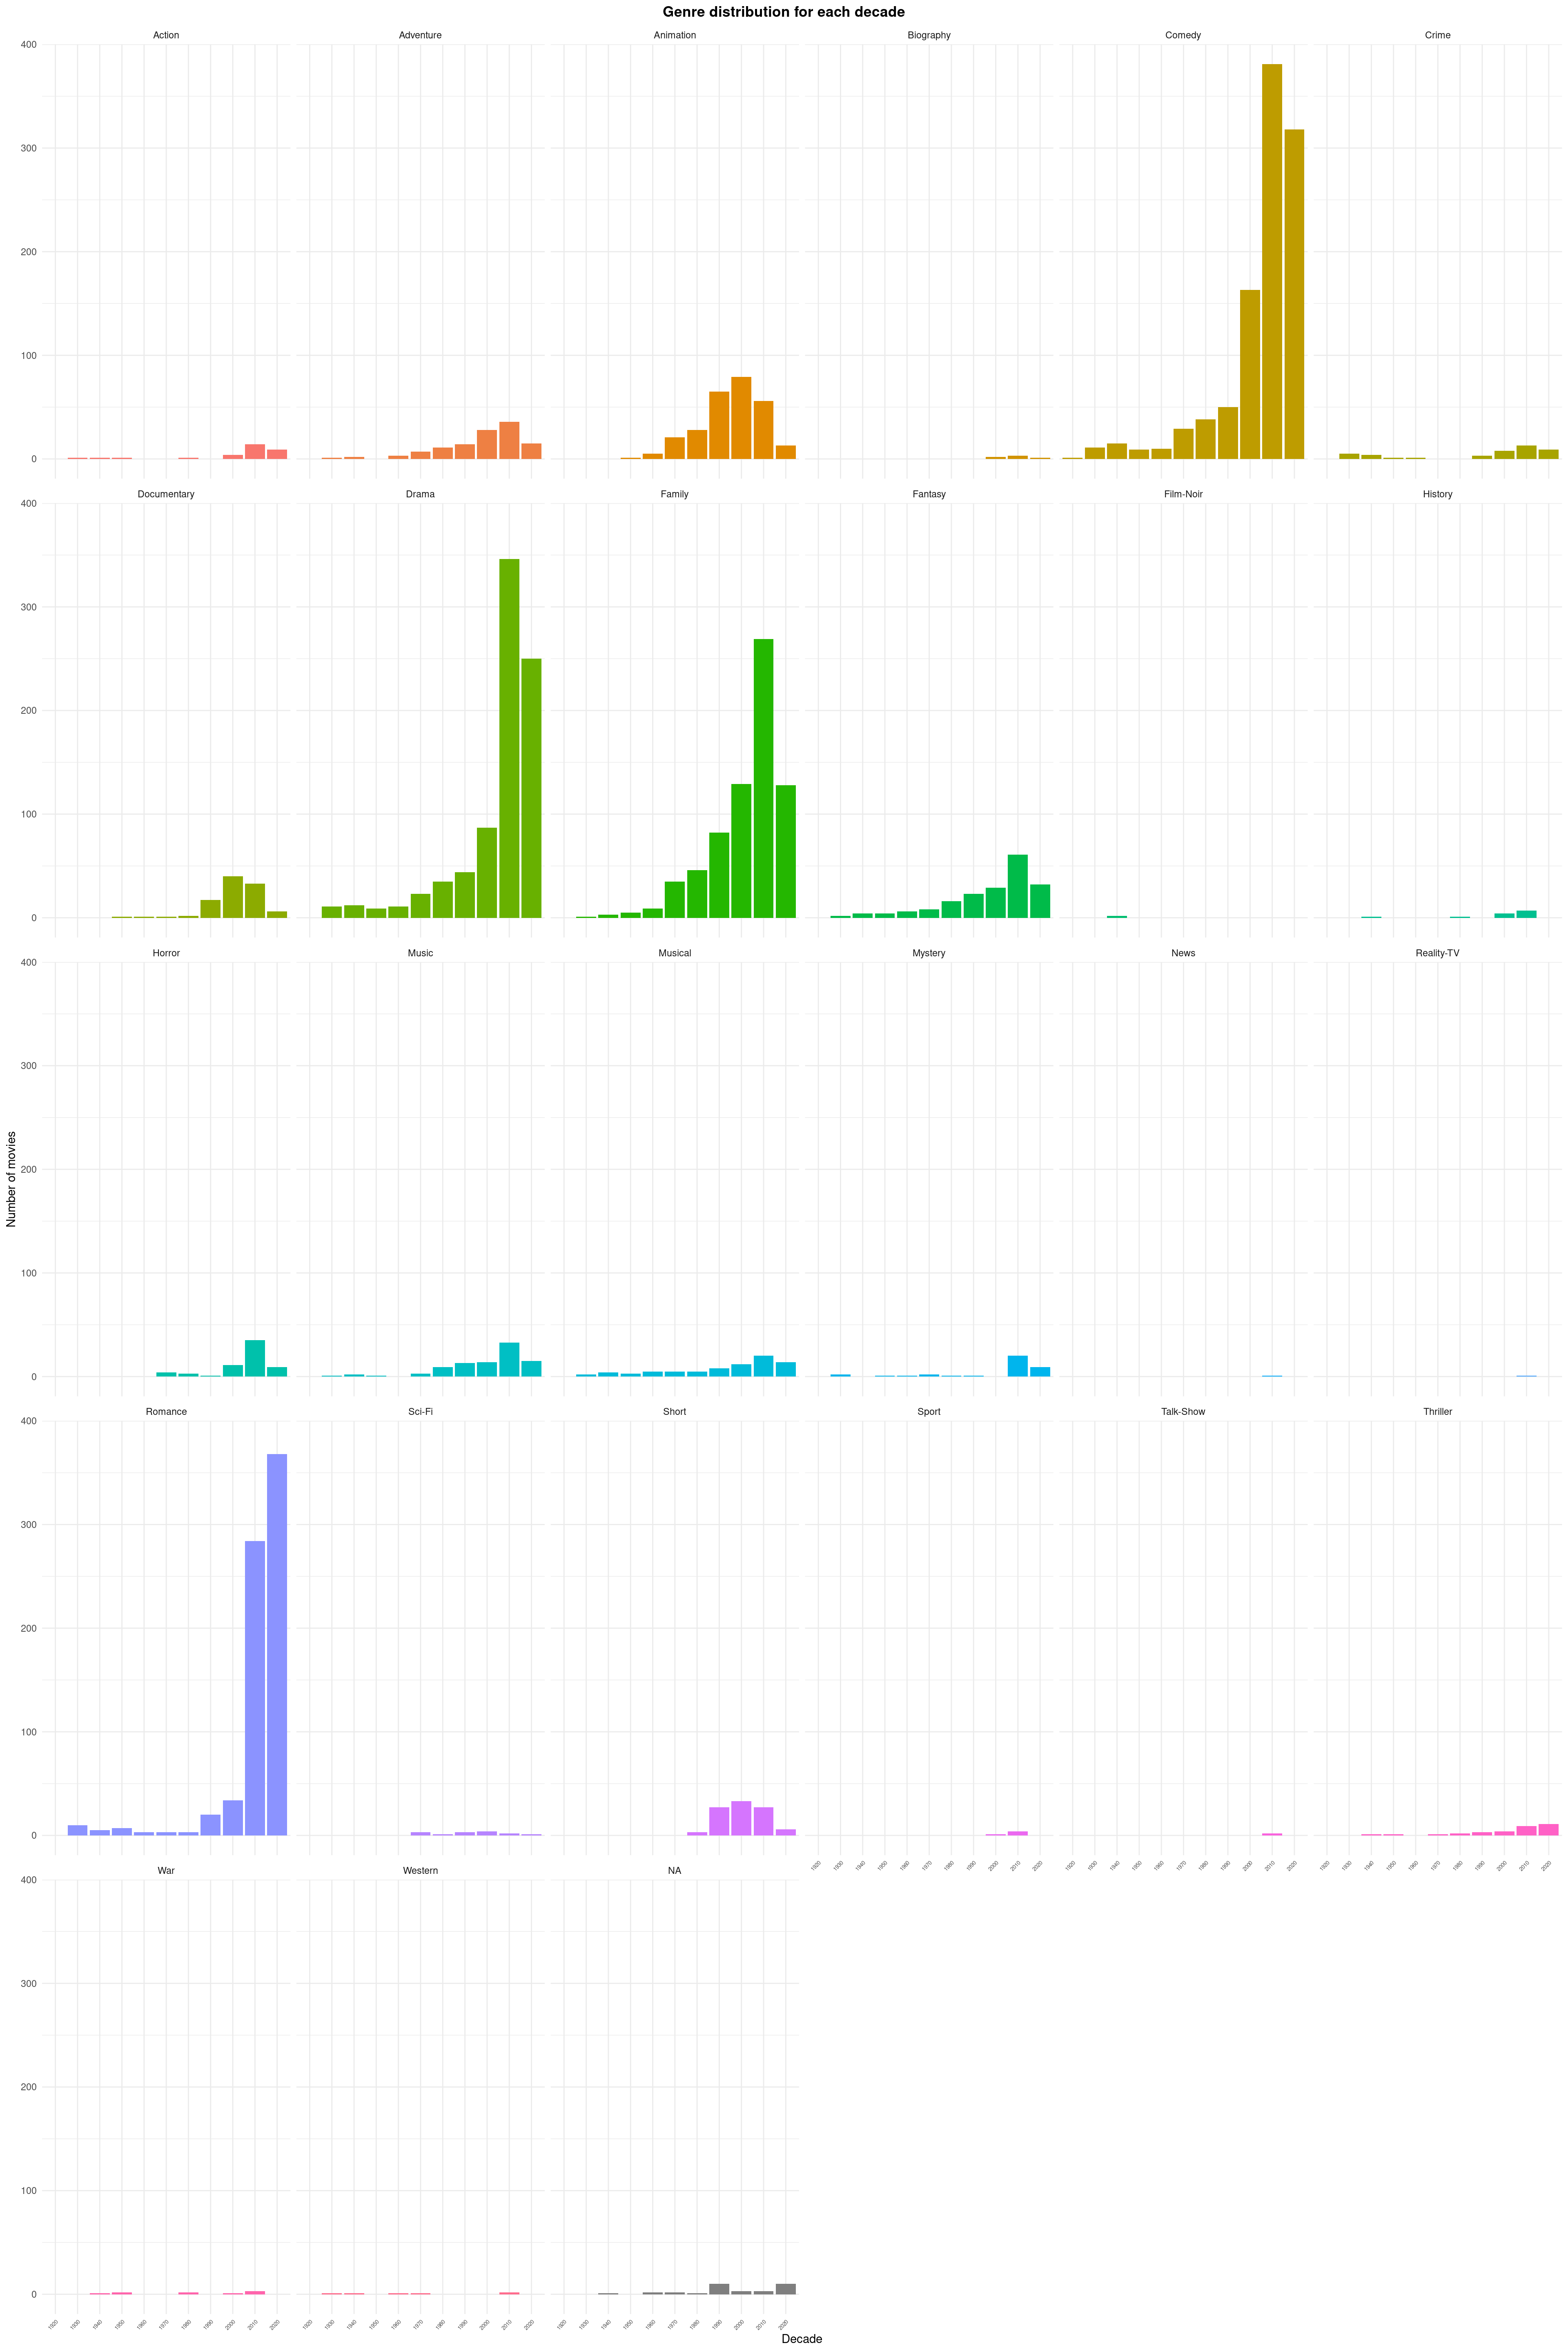
ggplot(genre_count_decade, aes(x = as.factor(decade), y = count, fill = genre_list)) +
geom_bar(stat = "identity") +
theme_minimal() +
labs(
title = "Genre distribution for each decade",
x = "Decade", y = "Number of movies",
fill = "Genre"
) +
theme(
axis.text.x = element_text(angle = 45, hjust = 1),
plot.title = element_text(face = "bold", hjust = 0.5),
plot.title.position = "plot"
)
# Facet wrap for each genre
ggplot(genre_count_decade, aes(x = as.factor(decade), y = count, fill = genre_list)) +
  geom_bar(stat = "identity", show.legend = FALSE) +
  theme_minimal() +
  facet_wrap(facets = vars(genre_list)) +
  scale_y_continuous() +
  labs(
    title = "Genre distribution for each decade",
    x = "Decade", y = "Number of movies",
    fill = "Genre"
    ) +
  theme(
    axis.text.x = element_text(angle = 45, hjust = 1, size = 5),
    plot.title = element_text(face = "bold", hjust = 0.5),
    plot.title.position = "plot"
    )
# Visualize average ratings over decades with a line chart
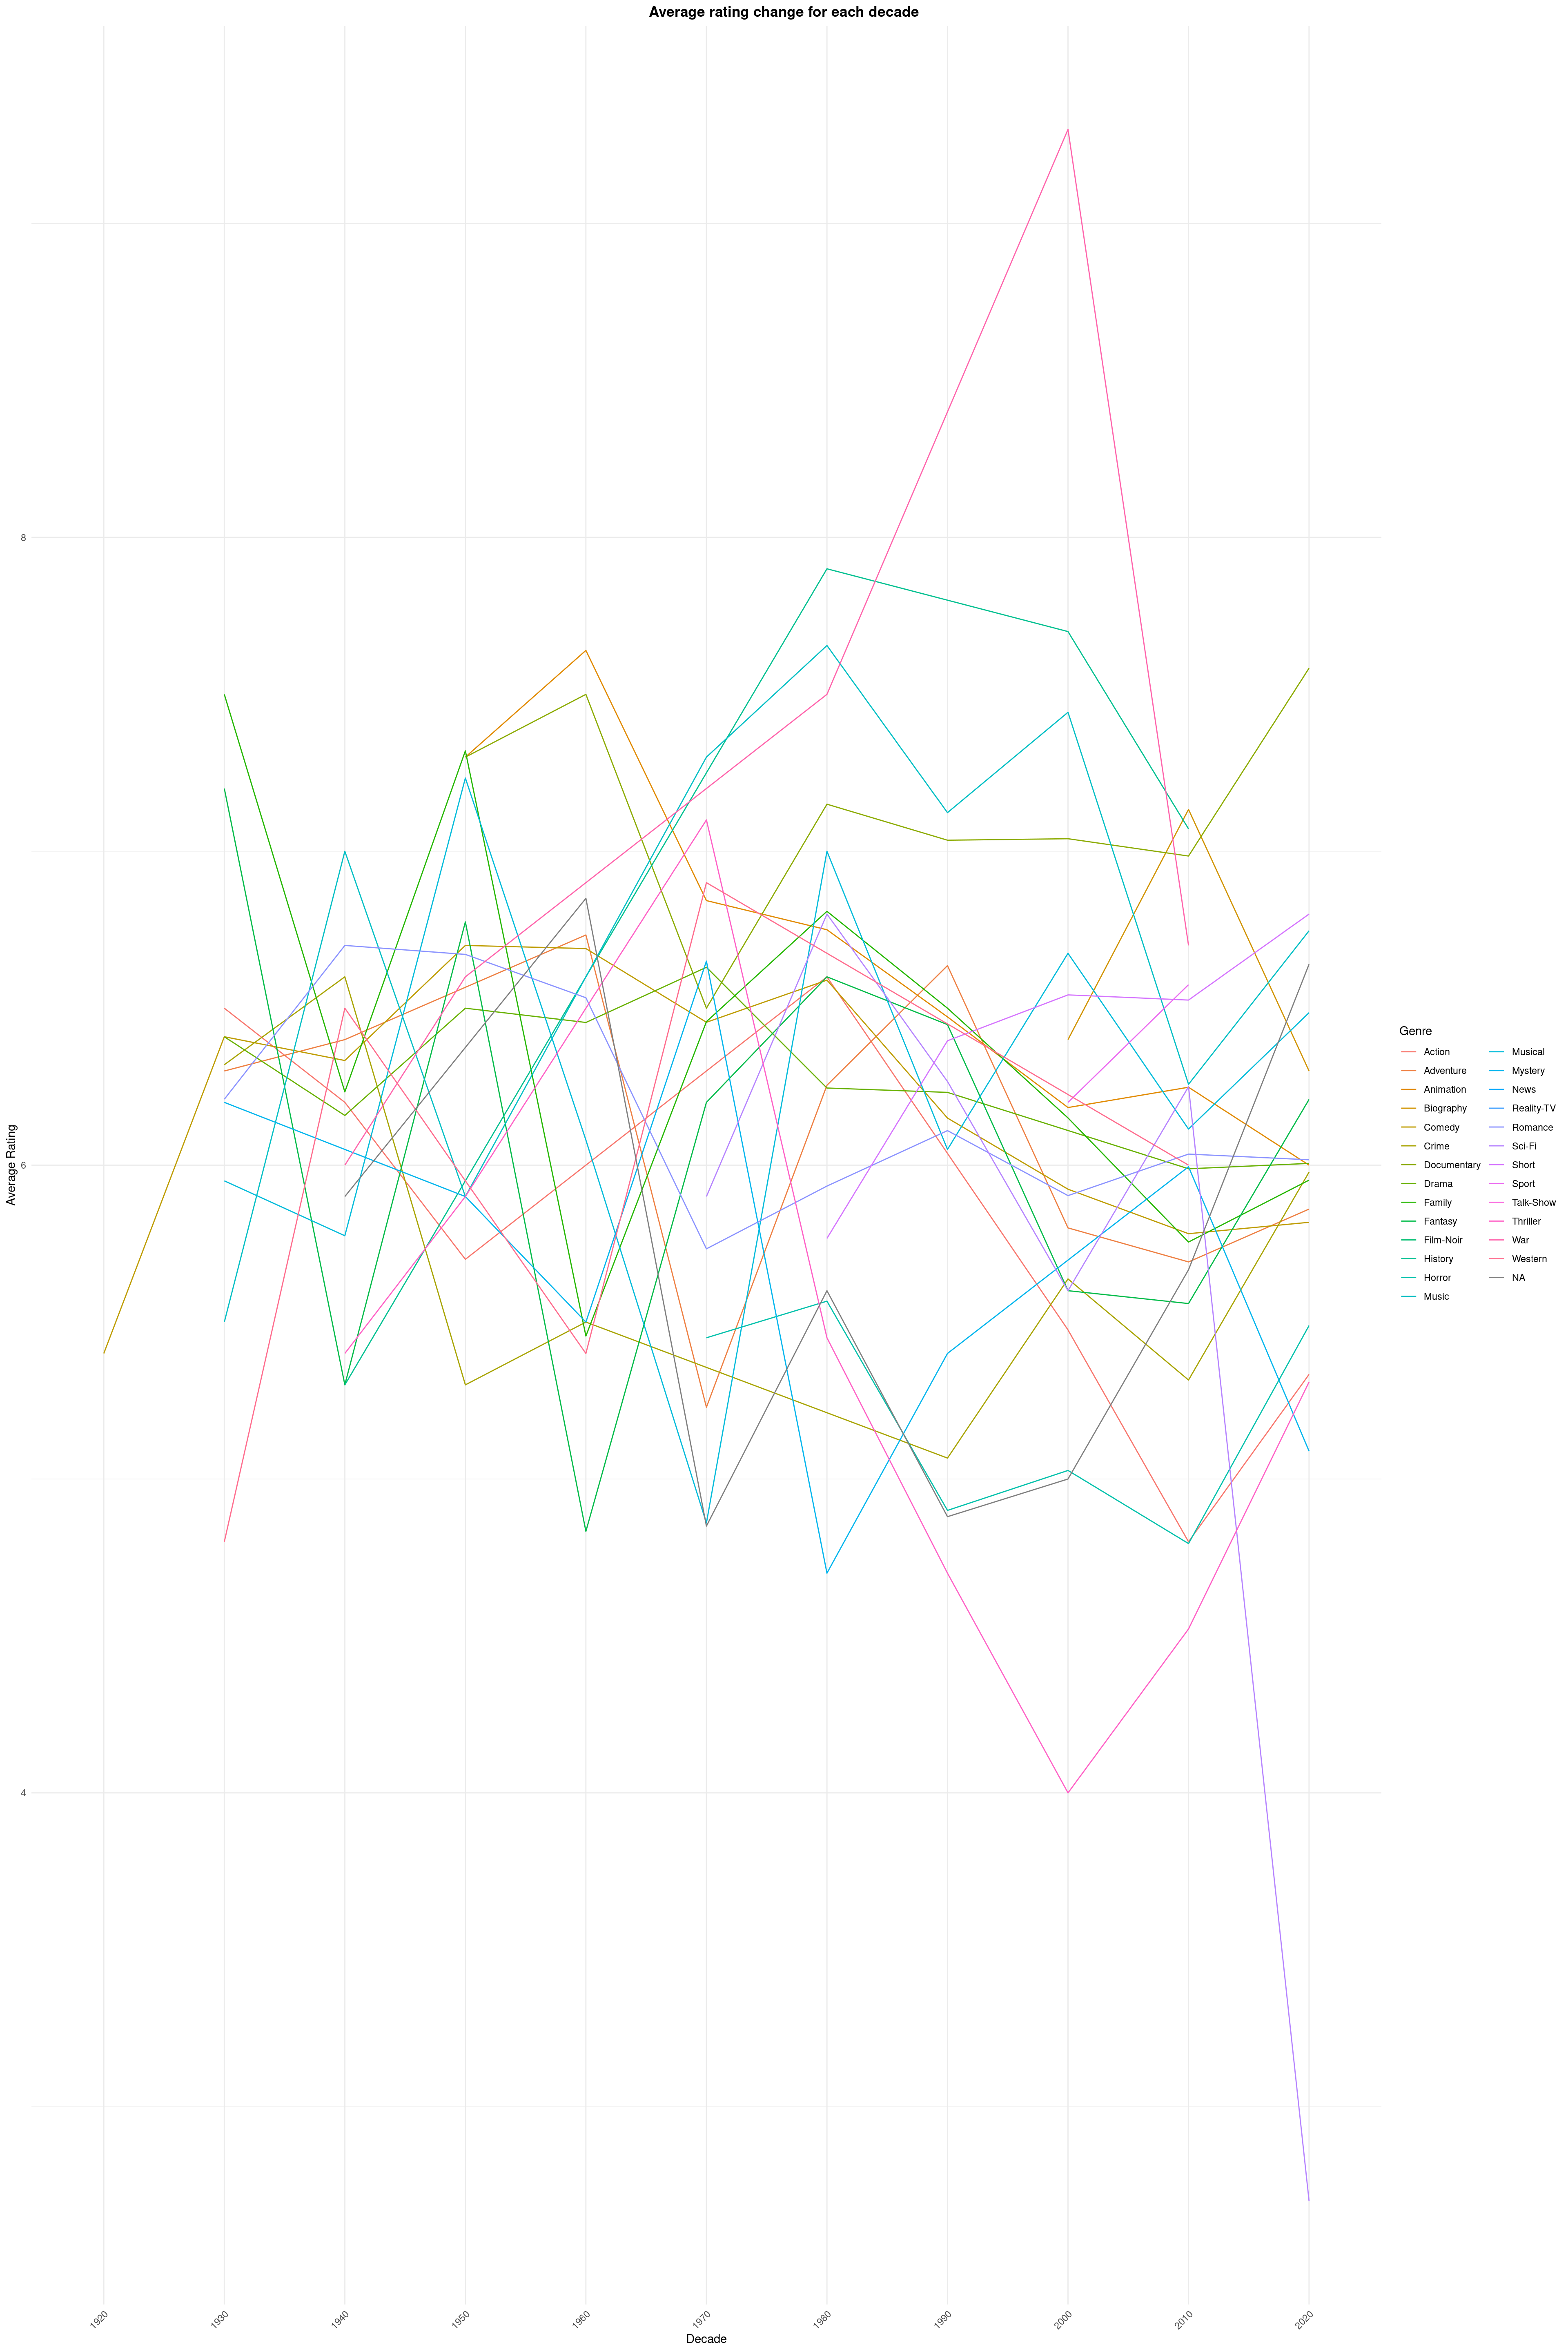
ggplot(genre_rating_decade, aes(x = as.factor(decade), y = average_rating, group = genre_list, color = genre_list)) +
geom_line() +
theme_minimal() +
labs(
title = "Average rating change for each decade",
x = "Decade", y = "Average Rating",
color = "Genre"
) +
theme(
axis.text.x = element_text(angle = 45, hjust = 1),
plot.title = element_text(face = "bold", hjust = 0.5),
plot.title.position = "plot"
)
# Facet wrap each average rating line
ggplot(genre_rating_decade, aes(x = as.factor(decade), y = average_rating, group = genre_list, color = genre_list)) +
  geom_line() +
  theme_minimal() +
  facet_wrap(facets = vars(genre_list)) +
  scale_y_continuous() +
  labs(
    title = "Average rating change for each genre",
    x = "Decade", y = "Average Rating",
    color = "Genre"
    ) +
  theme(
    axis.text.x = element_text(angle = 45, hjust = 1, size = 5),
    plot.title = element_text(face = "bold", hjust = 0.5),
    plot.title.position = "plot",
    legend.position = ""
        )
`geom_line()`: Each group consists of only one observation.
ℹ Do you need to adjust the group aesthetic?
`geom_line()`: Each group consists of only one observation.
ℹ Do you need to adjust the group aesthetic?
`geom_line()`: Each group consists of only one observation.
ℹ Do you need to adjust the group aesthetic?
`geom_line()`: Each group consists of only one observation.
ℹ Do you need to adjust the group aesthetic?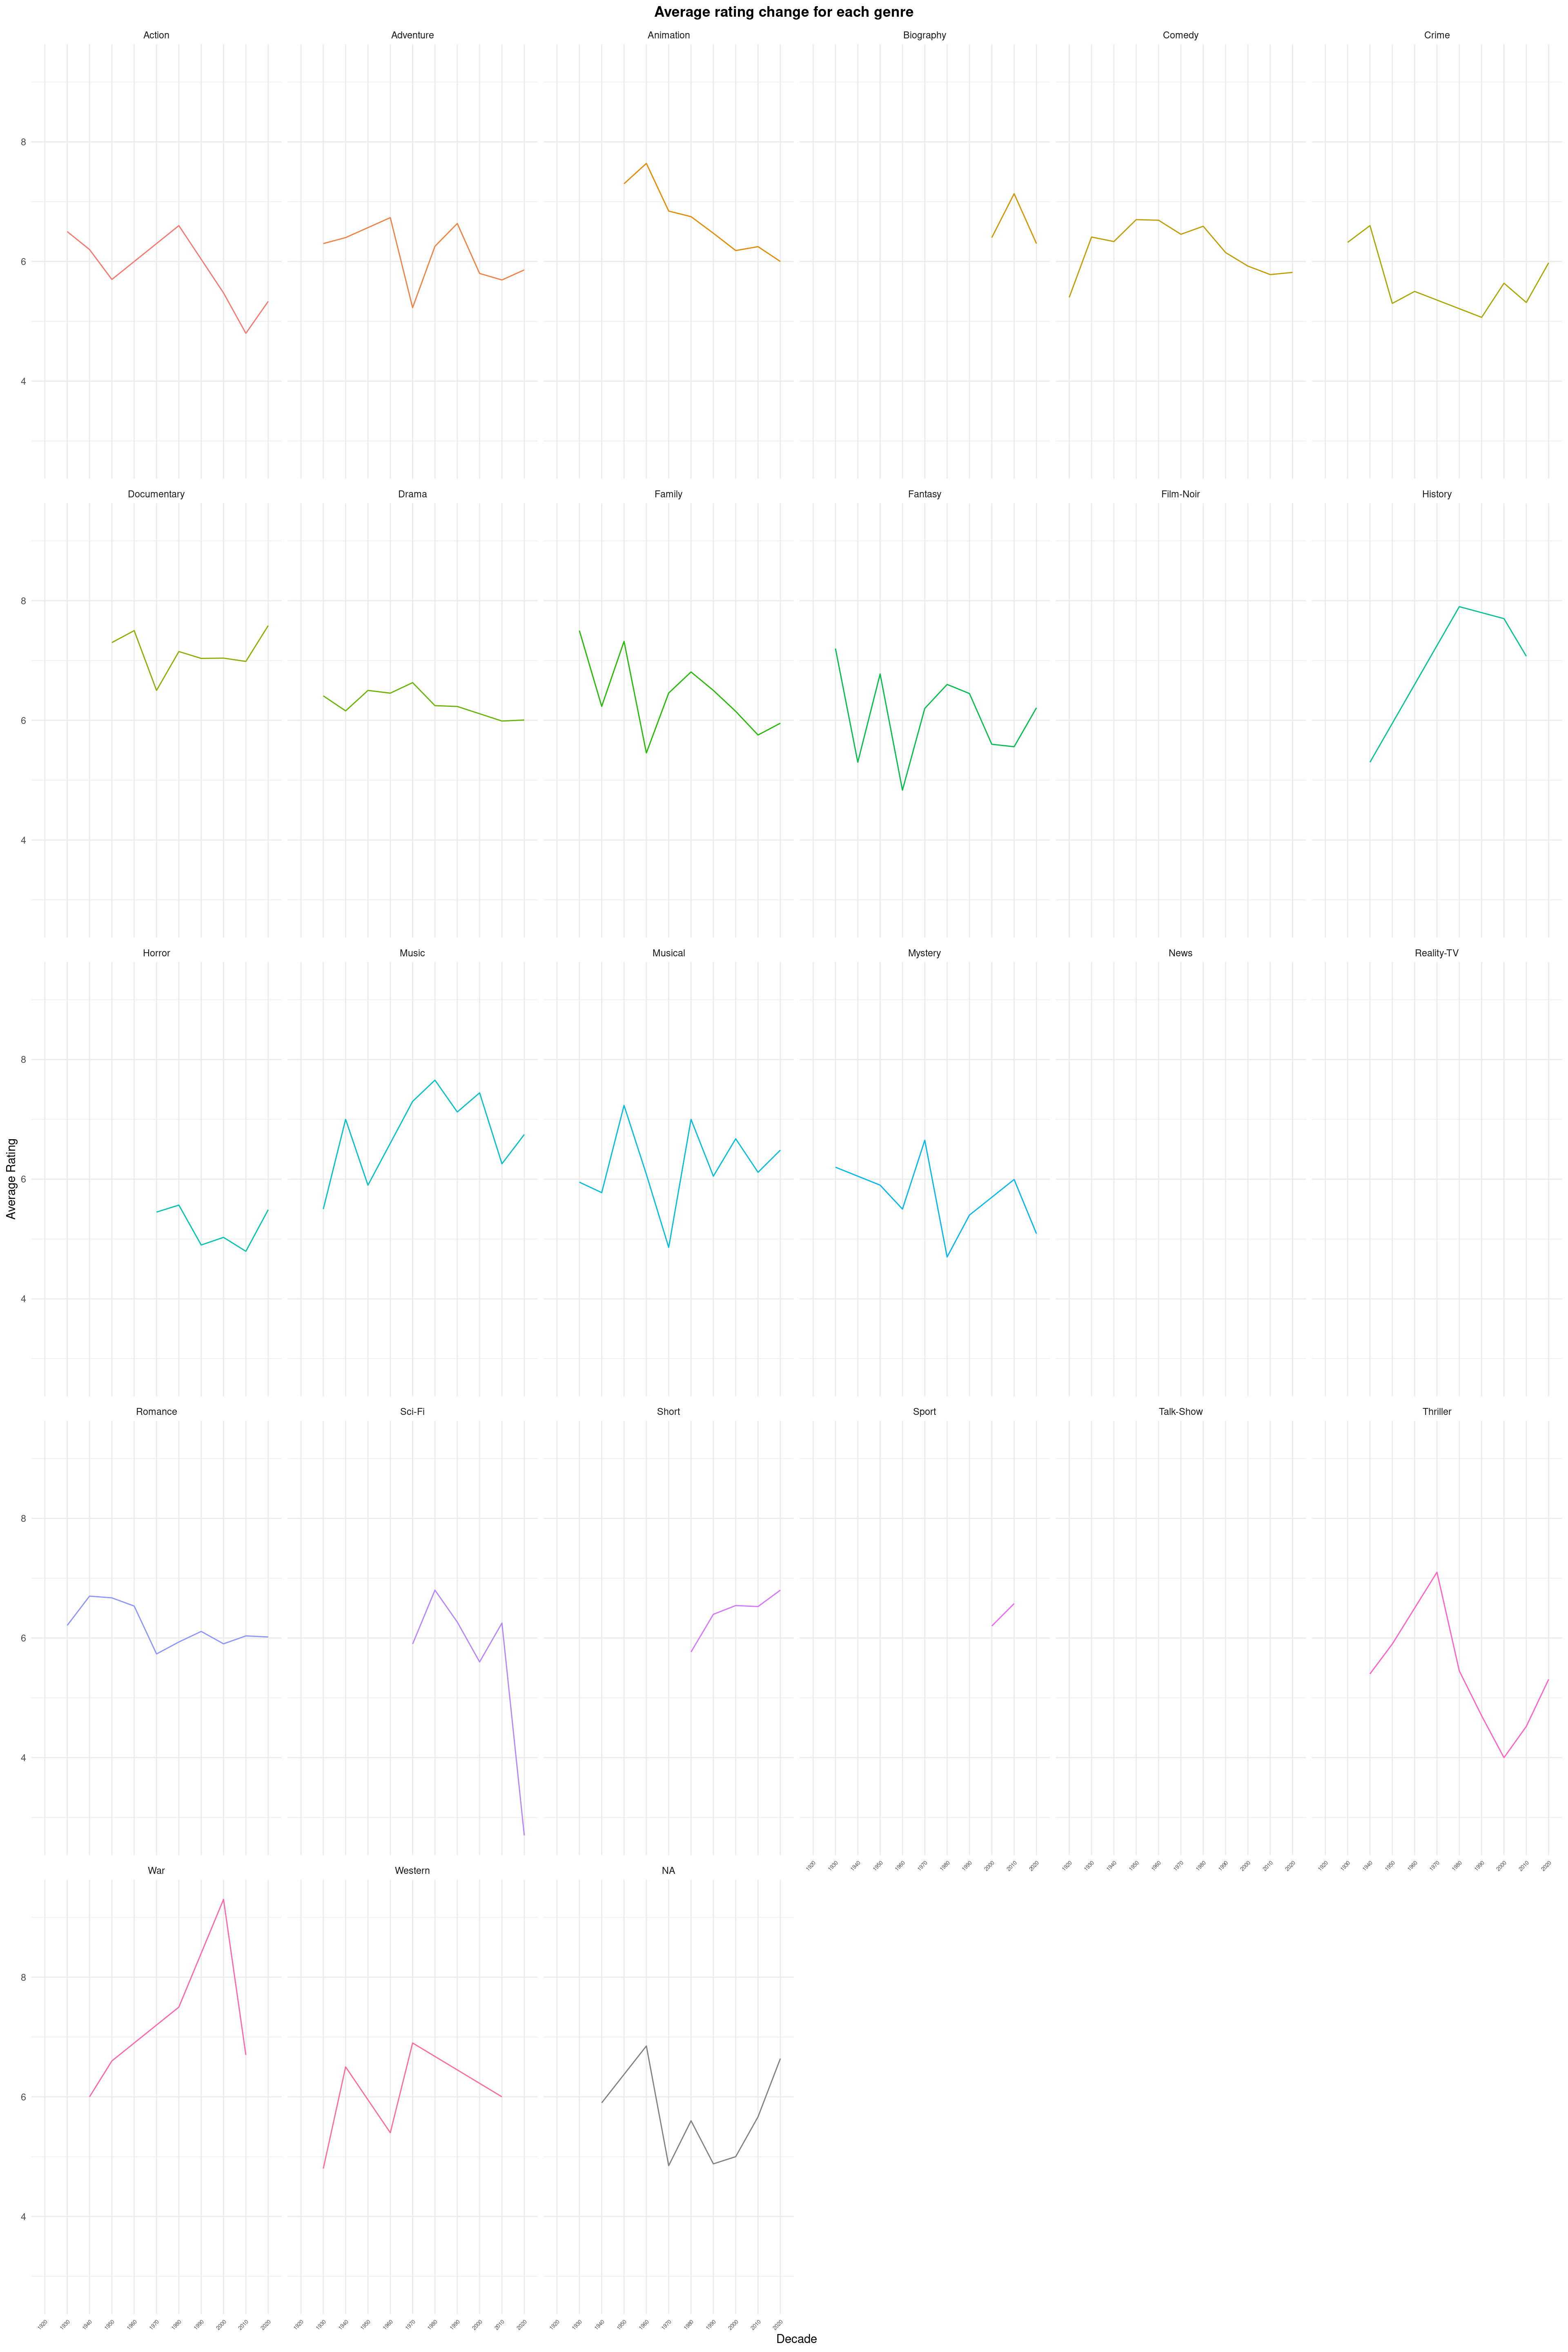
#Join dataframes
combined_data <- genre_rating_decade |>
  inner_join(genre_count_decade, by = "decade")
Warning in inner_join(genre_rating_decade, genre_count_decade, by = "decade"): Detected an unexpected many-to-many relationship between `x` and `y`.
ℹ Row 2 of `x` matches multiple rows in `y`.
ℹ Row 2 of `y` matches multiple rows in `x`.
ℹ If a many-to-many relationship is expected, set `relationship =
"many-to-many"` to silence this warning.# Multivariate regression analysis
regression_model <- lm(average_rating ~ genre_list.x + as.factor(decade) + count, data = combined_data)
summary(regression_model)
Call:
lm(formula = average_rating ~ genre_list.x + as.factor(decade) +
    count, data = combined_data)

Residuals:
    Min      1Q  Median      3Q     Max
-2.6835 -0.2335  0.0000  0.3614  2.0562

Coefficients:
                          Estimate Std. Error t value Pr(>|t|)
(Intercept)              4.889e+00  5.867e-01   8.333  < 2e-16 ***
genre_list.xAdventure    3.578e-01  6.987e-02   5.122 3.22e-07 ***
genre_list.xAnimation    8.782e-01  7.154e-02  12.274  < 2e-16 ***
genre_list.xBiography    1.127e+00  8.930e-02  12.623  < 2e-16 ***
genre_list.xComedy       5.114e-01  6.845e-02   7.471 1.04e-13 ***
genre_list.xCrime        2.086e-02  7.209e-02   0.289 0.772279
genre_list.xDocumentary  1.410e+00  7.154e-02  19.705  < 2e-16 ***
genre_list.xDrama        5.222e-01  6.845e-02   7.629 3.17e-14 ***
genre_list.xFamily       6.322e-01  6.845e-02   9.236  < 2e-16 ***
genre_list.xFantasy      3.144e-01  6.845e-02   4.592 4.57e-06 ***
genre_list.xFilm-Noir    1.279e+00  1.589e-01   8.054 1.15e-15 ***
genre_list.xHistory      1.403e+00  8.313e-02  16.879  < 2e-16 ***
genre_list.xHorror      -5.045e-01  7.534e-02  -6.697 2.54e-11 ***
genre_list.xMusic        1.103e+00  6.951e-02  15.869  < 2e-16 ***
genre_list.xMusical      5.277e-01  6.845e-02   7.708 1.73e-14 ***
genre_list.xMystery     -8.308e-02  7.268e-02  -1.143 0.253122
genre_list.xNews         1.122e+00  1.275e-01   8.800  < 2e-16 ***
genre_list.xReality-TV   3.822e+00  1.275e-01  29.978  < 2e-16 ***
genre_list.xRomance      4.322e-01  6.845e-02   6.314 3.14e-10 ***
genre_list.xSci-Fi      -7.441e-02  7.534e-02  -0.988 0.323422
genre_list.xShort        7.698e-01  7.820e-02   9.844  < 2e-16 ***
genre_list.xSport        8.442e-01  1.008e-01   8.376  < 2e-16 ***
genre_list.xTalk-Show   -1.028e+00  1.275e-01  -8.065 1.05e-15 ***
genre_list.xThriller    -5.102e-01  7.089e-02  -7.196 7.79e-13 ***
genre_list.xWar          1.575e+00  7.916e-02  19.900  < 2e-16 ***
genre_list.xWestern      3.224e-01  8.361e-02   3.857 0.000117 ***
as.factor(decade)1930    9.978e-01  5.862e-01   1.702 0.088844 .
as.factor(decade)1940    7.319e-01  5.855e-01   1.250 0.211392
as.factor(decade)1950    1.095e+00  5.857e-01   1.869 0.061728 .
as.factor(decade)1960    8.176e-01  5.861e-01   1.395 0.163125
as.factor(decade)1970    1.003e+00  5.855e-01   1.713 0.086899 .
as.factor(decade)1980    1.112e+00  5.851e-01   1.900 0.057532 .
as.factor(decade)1990    8.100e-01  5.853e-01   1.384 0.166487
as.factor(decade)2000    7.799e-01  5.850e-01   1.333 0.182578
as.factor(decade)2010    5.896e-01  5.849e-01   1.008 0.313542
as.factor(decade)2020    5.693e-01  5.852e-01   0.973 0.330753
count                    1.001e-19  1.587e-04   0.000 1.000000
---
Signif. codes:  0 '***' 0.001 '**' 0.01 '*' 0.05 '.' 0.1 ' ' 1

Residual standard error: 0.5827 on 2966 degrees of freedom
  (147 observations deleted due to missingness)
Multiple R-squared:  0.5631,    Adjusted R-squared:  0.5578
F-statistic: 106.2 on 36 and 2966 DF,  p-value: < 2.2e-16
# Combine the plots with plotly for interactivity
ggplotly()Discussion
Overall, based on the bar charts, there were high occurrences of comedy, drama, family, and romance genre movies throughout the decades, with a boost in the number of movies being shown for all four genres in the 2010s. On the other hand, considering the line charts, there had been overall high average ratings for animation, documentary, family, history, music, and war genre movies. Even from a glance, we can see that the highly rated movies don’t tend to match the greatest count of movies.
Furthermore, chronologically, the 1920s had comedy, the 1930s had drama, the 1940s had comedy, the 1950s and 1960s had drama, the 1970s, 1980s, and 1990s had family, the 2000s and 2010s had comedy, and the 2020s had romance as their most produced genre of movies. On the other hand, chronologically, the 1920s had comedy, the 1930s had family, the 1940s had music, the 1950s had family, the 1960s had animation, the 1970s had music, the 1980s had history, the 1990s and 2000s had war, the 2010s had biography, and the 2020s had documentaries as their highest average rated genre of movies. Analyzing each decade from the faceted charts shows that the highest average-ranked movies are not equivalent to the most produced movies for each decade.
Therefore, we cannot use the two metrics together to determine which movie was the most popular for each decade.
Question 2 <- How did Christmas, Hanukkah, and Kwanzaa movie distribution change over the years? How different are their average ratings?
Introduction
The second question looks into the distribution of the three different types of holiday movies over the years, especially looking into the effect of average ratings on their movie production. We were interested in this question since we were curious about the different types of holidays each movie was created for and whether there were any changes in the trends over the years. We plan to answer the question by utilizing variables, ‘christmas’, ‘hanukkah’, ‘kwanzaa’, ‘year’, and ‘average_rating’.
Approach
To explore our question, we plan to utilize both a line plot and a bar plot. The line plot will illustrate the evolution of each movie type over the years, allowing us to compare trends across different holiday’s movies easily. Its continuous nature will enable viewers to track changes over time effortlessly. On the other hand, the bar plot will focus on depicting the average rating per holiday for each holiday’s movies. This visualization will facilitate a straightforward comparison, highlighting which holiday’s movies are rated highest and which are rated lowest. Together, these plots will provide a comprehensive overview, combining temporal trends with evaluative data to enhance our understanding.
Analysis
library(tidyverse)
library(ggplot2)
library(gridExtra)
Attaching package: 'gridExtra'The following object is masked from 'package:dplyr':
combineholiday_movies_line <- holiday_movies %>%
mutate(across(c(christmas, hanukkah, kwanzaa), as.numeric)) %>%
group_by(year) %>%
summarise(
christmas_movies = sum(christmas),
hanukkah_movies = sum(hanukkah),
kwanzaa_movies = sum(kwanzaa)
) %>%
pivot_longer(cols = ends_with("_movies"), names_to = "holiday", values_to = "num_movies", names_prefix = "")
line_plot <- ggplot(holiday_movies_line, aes(x = year, y = num_movies, color = holiday)) +
geom_line() +
labs(
title = "Holiday Movie Distribution Over Years",
x = "Year", y = "Number of Movies",
color = "Holiday"
) +
theme_minimal() +
theme(
plot.title = element_text(face = "bold", hjust = 0.5),
plot.title.position = "plot",
legend.position = "bottom"
)
holiday_movies_bar <- holiday_movies %>%
pivot_longer(cols = c(christmas, hanukkah, kwanzaa), names_to = "holiday_type", values_to = "is_holiday") %>%
filter(is_holiday) %>%
group_by(holiday_type) %>%
summarise(average_rating = mean(average_rating, na.rm = TRUE))
bar_plot <- ggplot(holiday_movies_bar, aes(x = holiday_type, y = average_rating, fill = holiday_type)) +
geom_bar(stat = "identity") +
labs(
title = "Average Ratings",
x = "Holiday", y = "Average Rating",
fill = "Holiday") +
theme_minimal() +
scale_fill_brewer(palette = "Set1") +
theme(
axis.text.x = element_text(angle = 45, hjust = 1, size = rel(0.9)),
plot.title = element_text(face = "bold", hjust = 0.5),
plot.title.position = "plot",
legend.position = ""
)
grid.arrange(line_plot, bar_plot, ncol = 2, widths = c(5, 2))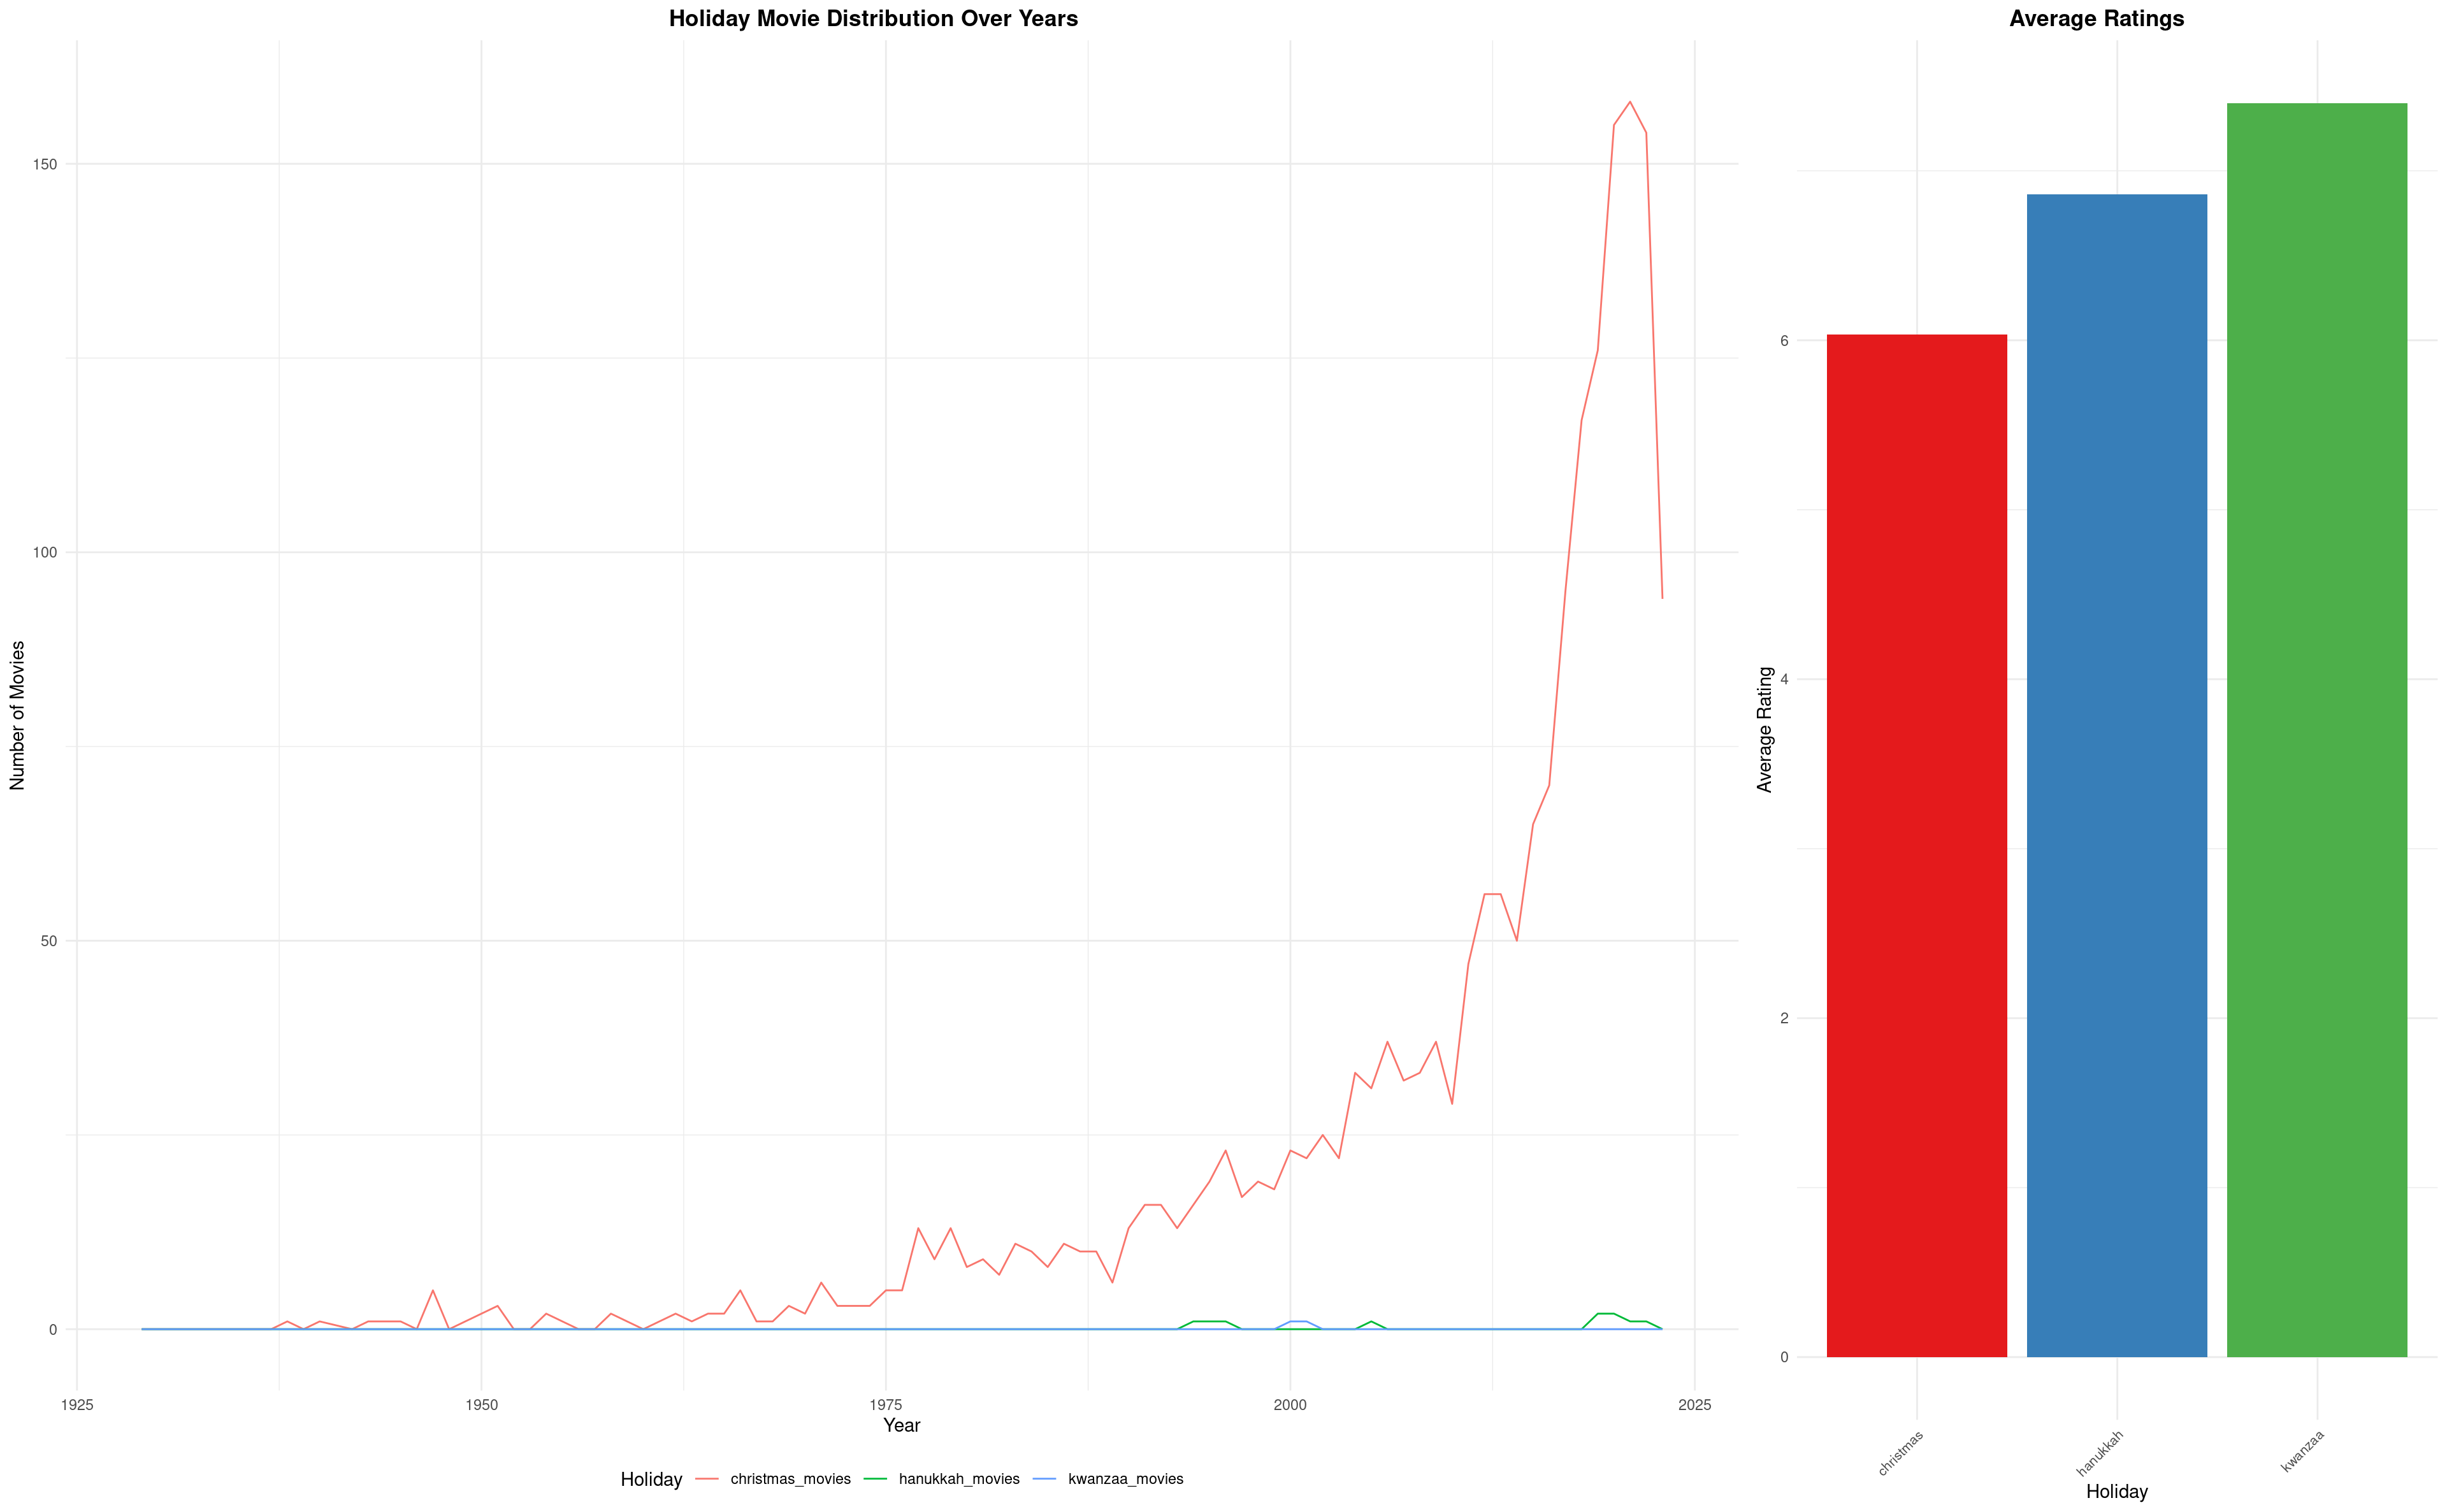
Discussion
The line plot titled “Holiday Movie Distribution Over Years” shows a significant increase in the number of Christmas movies produced over time, with a particularly sharp rise in recent years. Hanukkah and Kwanzaa movies, on the other hand, remain relatively scarce throughout the years, indicating a stronger cultural or commercial emphasis on Christmas-themed content in the film industry.
Moving to the bar plot “Average Ratings,” it is apparent that Kwanzaa movies hold the highest average rating, followed closely by Hanukkah and then Christmas movies. This suggests that while Christmas movies are more abundant, Kwanzaa films, though fewer in number, tend to receive higher ratings on average. This could imply a quality-over-quantity scenario where the lesser-produced holiday movies receive more favorable reviews, or it might reflect a niche audience’s rating behavior for these genres.
Presentation
Our presentation can be found here.
Data
Harmon, J. (2023). rfordatascience/tidytuesday. GitHub. https://github.com/rfordatascience/tidytuesday/blob/master/data/2023/2023-12-12/readme.md [Retrieved on Feb 29th, 2024]
References
Harmon, J. (2023). rfordatascience/tidytuesday. GitHub. https://github.com/rfordatascience/tidytuesday/blob/master/data/2023/2023-12-12/readme.md [Retrieved on Feb 29th, 2024]