1000 Coffee for 1000 Coffee Lovers
Coffee Taste Test - demographic coffee preference analysis
2025-03-06
Dataset Overview
The Great American Coffee Taste Test dataset was collected in October 2023. It contains demographic and coffee preference data from survey participants. We explore how age and employment status affect coffee preferences.
Why This Matters: Coffee is an essential part of daily life, but preferences vary widely. Younger people may prefer sweeter drinks, while older people may favor traditional coffee. Employment status may influence coffee consumption: Full-time workers might prefer stronger, high-caffeine coffee. Students and retirees might have different consumption patterns.
Research Question
How Do Coffee Preferences Vary by Age & Employment Status?
We explore favorite coffee types by age and coffee traits by employment status.
Key Variables Used:
Age & Employment Status
Favorite Coffee Type
Strength, Roast Level, and Caffeine Preference
Approach
Visualization Choices:
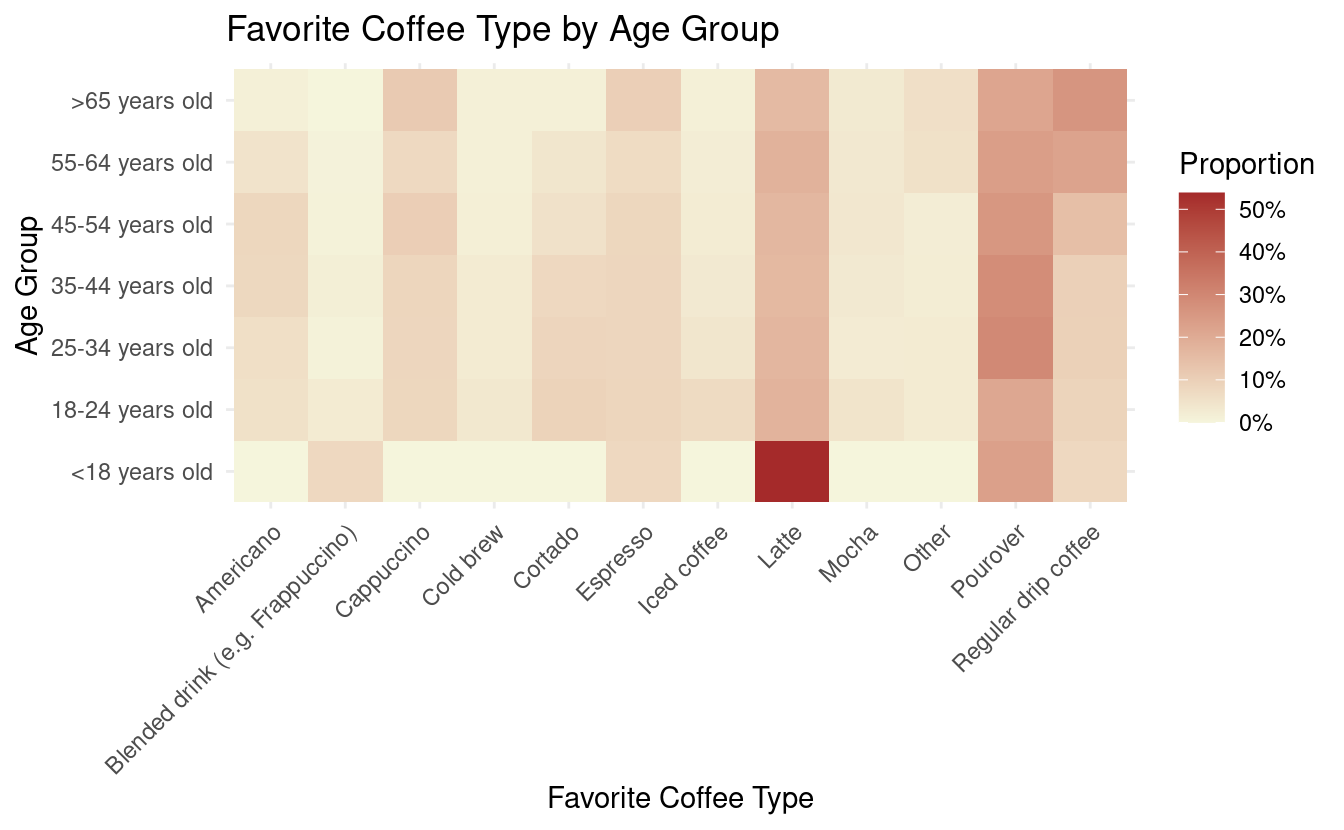
Heatmap:
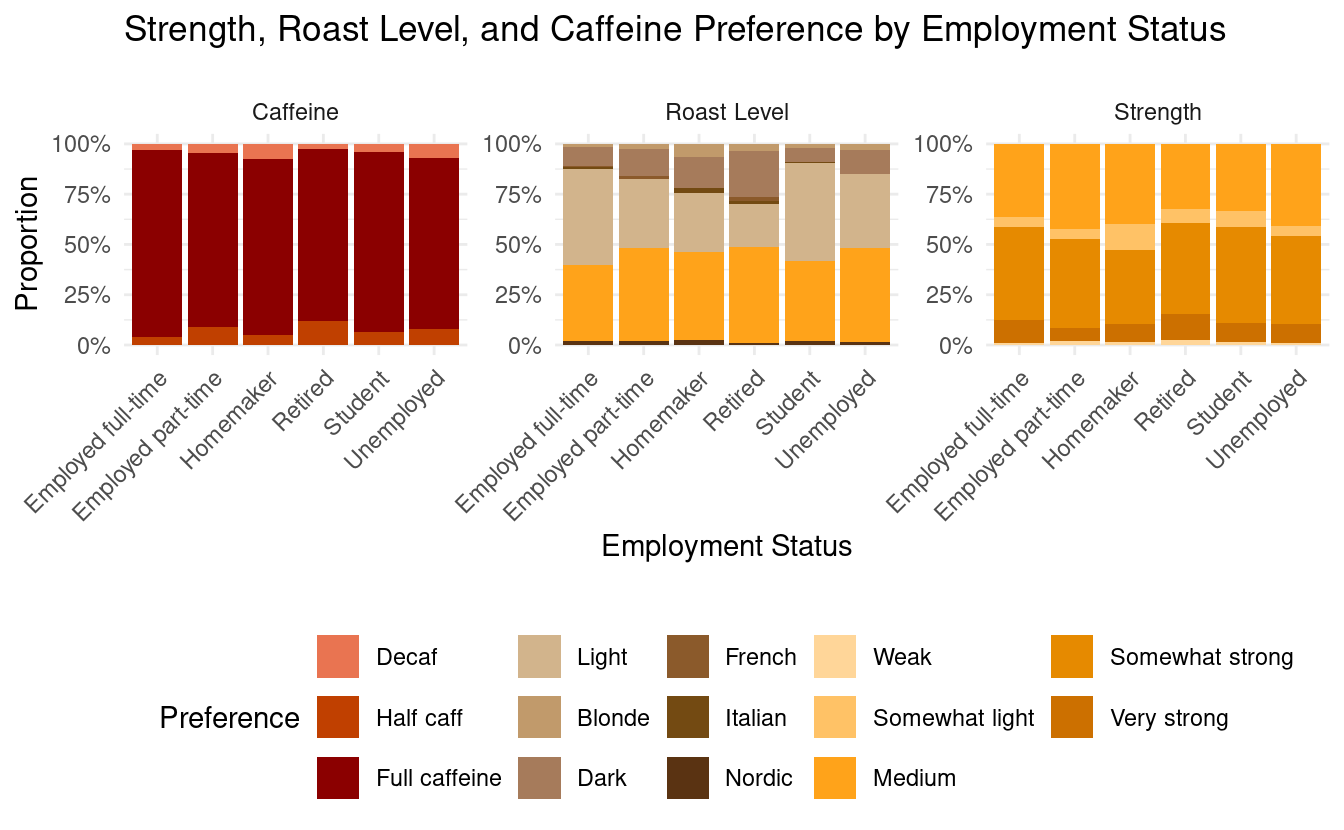
Displays favorite coffee type by age group using proportional comparisons.Stacked Bar Chart:
Shows strength, roast level, and caffeine preference by employment status.
Why These Plots?
Heatmaps help compare proportions within each group.
Stacked bar charts effectively display relative differences across groups.
Q1 Figure 1
Q1 Figure 2
Discussion
Younger respondents (<18 years old) strongly prefer sweet, milk-based drinks (e.g., lattes).
Older age groups (>65 years old) tend to favor traditional black coffee or espresso.
18-34-year-olds show the most variety, enjoying cold brew, cappuccino, and iced coffee.
Students favor high-caffeine, lighter roasts.
Retirees and homemakers drink more decaf and darker roasts.
Full-time workers prefer medium/strong coffee and dark roasts.
Possible Explanations:
Generational marketing trends and economic shifts impact coffee consumption.
Younger people may be more influenced by social media trends in coffee culture.
Employment status affects coffee routine and necessity, which can also affect coffee preferences.
Conclusion
Age and employment status significantly influence coffee choices. Lifestyle and work schedules also play a major role in caffeine intake and roast preferences.
Key Insight:
Younger generations prefer flavored and specialty drinks, while older consumers stick to classic coffee styles.
Questions
- Do you think cultural trends influence coffee preferences more than work/lifestyle?
- How might these patterns shift in the future with new coffee innovations?
Research Question
How does employment modality affect coffee-based spending?
We explore how employment modality impacts the type/quality of coffee consumed along with the amount of money spent.
Key Variables Used:
wfh: Defines work modality (whether respondents primarily work from home or in-person).
total_spend: Captures the total amount spent on coffee monthly.
spent_equipment: Records spending on at-home coffee equipment over the past five years.
cups: Indicates the number of cups consumed per day, which is used to estimate the spending per cup (a derived variable, spend_cup, is calculated by dividing total_spend by the estimated monthly number of cups).
Approach
Visualization Approach for Q2
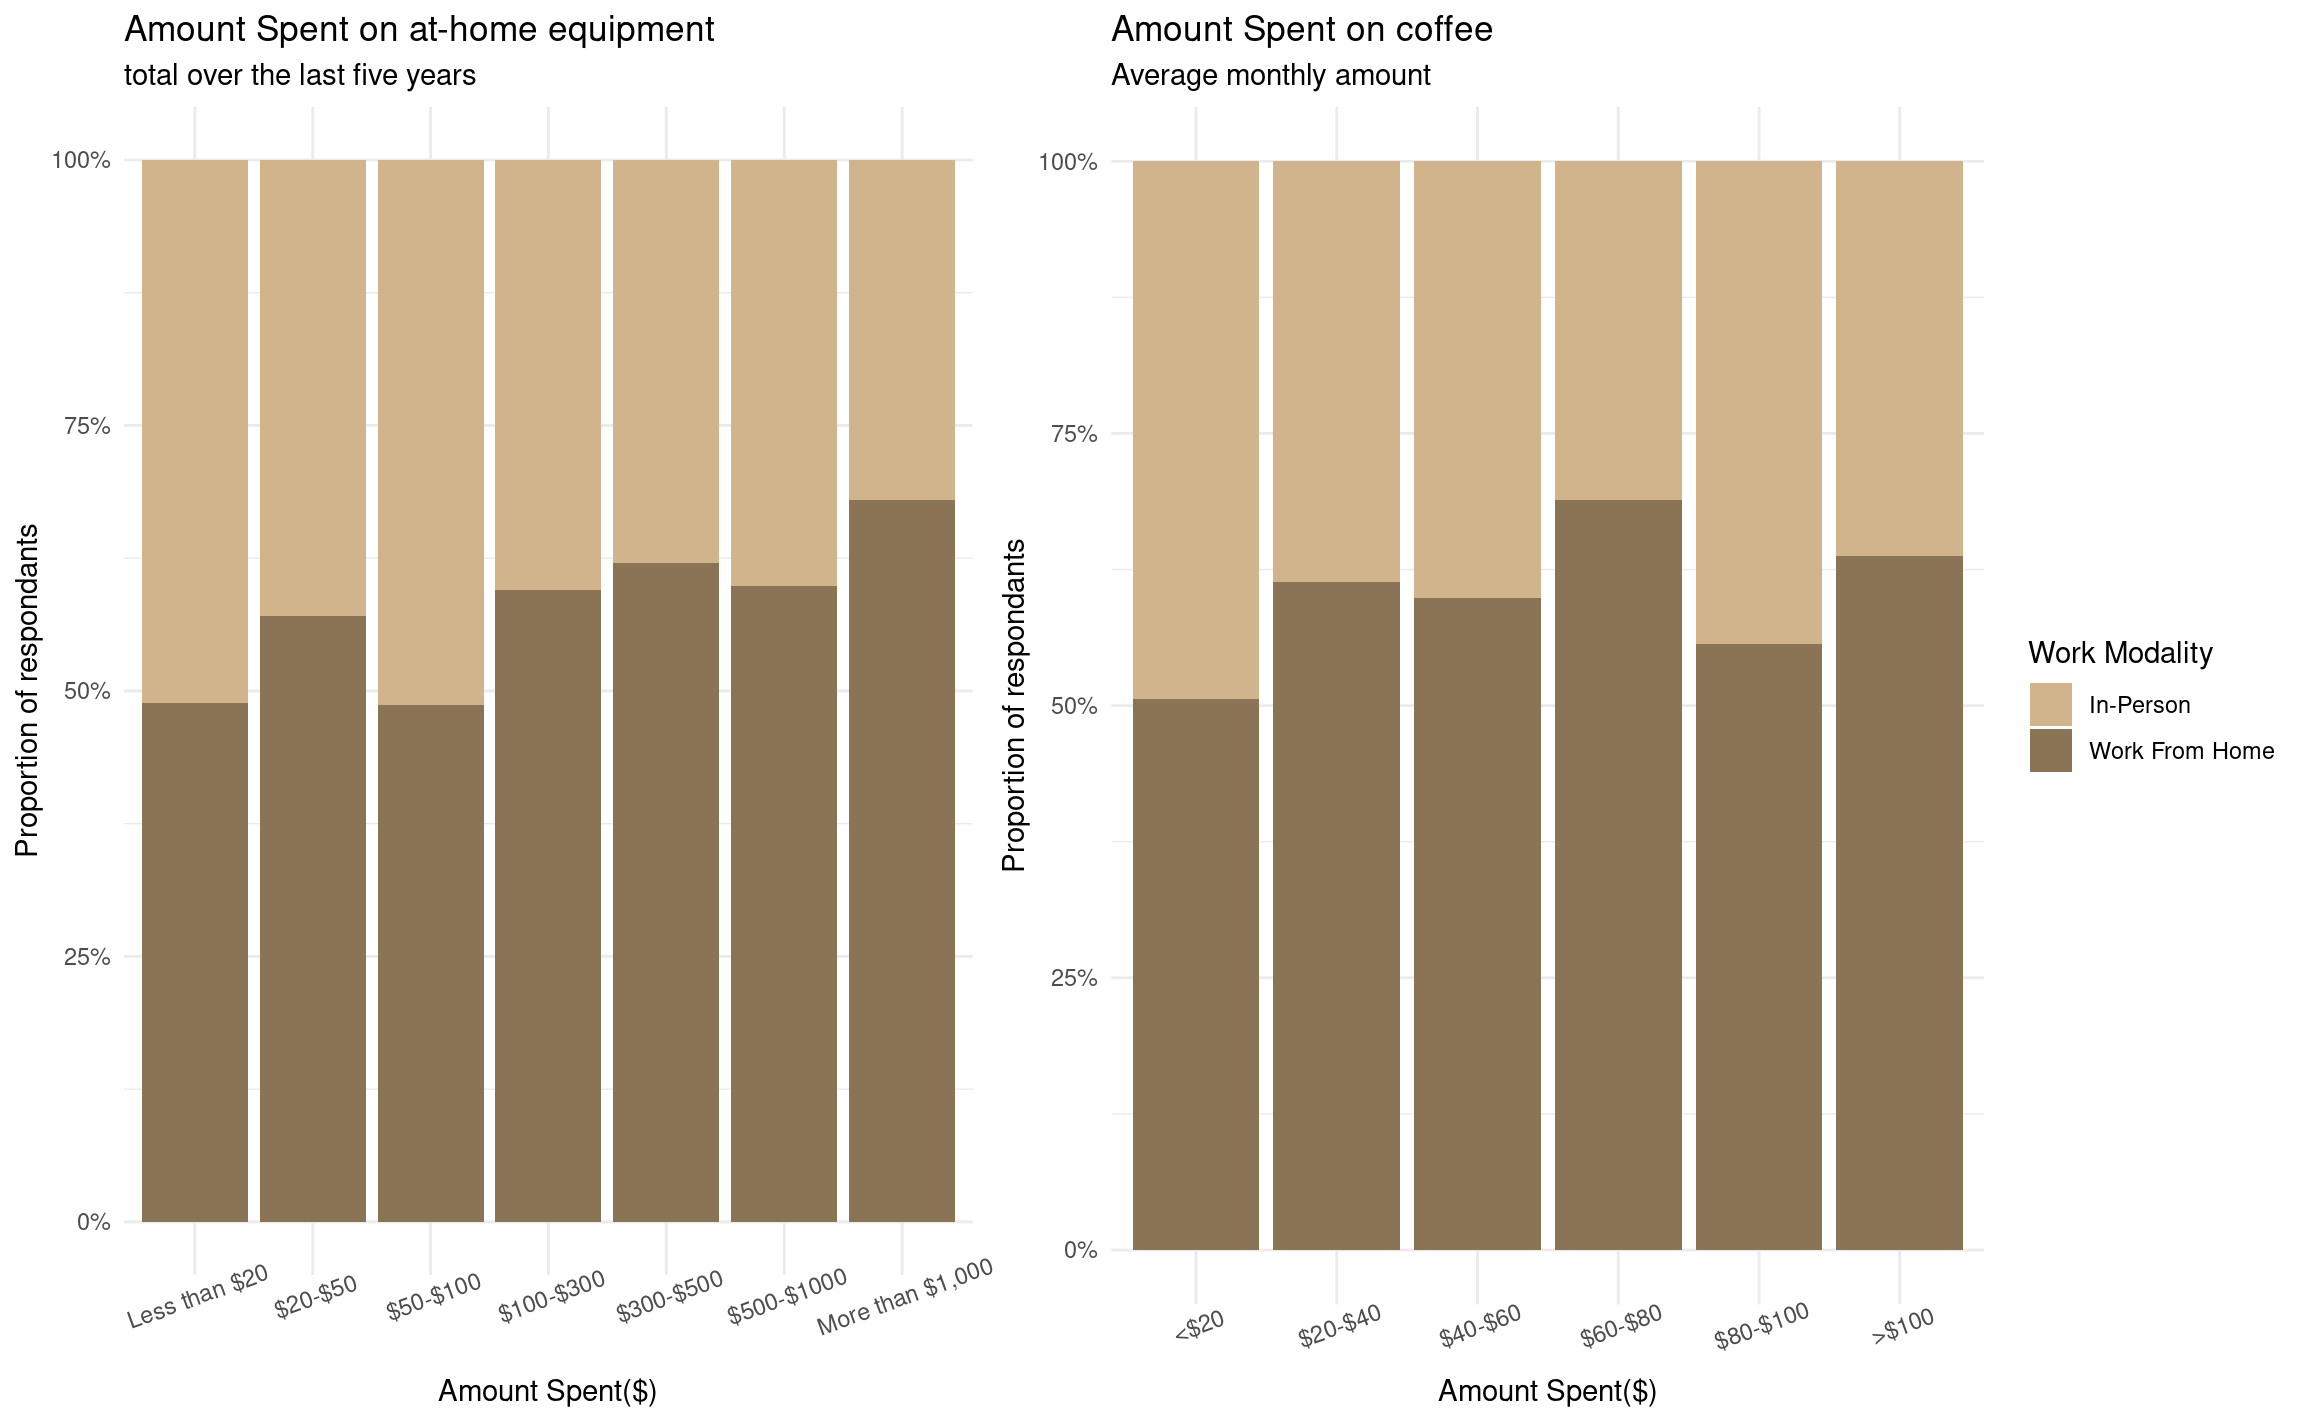
Filled Bar Charts:
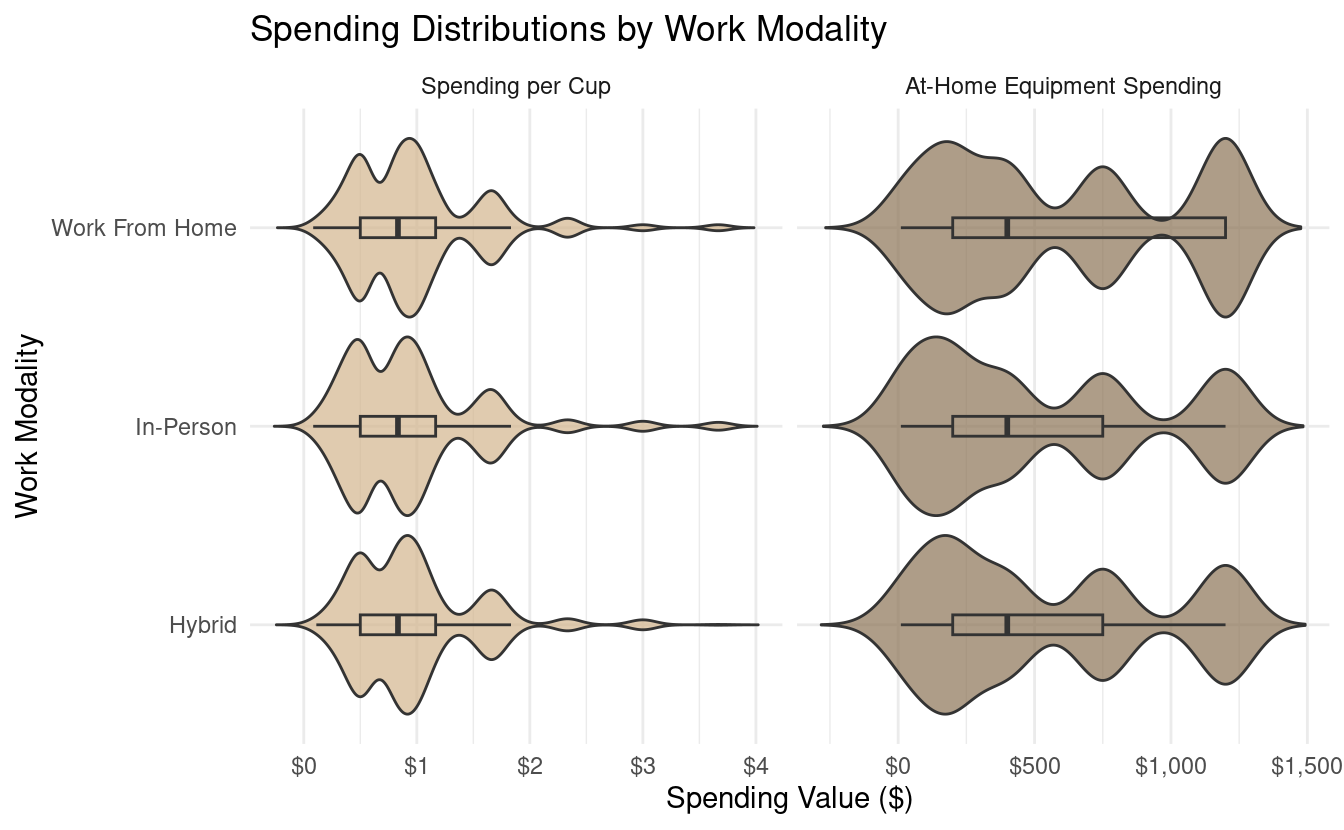
Display normalized proportions for both monthly coffee spending and at-home equipment costs across work modalities, controlling for sample size differences.Violin Plot:
Illustrates the distribution of spending per cup (derived from total_spend and cups) with mean indicators, to find trends between both remote and in-person workers.
Reason:
This approach allows us to clearly compare spending behaviors by work modality and uncover underlying distribution patterns that inform targeted marketing strategies.
Q2 Figure 1
Q2 Figure 2
Discussion
Spending Patterns:
Remote workers report higher investments in at-home coffee equipment and monthly coffee budgets.
Per-Cup Costs:
Slightly higher for remote workers, possibly due to premium beans or more frequent brewing.
Demographics:
A younger, full-time sample may amplify these trends, as they have more disposable income or stronger motivations to invest in coffee.
The violin plots illustrate that average spending per cup is marginally higher for those working from home, although the distribution overlaps considerably with the in-person group. Notably, home workers are more likely to spend large amounts ($1,000 - $1,500). This subtle difference could be attributed to remote workers’ preference for higher-quality coffee or the convenience of preparing multiple cups throughout the day. Importantly, these results should be viewed alongside our demographic summary, which indicates that our survey sample skews younger and includes a relatively high proportion of full-time employees.
Conclusion
Key Insight:
Work modality correlates with distinct coffee spending behaviors.
Remote vs. In-Person:
Remote workers spend more on both equipment and coffee per cup, while in-person workers may rely on office coffee.
Implications:
Marketers and equipment manufacturers can tailor products to each group’s specific needs, keeping in mind our slightly younger, full-time sample.
Overall, our analysis shows that work modality is associated with distinct spending behaviors in the coffee market. Remote workers are more inclined to invest in home-brewing equipment and to spend slightly more on coffee per cup. The demographic context suggests that these findings may be influenced by a sample that is somewhat younger and more likely to be employed full-time than the general U.S. population. Future research might explore additional factors—such as income, household size, or geographic location—to gain an even clearer picture of what drives coffee-related spending.
Questions
- How do other demographic factors (e.g., income, education) shape coffee spending?
- What impact might urban vs. rural location have on coffee consumption habits?
- Are there seasonal spending patterns (e.g., summer cold brews vs. winter lattes)?
- Does brand loyalty play a role in the difference between remote and in-person coffee spending?