The Evolution of Female Representation and Country Success in Olympic Sports
Breaking Barriers Over Time
Dank Clapback
Arya, Dylan, Jolene, and Rachel
2025-03-06
Objective 1
To evaluate the evolution of gender representation in the Olympics over Time by answering:
How has the representation of male and female athletes in various olympic sports changed over time, specifically what factors and key milestones have influenced shifts in gender diversity across different sports and events?
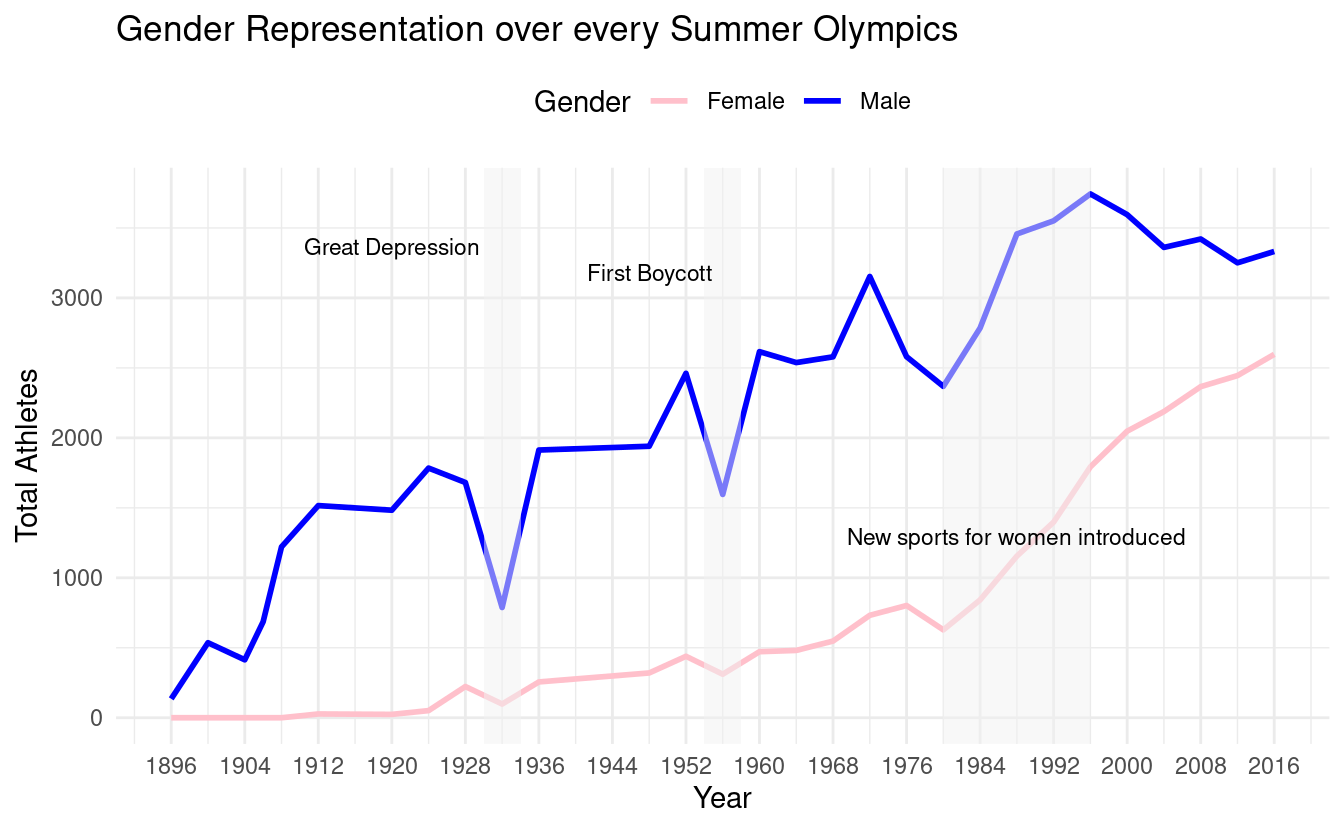
Gender Representation Over Time
Key Takeaways:
-
Male representation has always been higher
-
Women started participating in the late 1920s
-
1984: Major jump in participation, driven by global movements for women’s rights and Title IX in the U.S.
-
2012: First time every participating country included female athletes
Insight:
Despite progress, representation disparities remain across different sports.
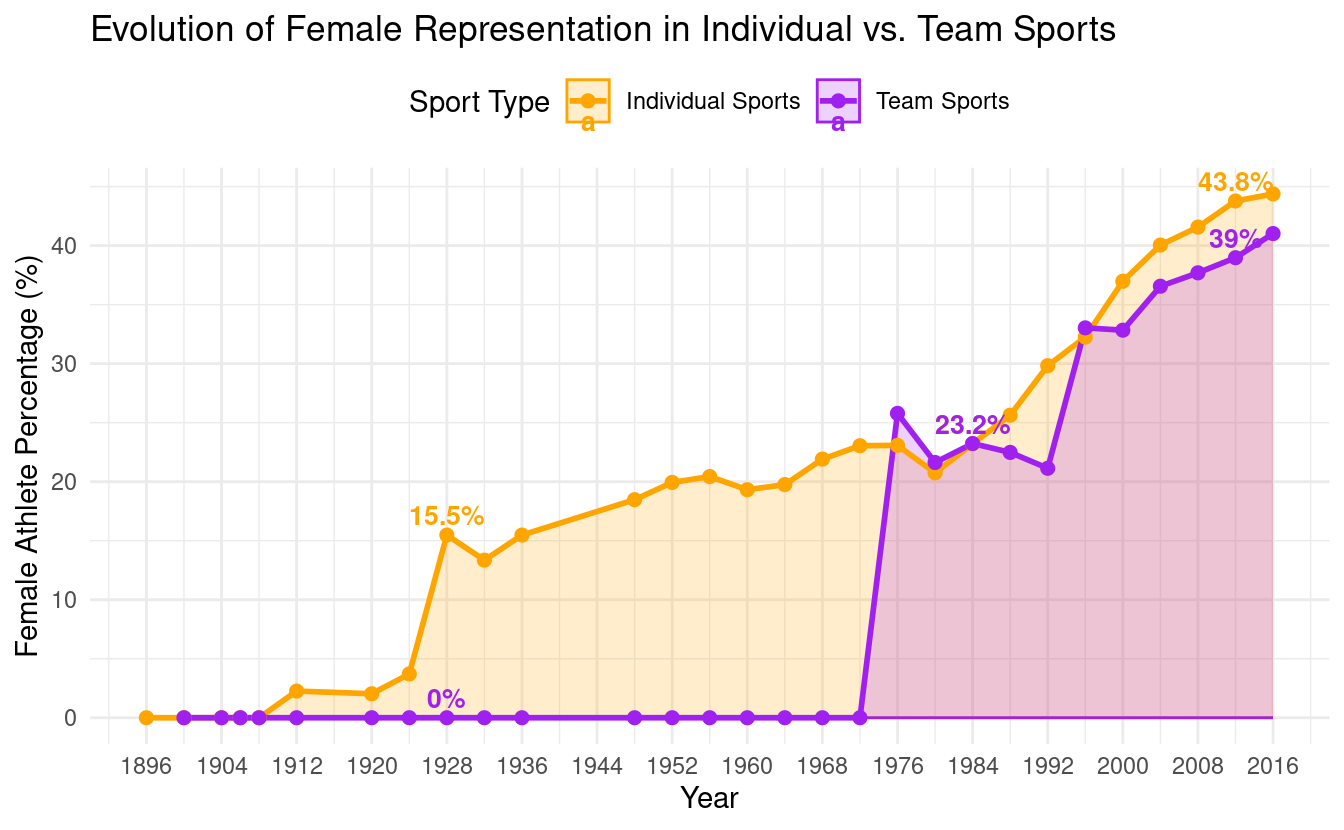
Female Representation in Individual vs Team Sports
Key Takeaways:
-
Early 1900s: Women competed mostly in individual sports like Swimming and Athletics
-
Team sports faced greater resistance due to societal norms around physicality
-
1980s-1990s: Increased female inclusion in team sports, especially with the addition of Women’s Football & Wrestling
-
2012-2016: Female participation in team sports approaches parity in some events
Insight:
The shift in team sports inclusion highlights the role of policy changes
Conclusion: Future Challenges and Opportunities
Continued efforts needed for full gender parity in all Olympic events.
Focus on equal funding, visibility, and access for female athletes in traditionally male-dominated sports.
Objective 2
To understand the relationship between a country’s medal efficiency and economic success by answering:
Does a country’s economic wealth (GDP per capita) influence its Olympic medal efficiency (percentage of athletes who win medals)?
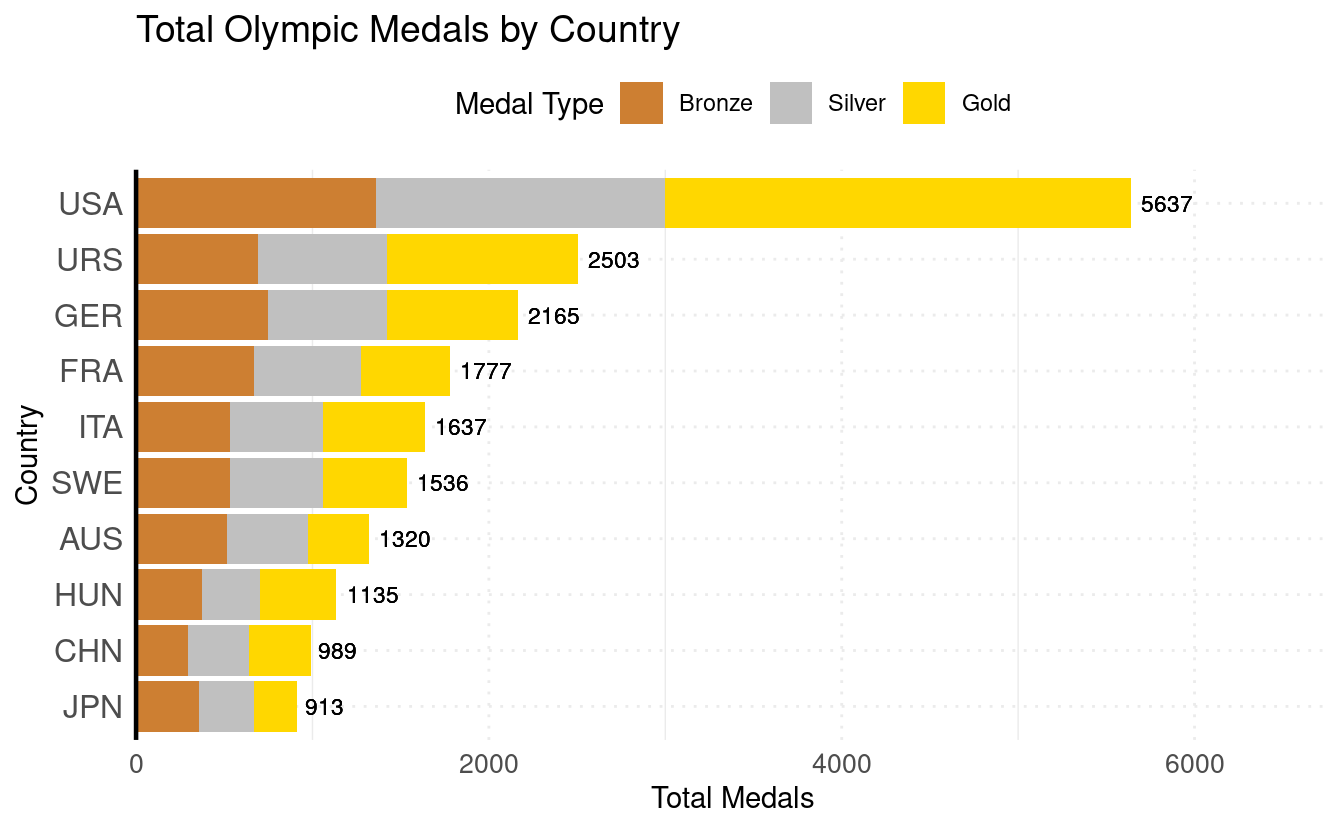
Total Olympic Medals by Country
Key Takeaways:
-
The United States has by far the most total medals and gold medals
-
The USR ranks second despite only competing from 1952-1988
-
European countries (GER, FRA, ITA, SWE) excel with a balanced medal distribution.
-
Despite joining in the 1980s, China has more golds than Australia, despite AUS’s higher total medals.
Insight:
The graph visualizes global Olympic dominance through each nation’s historical medal success
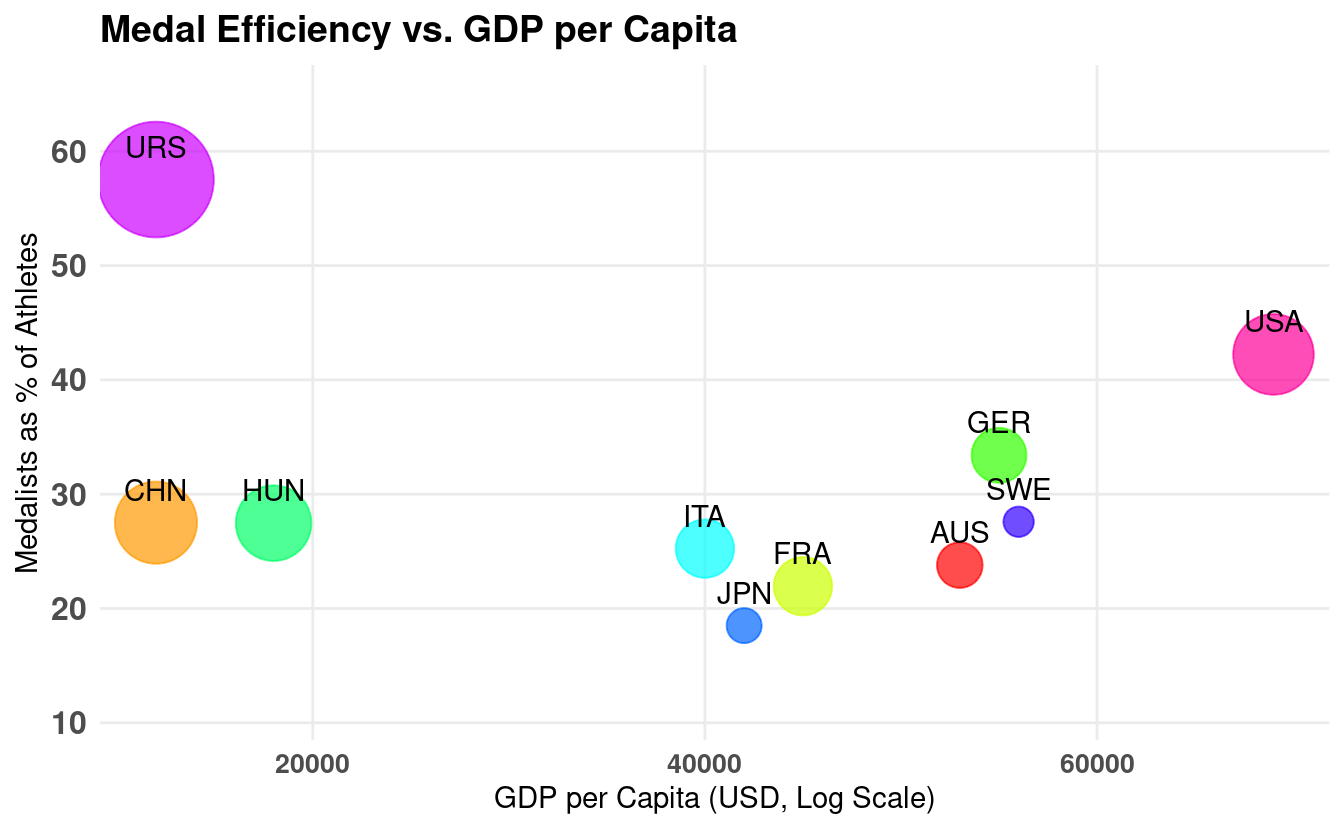
Comparing Medal Efficiency and GDP per Capita
Key Takeaways:
-
Parabolic trend between GDP per capita and medal efficient rate
-
Upward trend between the two factors when looking exclusively at first world countries
-
Early government sports programs and key financial incentives play a key role in Olympic success
-
Medals per capita help to contextualize the prior graph
Insight:
A variety of factors influence a country’s success in the Olympics
Conclusion: Takeaways and Future Opportunities
Countries with greater resources (GDP) tend to perform well in considering the absolute number of medals, but efficiency (medals per athlete) varies widely.
Economic power isn’t the only determinant of Olympic success—state investment in sports and training can lead to impressive results.