Climate Emissions Analysis

Investigating Major Polluters and Emission Trends

Dominick Chatas, Nate Wade, Maureen Kaminja, Naomi Hernandez

2025-03-06

Introduction

Background

  • Climate change is an urgent global issue.
  • Fossil fuel combustion and cement production are major contributors to greenhouse gases.
  • The Carbon Majors database tracks emissions from the world’s largest oil, gas, coal, and cement producers.
  • This study explores historical trends in total operational emissions and key contributors.

Dataset Overview

Key Information

  • Source: Climate Accountability Institute (CAI)
  • Scope:
    • Covers investor-owned, state-owned, and national entities.
    • Tracks emissions from 1854 onward.
    • Over 1.42 trillion tonnes of CO₂ equivalent emissions recorded.
  • Structure:
    • 10 numerical fields (e.g., production value, emissions types).
    • 2 categorical fields (production unit, source).
  • Significance: Understanding corporate responsibility in global emissions.

Research Questions

Question 1

How have total operational emissions evolved over time for major producer groups?

  • Examine top emitters and their historical emission trends.
  • Identify dominant contributors to global emissions.

Question 2

Can total operational emissions be compared to production levels?

  • Analyze emissions per production unit.
  • Compare emission intensity between key polluters and other entities.

Hypotheses

  • The largest polluters have historically contributed a disproportionately high share of emissions.
  • Emission trends have increased with industrialization, and key entities have not effectively reduced operational emissions despite technological advancements.
  • Production levels may not directly correlate with emissions due to variations in efficiency and practices such as flaring and venting.

Data Setup

The following package(s) will be installed:
- patchwork [1.3.0]
These packages will be installed into "~/proj-01-dank-stan/renv/library/linux-ubuntu-focal/R-4.4/x86_64-pc-linux-gnu".

# Installing packages --------------------------------------------------------
- Installing patchwork ...                      OK [linked from cache]
Successfully installed 1 package in 14 milliseconds.
The following package(s) will be installed:
- ggtext [0.1.2]
These packages will be installed into "~/proj-01-dank-stan/renv/library/linux-ubuntu-focal/R-4.4/x86_64-pc-linux-gnu".

# Installing packages --------------------------------------------------------
- Installing ggtext ...                         OK [linked from cache]
Successfully installed 1 package in 12 milliseconds.
Approach

  • Visualization 1: A line graph of cumulative emissions over time for the top five emitters.
  • Visualization 2: An area chart comparing top emitters to all other entities.

Visualization 1: Cumulative Operational Emissions Over Time

Visualization 2: Top Emitters vs. Other Entities

Interpretation

  • China (Coal), Gazprom, Saudi Aramco, Chevron, and ExxonMobil are the dominant emitters.
  • China’s emissions have surged since the 1990s, surpassing Gazprom.
  • These findings reinforce the need for targeted regulatory policies to mitigate emissions from the highest contributors.

Question 2: Emissions vs. Production

Approach

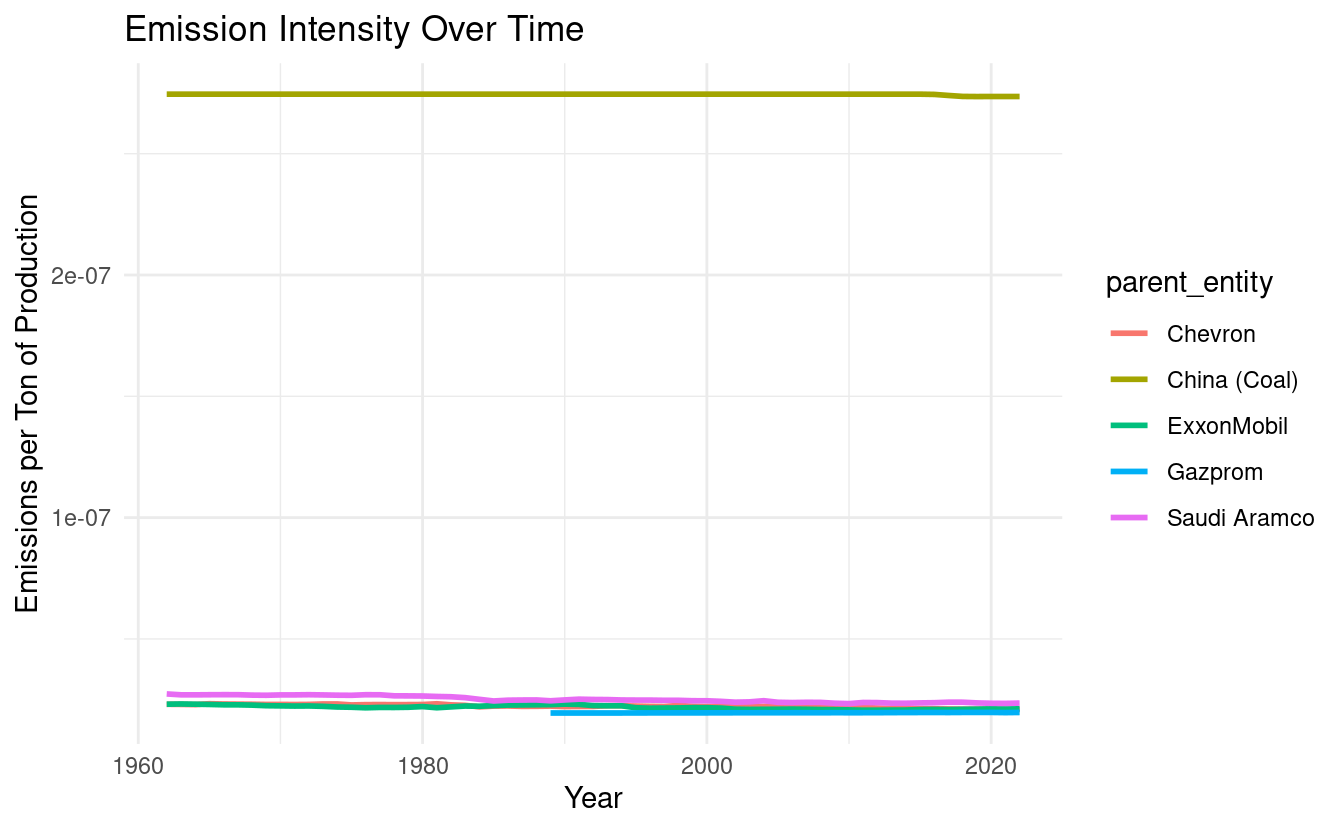
  • Visualization 3: Line graphs comparing cumulative operational emissions, production, and emission intensity.
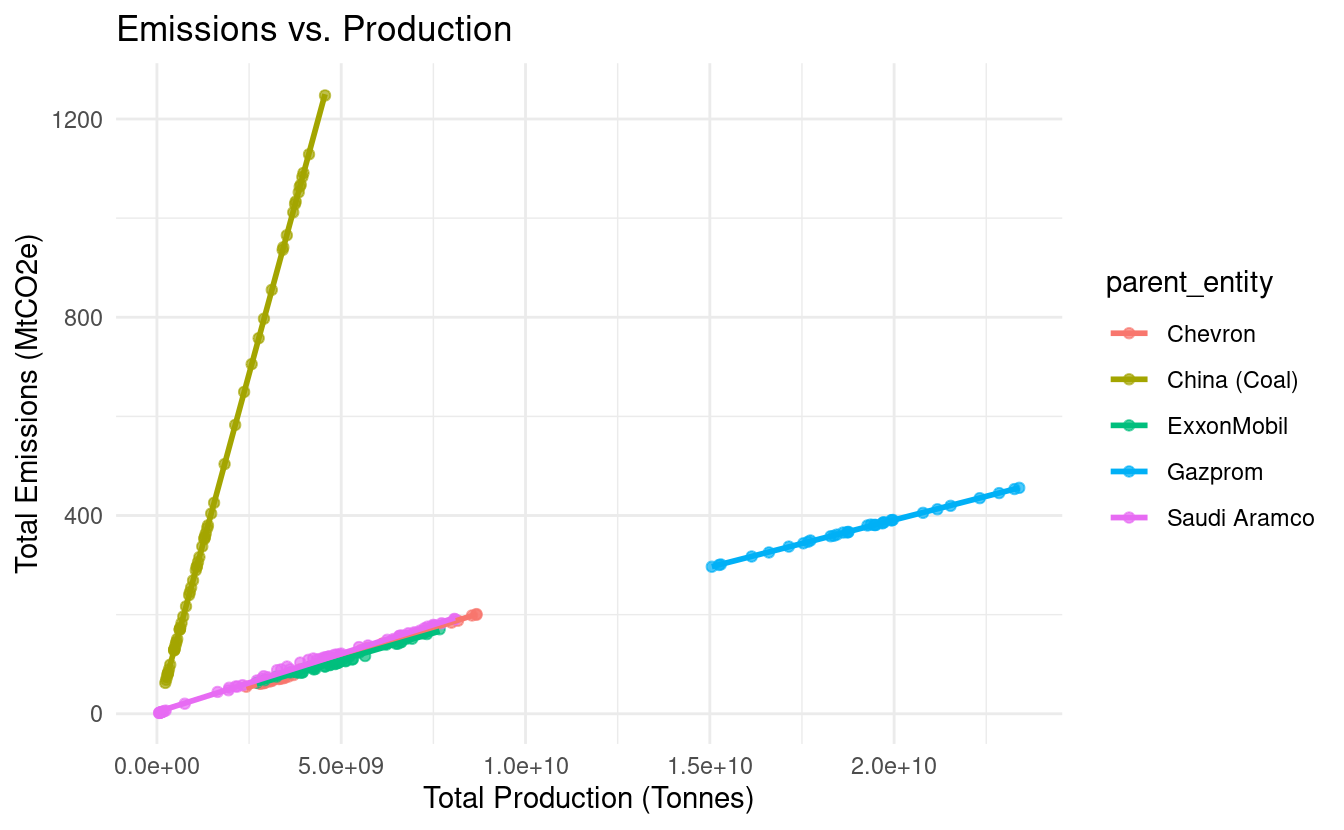
  • Visualization 4: A scatter plot comparing emissions-to-production ratios.

Visualization 3: Emission Intensity Over Time

Visualization 4: Scatter Plot of Emissions vs. Production

Interpretation

  • Emission intensity remains high for key polluters, suggesting inefficiencies or lack of emission mitigation strategies.
  • The scatter plot shows a strong correlation between production and emissions, reinforcing the notion that increased fossil fuel production directly contributes to climate impact.
  • Policies should focus not just on reducing production but also on improving efficiency and alternative technologies.

Discussion & Implications

  • Key polluters maintain high emission intensity, indicating inefficiencies or lack of mitigation strategies.
  • Production & emissions are strongly correlated, meaning that larger fossil fuel production directly results in higher emissions.
  • Regulatory focus should expand beyond production limits to improving efficiency and adopting cleaner technologies.
  • Policy interventions should target both reducing fossil fuel reliance and enhancing carbon reduction strategies for major emitters.

Policy Implications

  • Targeted regulations on flaring and venting could significantly reduce emissions.
  • Investments in cleaner technology can lower emissions intensity among top polluters.
  • Stricter corporate accountability is necessary to hold major polluters responsible.

Conclusion

  • Historical emissions trends reveal corporate responsibility in climate change.
  • Key polluters drive the majority of operational emissions.
  • Future Steps:
    • Encourage data-driven policy changes.
    • Promote alternative energy sources.
    • Enforce stricter emission regulations.

Thank you! Questions?