Brewing Demographics
Unpacking Coffee Trends Across Age, Employment, and Ethnicity
2025-03-02
Visualization 2
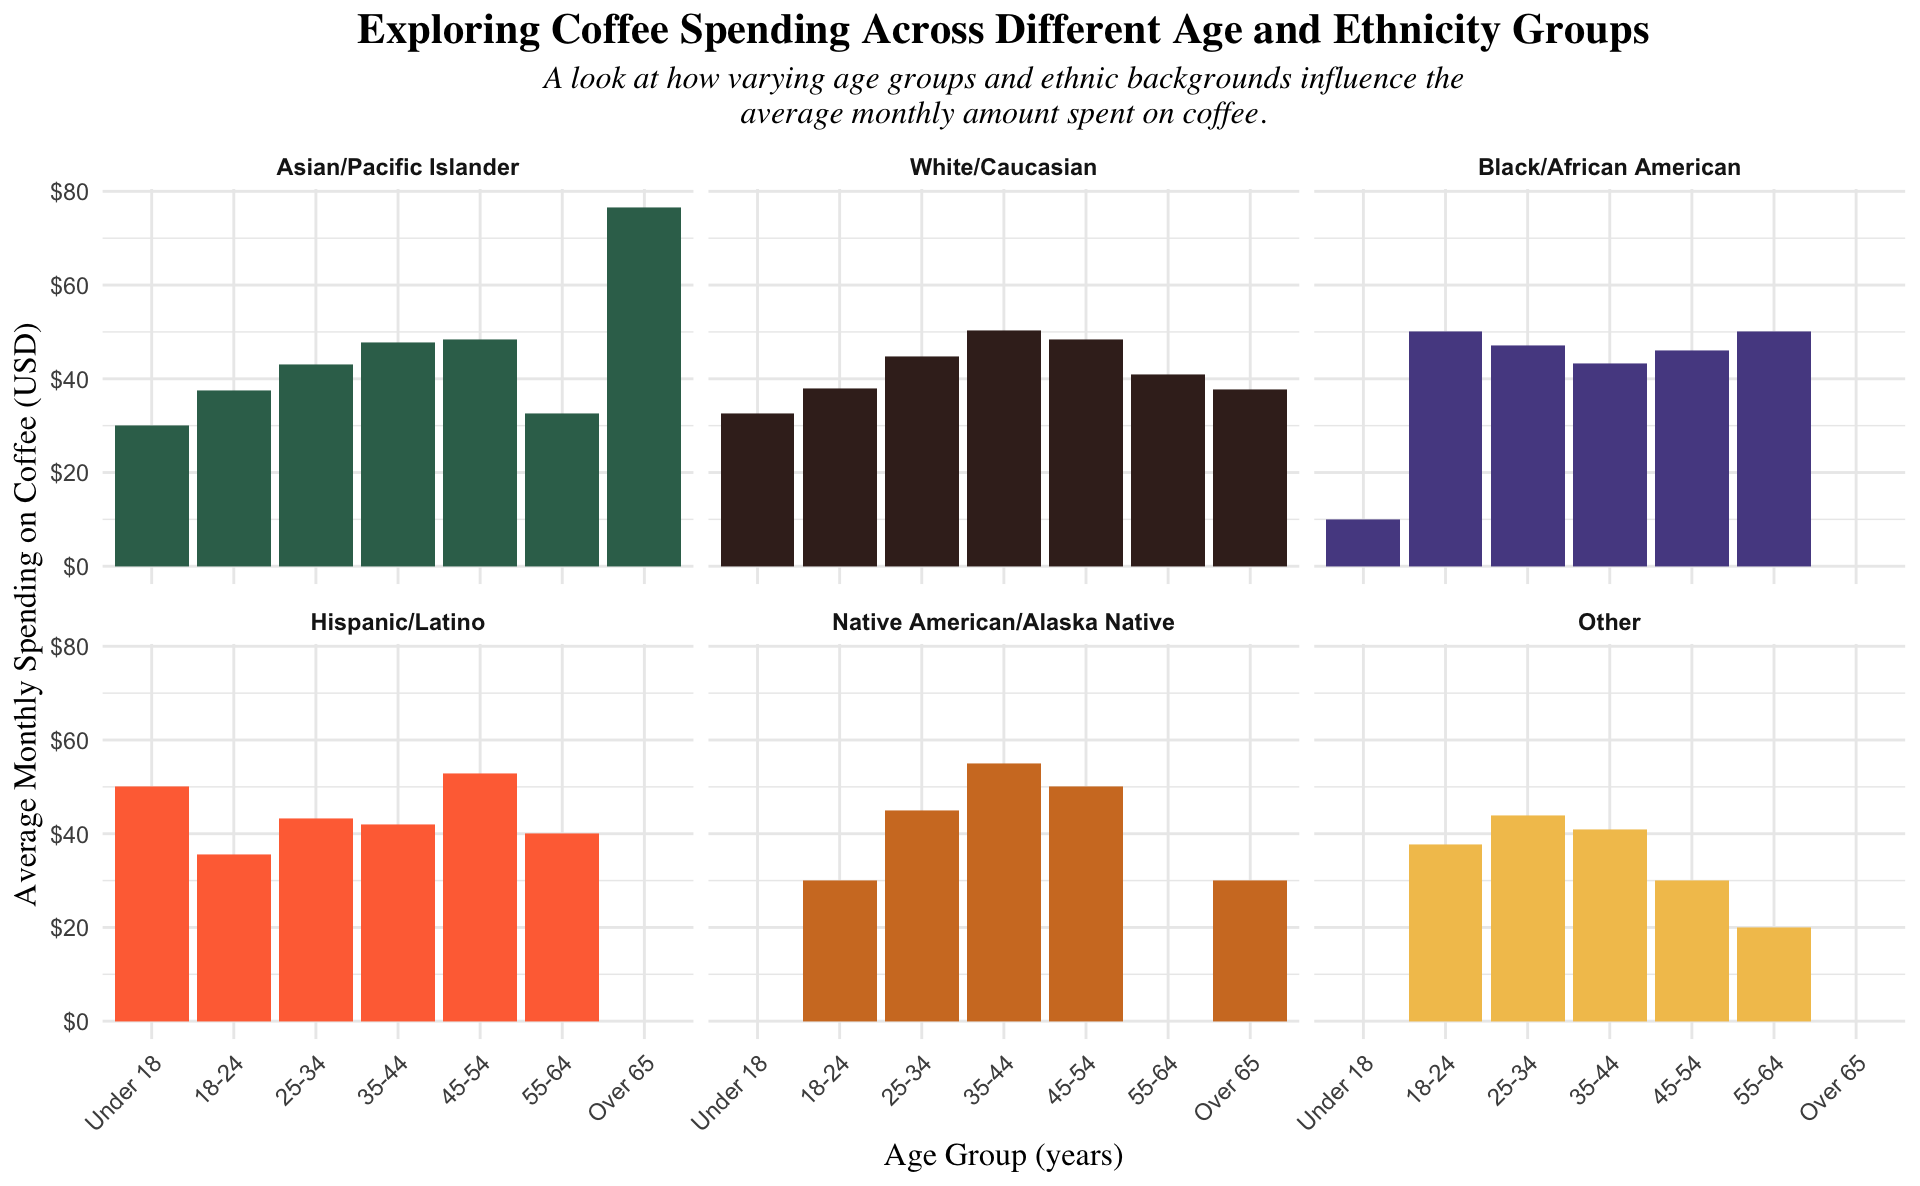
- Asian/Pacific Islanders → Spending increases after age 65
- Black/African Americans → Low Spending under 18
- White & Hispanic individuals → More stable spending patterns
- Bell curve shape generally - total monthly spending peaks around 25-44 years old
Visualization 1
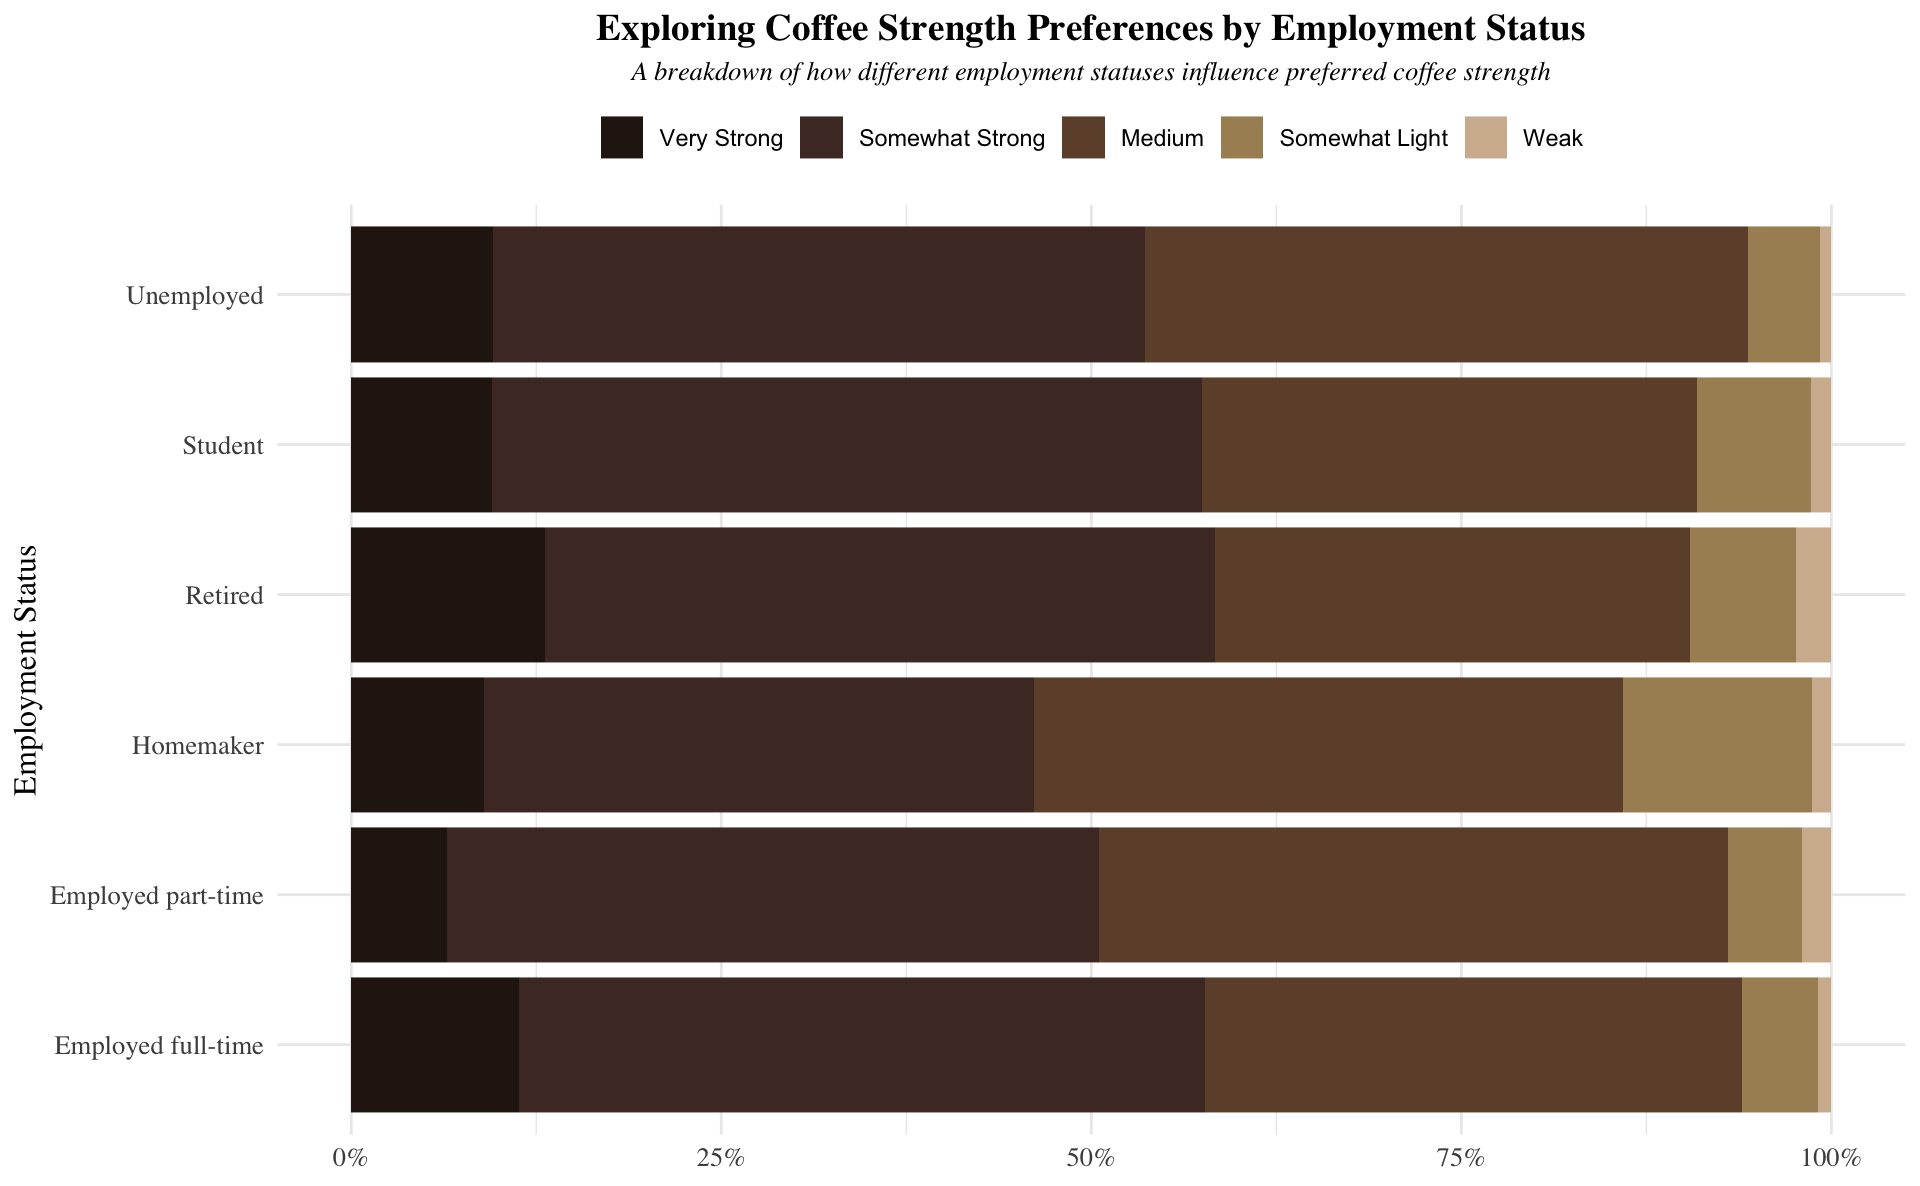
- Medium & Somewhat Strong coffee are most preferred
- Retired & full-time employees → Prefer stronger coffee
- Homemakers → Higher proportion of “Somewhat Light” coffee drinkers
Visualization 2
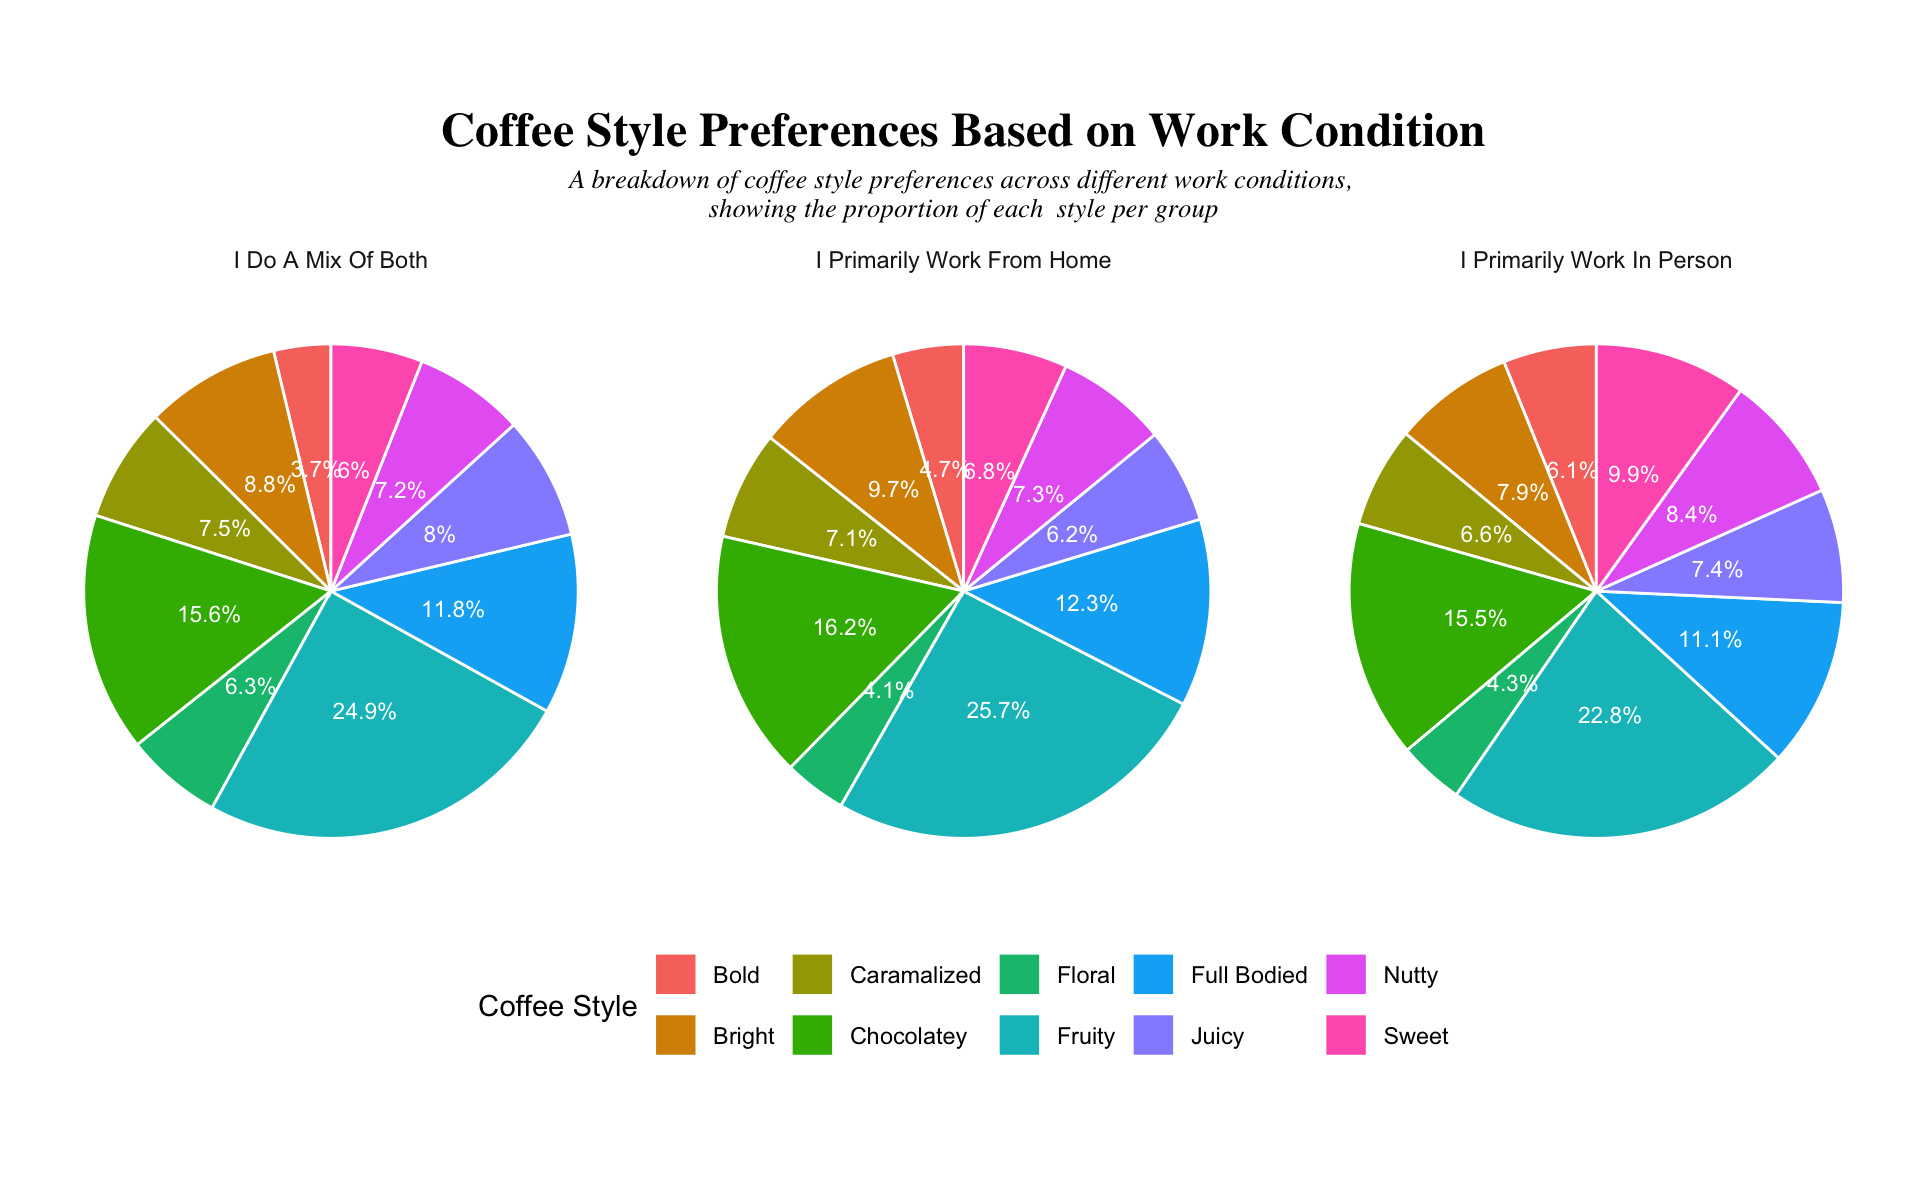
- Fruity coffee is most popular across all work conditions
- Remote workers → More likely to drink Chocolatey & Full-bodied coffee
- In-person workers → More balanced preferences across different styles