Trends of Netflix Movies and Shows
Proud Beaver
Katelyn Chang, Jeremy Cortez, Nitya Pakala
2026-03-05
Introduction - Netflix Engagement Reports
Netflix’s bi-annual Engagement Reports provide a public look at what subscribers are actually watching by reporting total hours viewed for thousands of titles across multiple reporting periods from 2023–2025. Unlike rankings or ratings, this dataset captures actual audience behavior.
How we use this dataset
- The dataset includes two tables, movies and shows, totaling over 15,000 title-period observations
- Each row represents a title’s performance during a specific reporting period.
- We focus on views, release_date, and available_globally to analyze engagement patterns.
- We create a content_type variable to combine movies and shows for analysis.
Question 1 Introduction
Question 1: Do movies or shows released in winter/summer get more views than those released in spring/fall?
Approach: We examine how release timing relates to Netflix viewership by grouping titles into seasons based on their release_date. Using the views variable as our engagement metric, we compare how average and overall distributions of views differ across seasons for both movies and shows.
Figure 1: Average views by release season (Spring, Summer, Fall, Winter) – Bar Chart
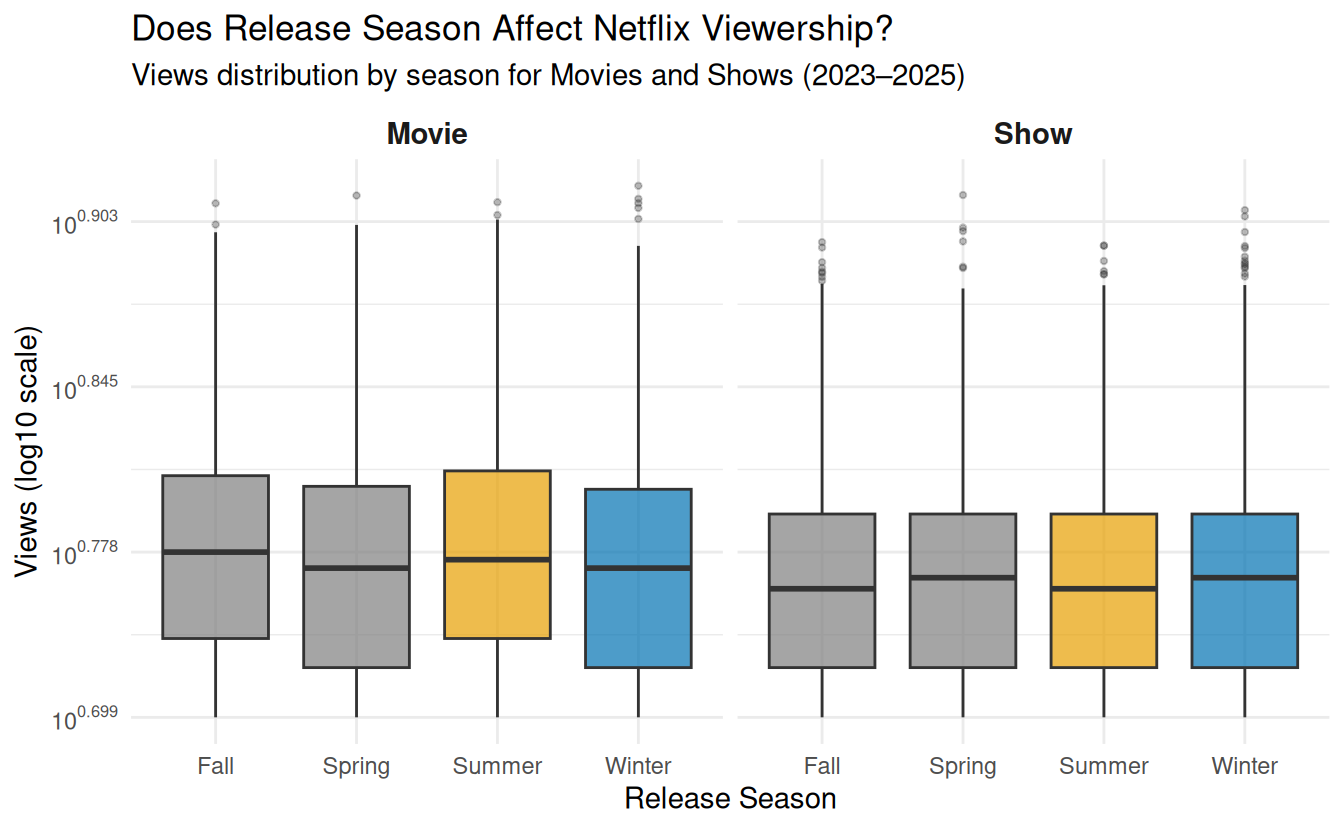
Figure 2: Distribution of views by release season, faceted by content type – Boxplot
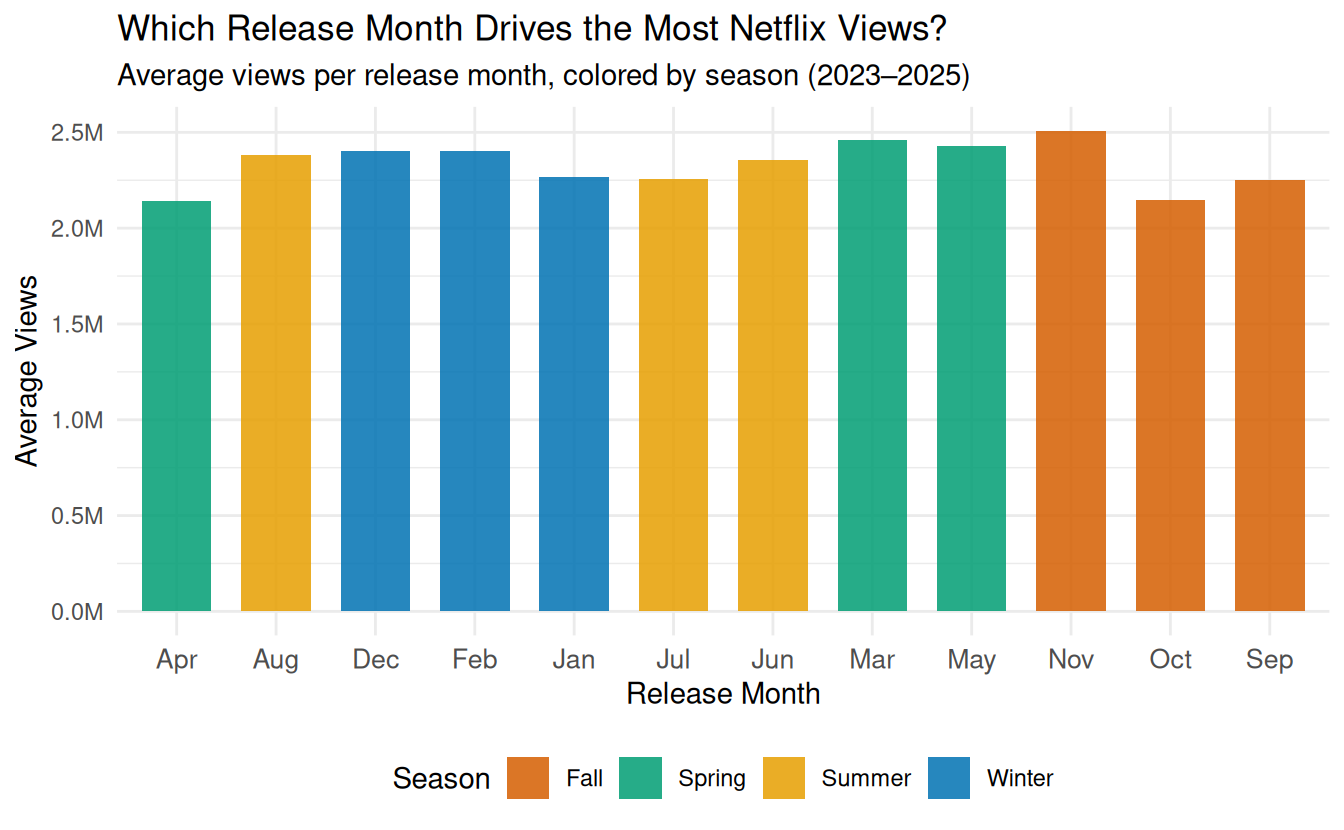
Which Release Month Drives the Most Views?
- Average views stay relatively consistent across all 12 months, ranging between 2.1M and 2.5M
- March and May also trend slightly higher, possibly reflecting spring break viewing patterns
- The narrow range across months suggests Netflix’s recommendation algorithm distributes viewership fairly evenly regardless of release timing
Does Release Season Affect Viewership?
- Summer and Winter show wider interquartile ranges compared to Spring and Fall, meaning those seasons produce both bigger hits and more underperforming titles
- Spring and Fall produce more consistently mid-range performers with fewer extreme highs and lows
- Movies and Shows follow nearly the same seasonal pattern across both panels, suggesting Netflix does not stagger its release strategy between content types
Question 2 Introduction
Question 2: Does globally available Netflix content receive more views than regionally restricted titles, and has this difference changed across reporting periods?
Approach: We compare viewership between titles that are available globally and those that are regionally restricted using the hours_viewed metric. By examining patterns across reporting periods, we evaluate whether global distribution is associated with consistently higher engagement for both movies and shows.
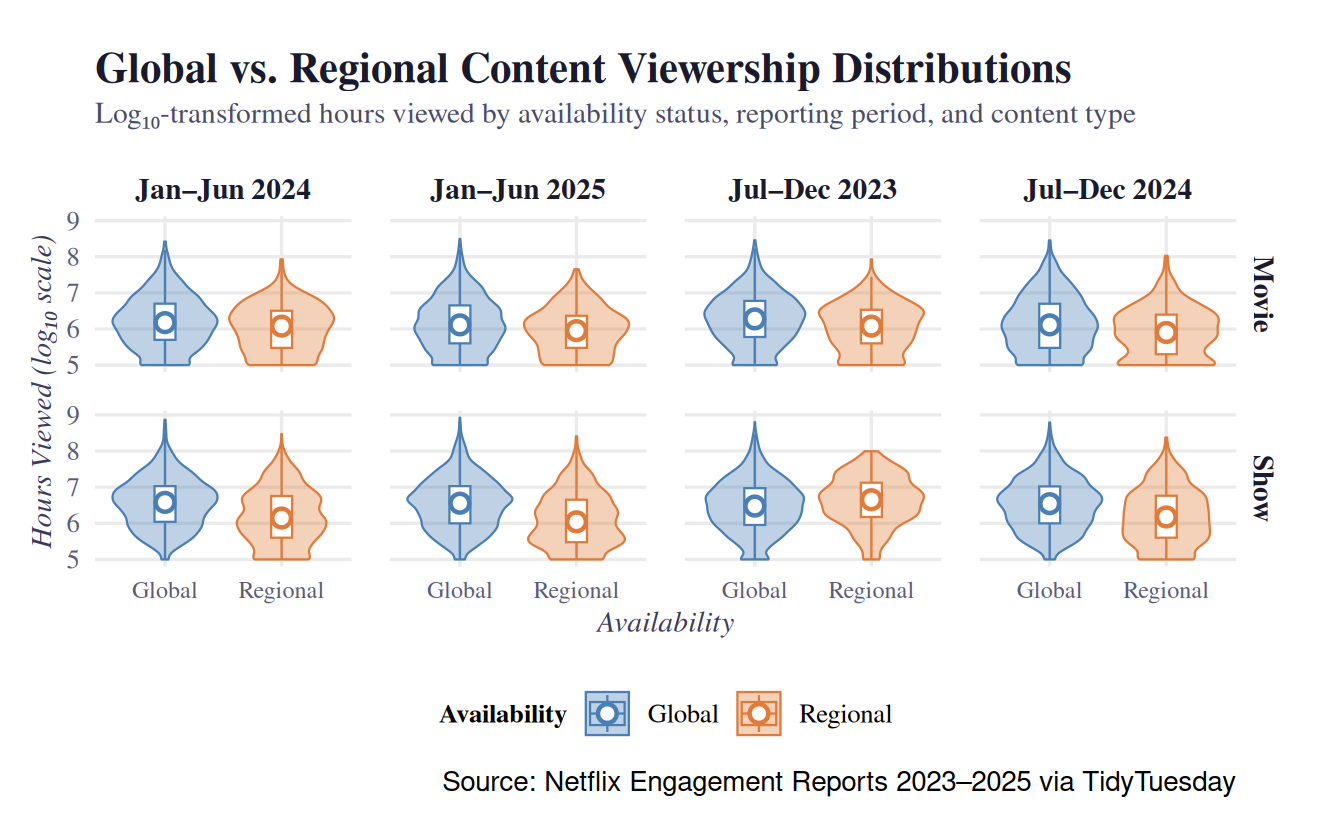
- Figure 1: Distribution of hours viewed by global availability – Boxplot
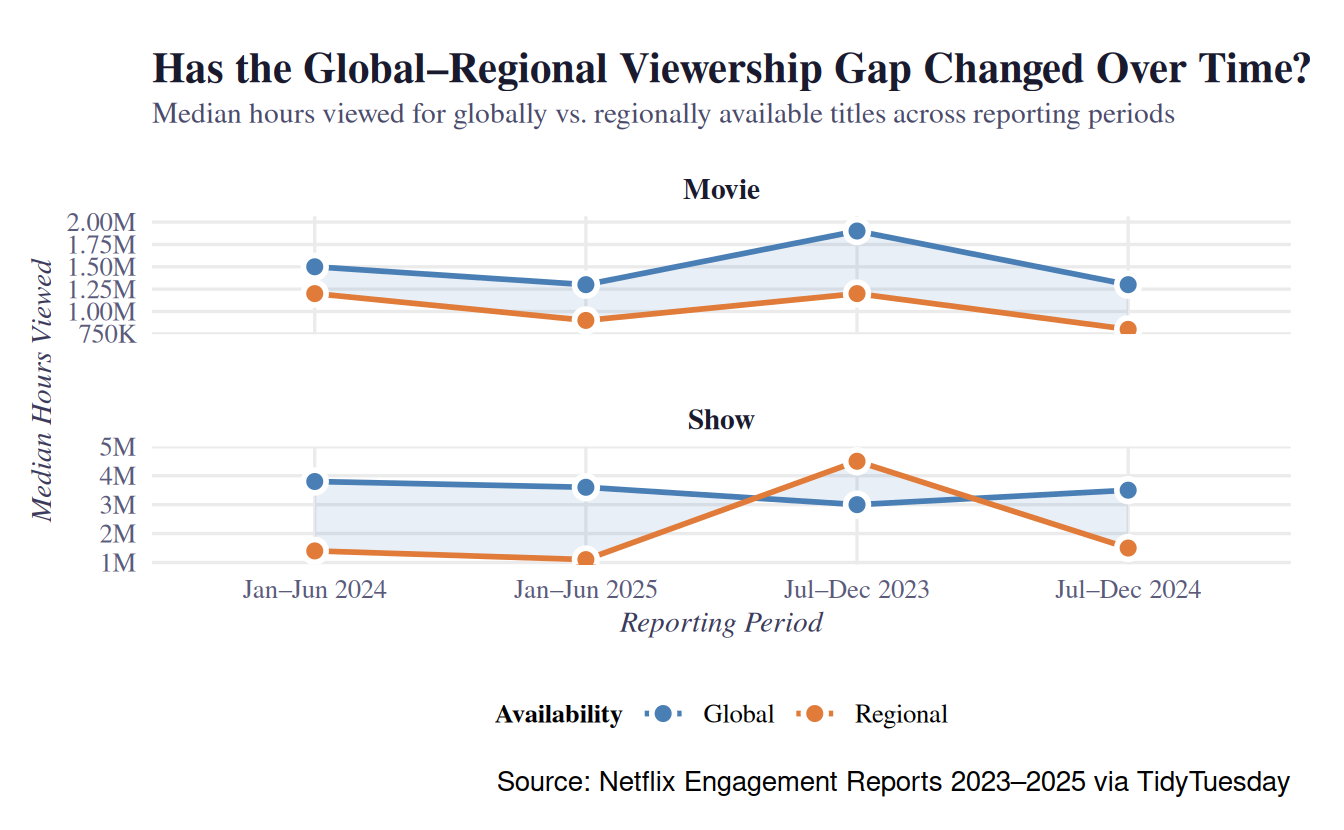
- Figure 2: Median hours viewed by reporting period, grouped by global availability and faceted by content type – Line/Dot Plot
Global vs. Regional Viewership Distribution
- Global titles consistently attract more viewers than regional ones
- Global movies sit roughly a full order of magnitude above regional movies in median viewership
- For shows, the gap is smaller but still persistent across all four reporting periods
- Regional content rarely reaches the upper tail of viewership that global titles routinely hit
Has the Global–Regional Gap Changed Over Time?
- The gap is large, but narrowing for movies; while it is stable for shows
- Global movies dropped from ~1.5M to ~1.25M median hours, while regional held flat around 1M, showing how the gap shrank but never closed
- For shows, both lines move in parallel, where global tends to stay ~2M hours ahead of regional. However, in Jul-Dec 2023, the regional trend surpassed global, which is an interesting data point.
- The +600K movie gap and +2M show gap in H1 2025 suggest global availability remains a strong advantage.
Conclusion
- While global content tends to have a more dominant trend over non-global media in terms of viewership, Netflix has a good learning alogrithm that balances the viewership through the months and seasons.