The Changing Sound of Chart-Topping Music
How Musical Characteristics and Artist Factors Shape Chart Success (1958–2025)
Proud Bunny
Jennifer Ai, Abigail Park, Sam Friedman
2026-03-05
Introduction
Dataset: TidyTuesday Billboard Hot 100 #1 songs (Aug 4, 1958 → Jan 11, 2025)
1,177 #1 song instances, 105 variables
Audio features from Spotify analysis (0–100): energy, danceability, acousticness, etc.
Q1: How have energy, danceability, and acousticness changed over time across genres?
Q2: How do artist gender and collaboration status associate with chart longevity (weeks at #1)?
Question 1: How have musical characteristics of #1 hits changed over time across genres?
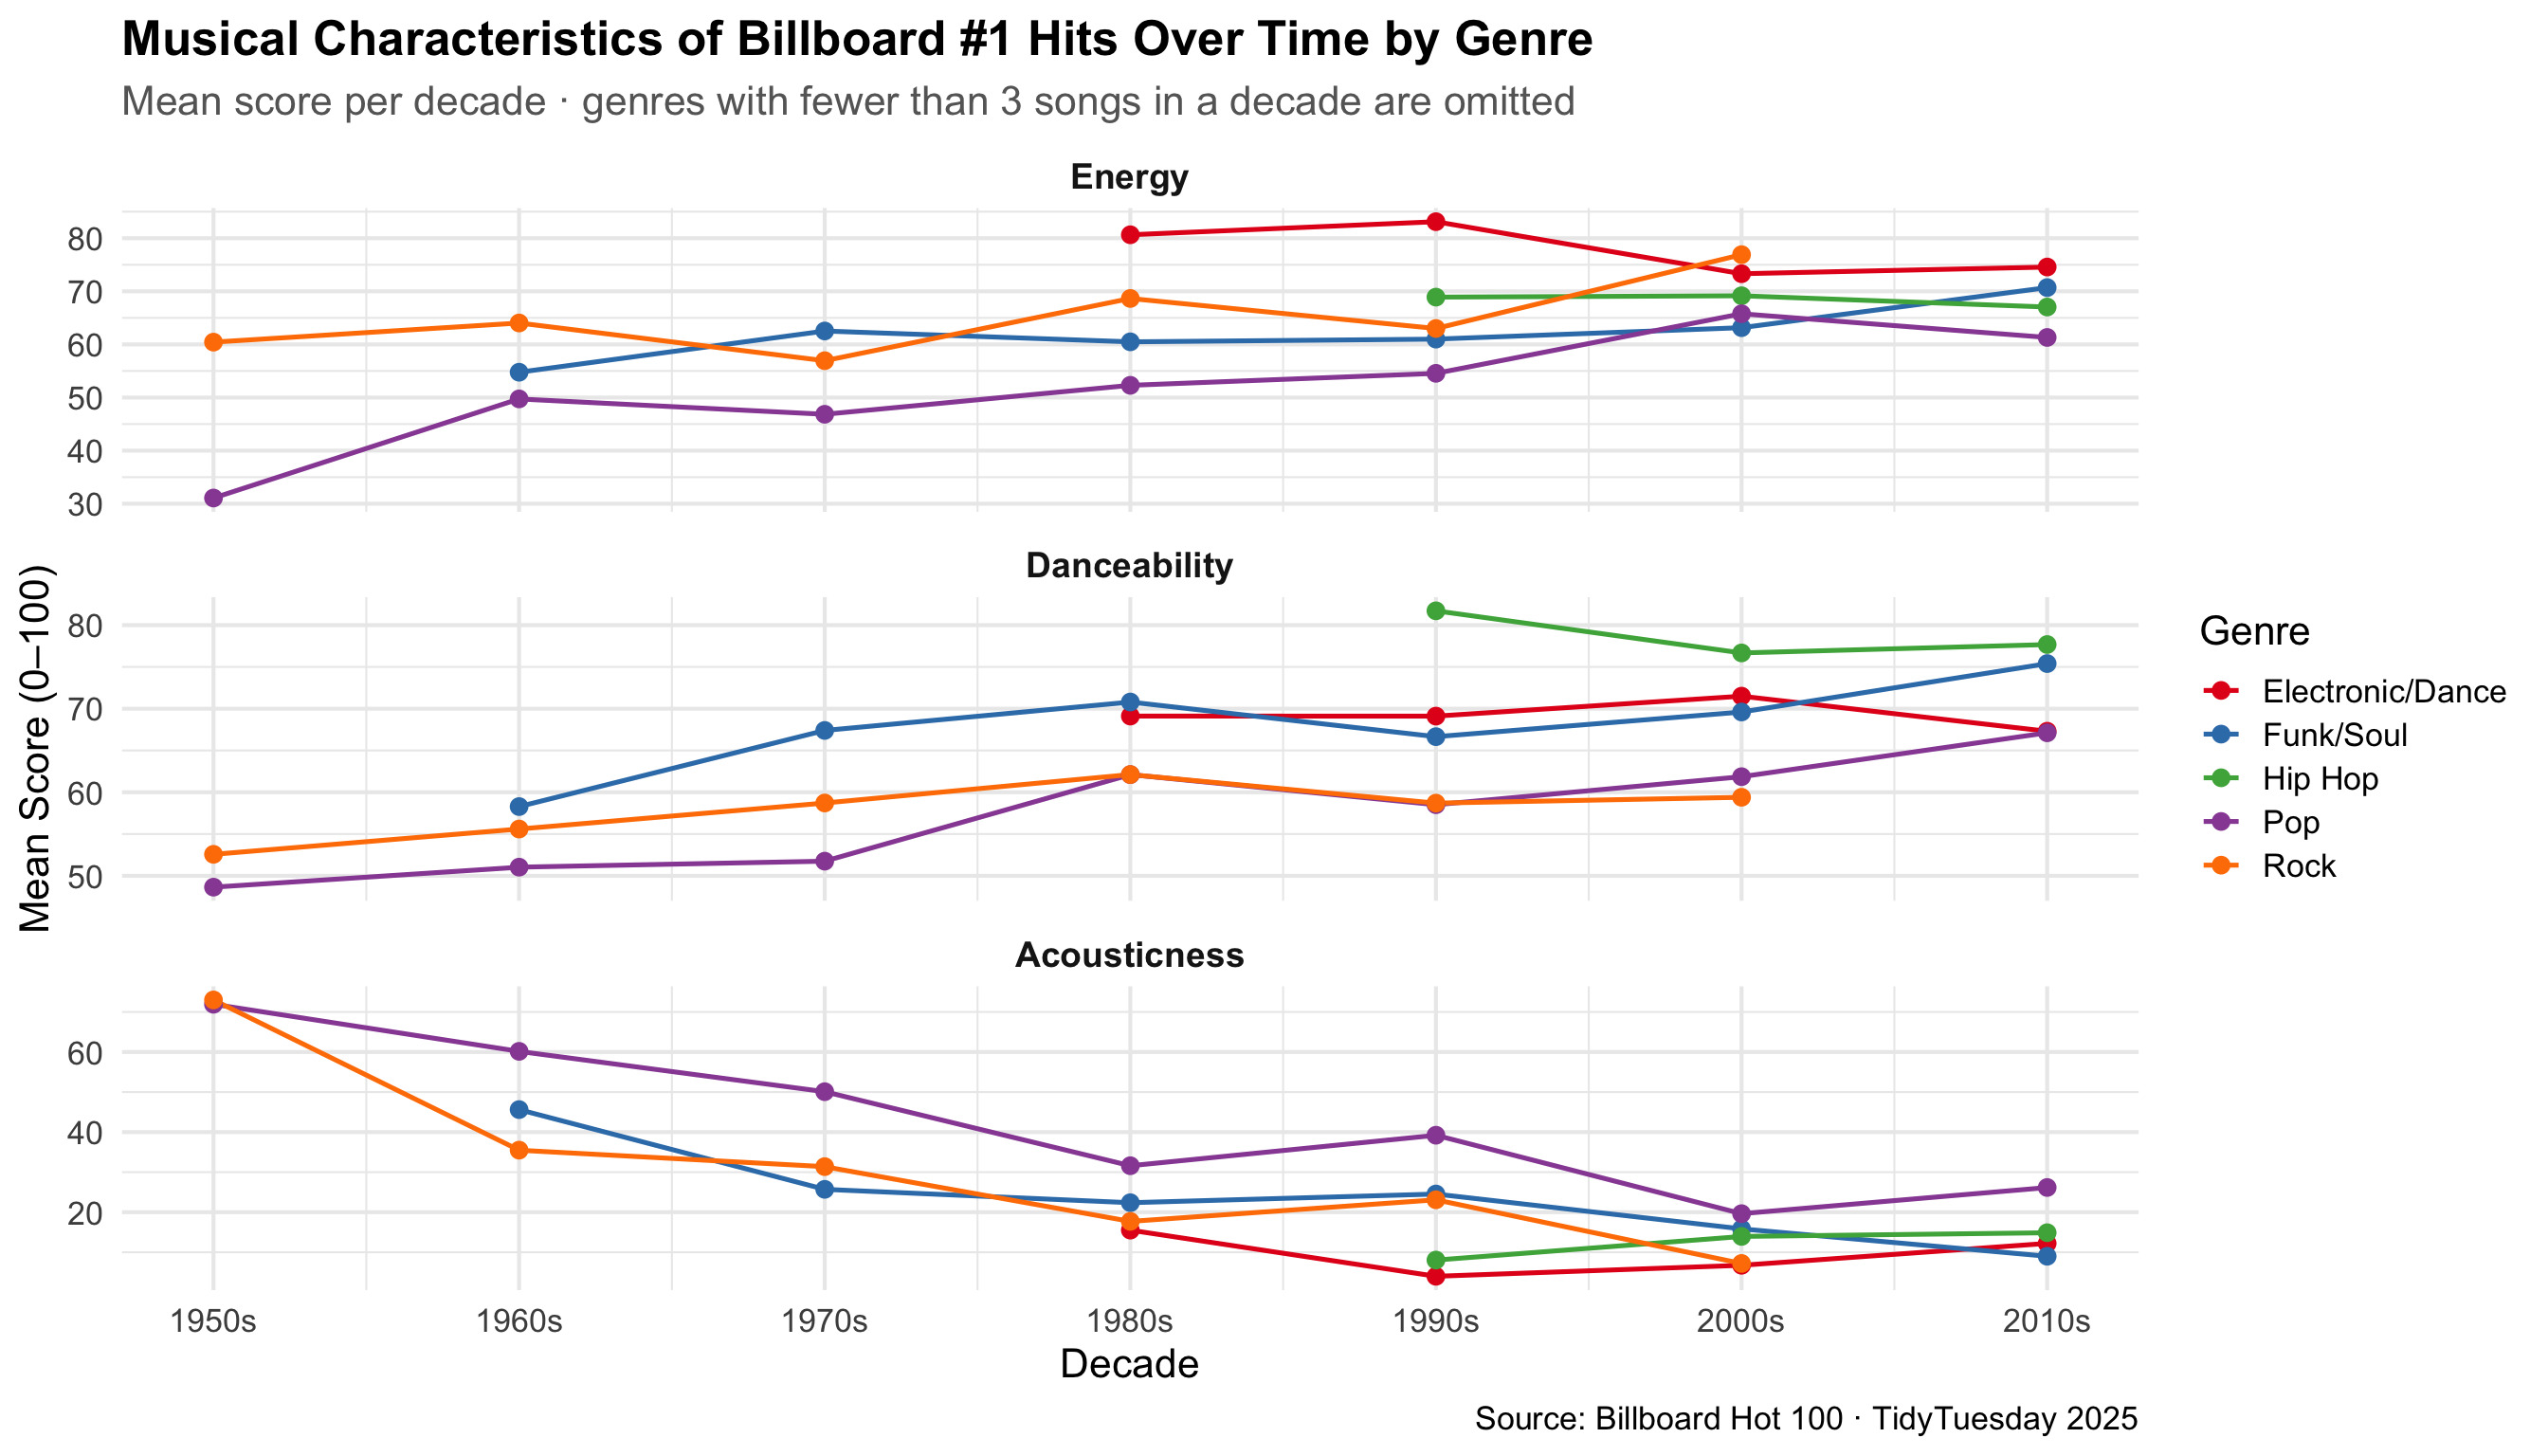
- Plot 1: Line chart — mean feature score per decade, colored by genre
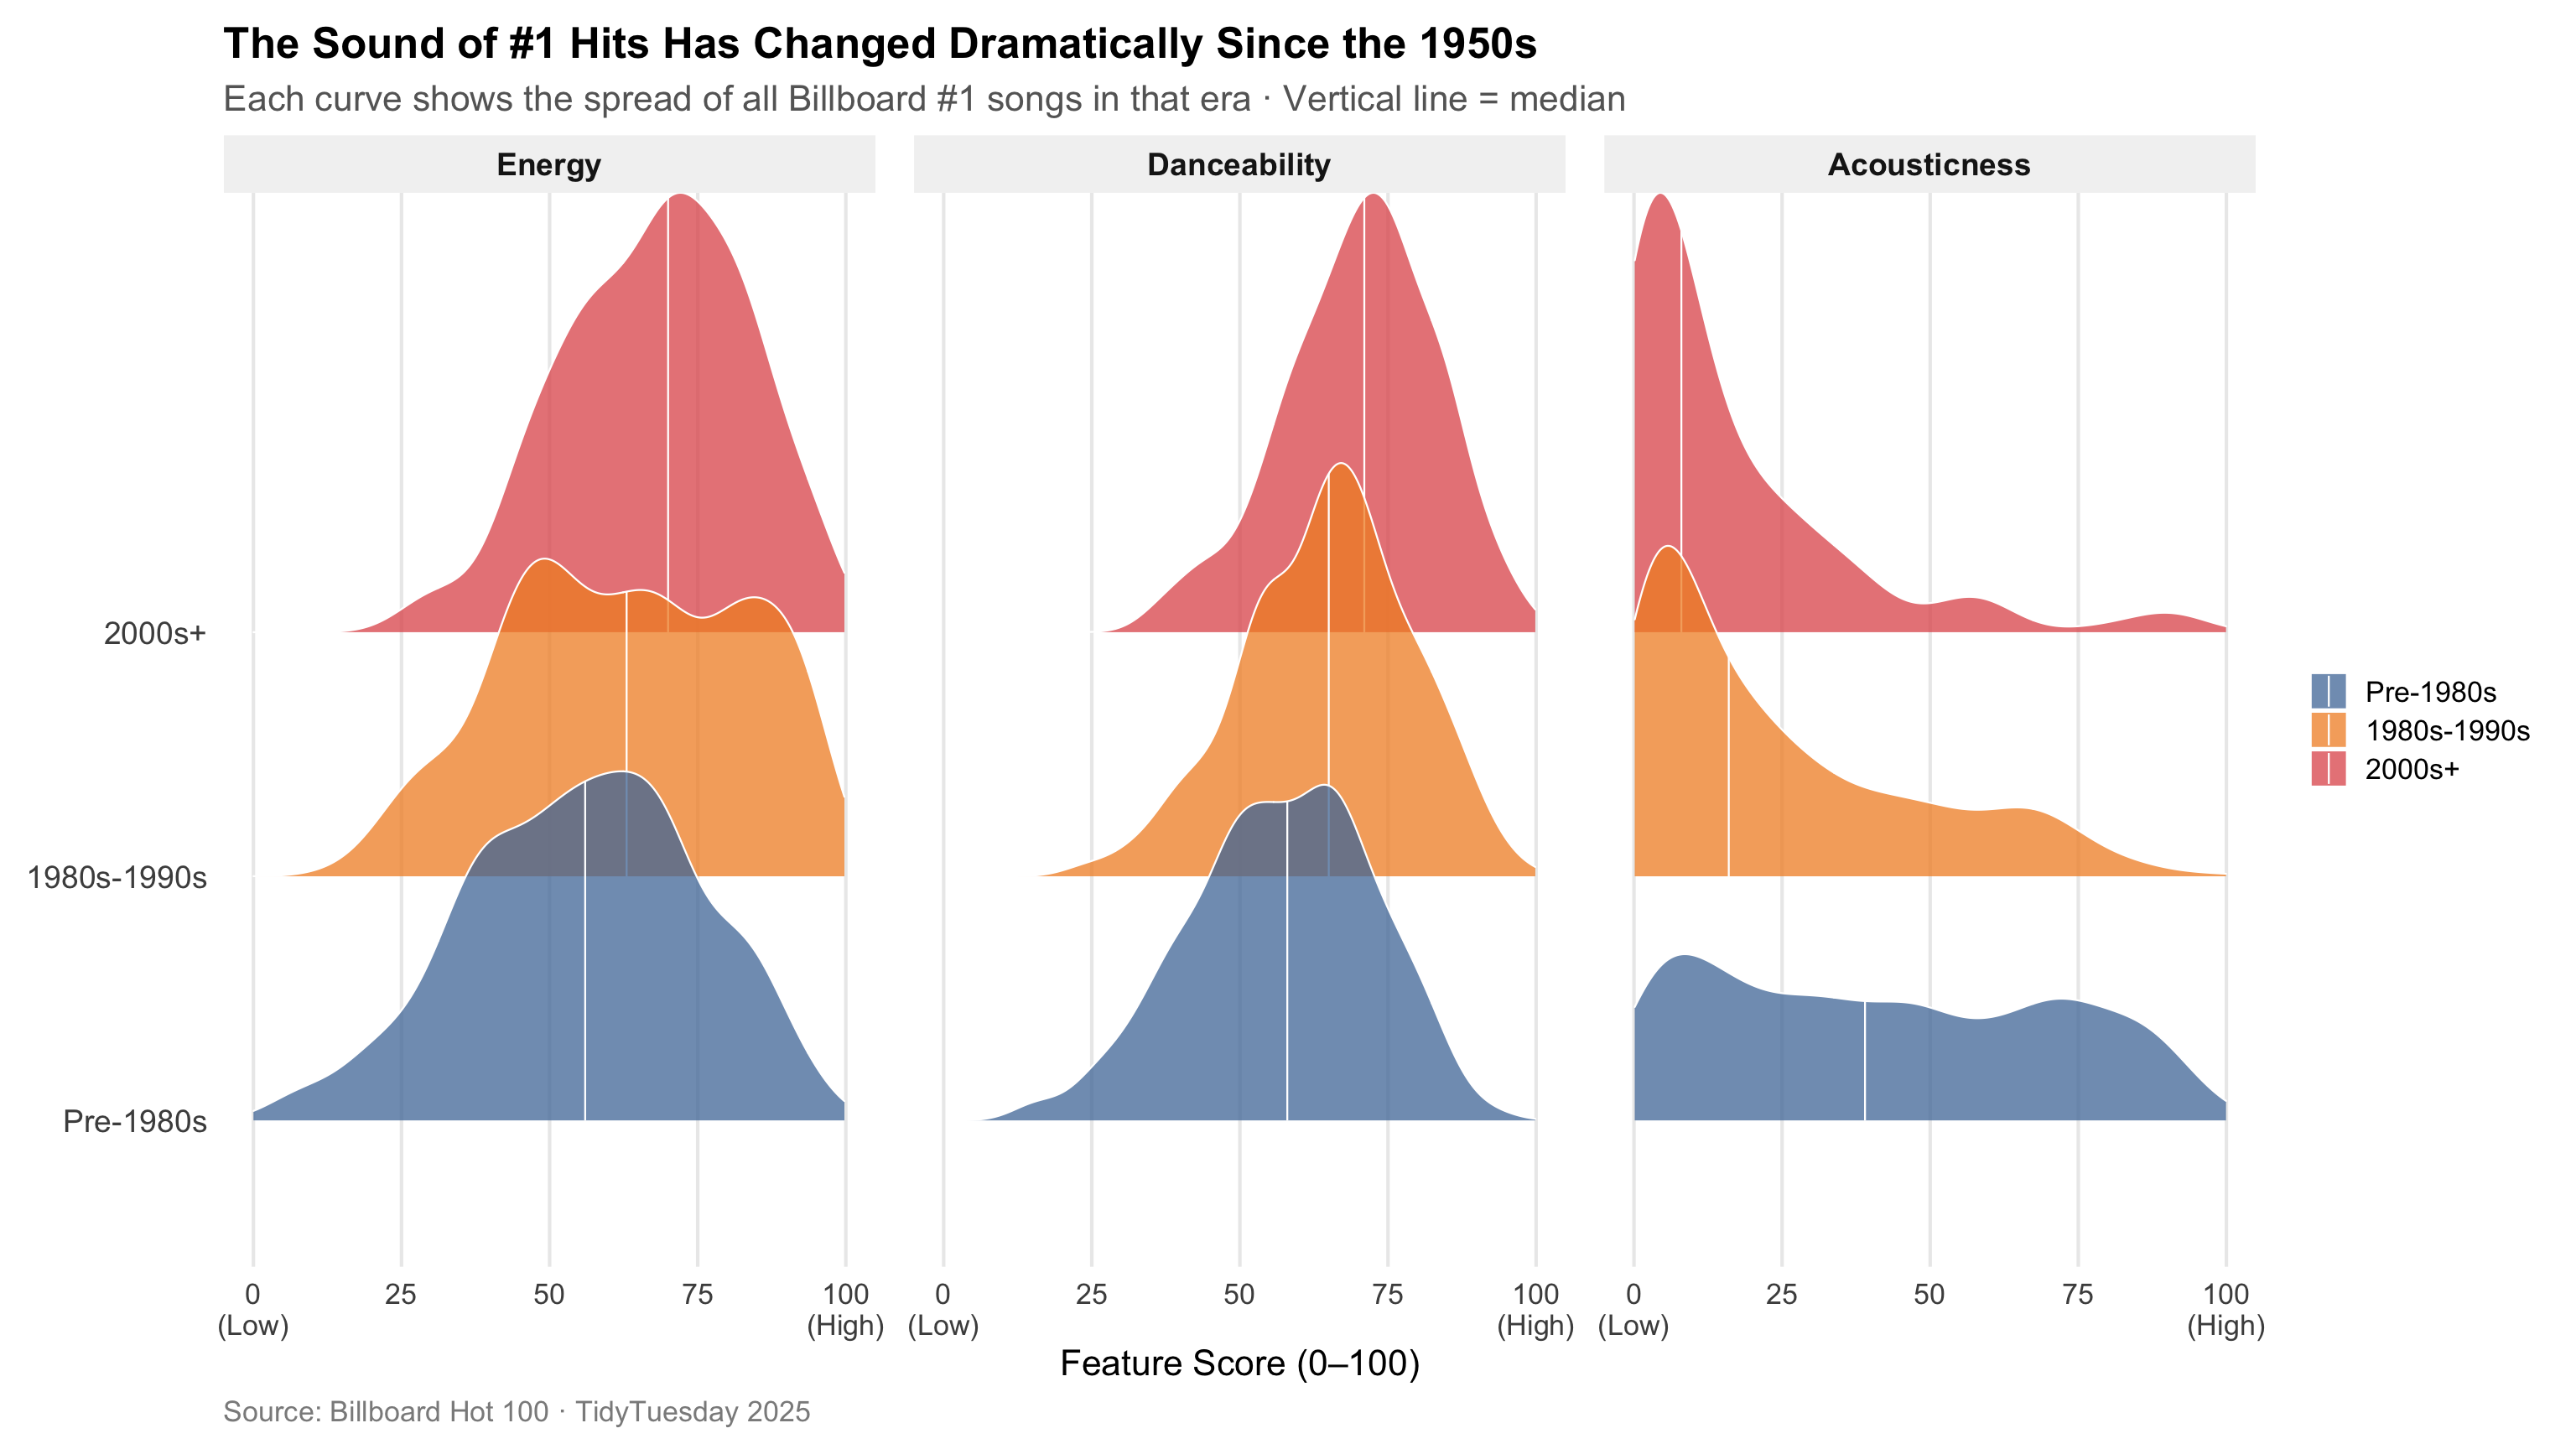
- Plot 2: Ridge density plot — full score distribution across three broad eras
Question 1: Line Chart
![Multi-series line chart showing mean energy, danceability, and acousticness per decade for the five most common Billboard #1 genres.]()
Question 1: Ridge Density Plot
![Ridge density plots showing overall distributions of energy, danceability, and acousticness across three broad eras.]()
Question 2: How is chart longevity (weeks at #1) associated with artist characteristics and critical reception?
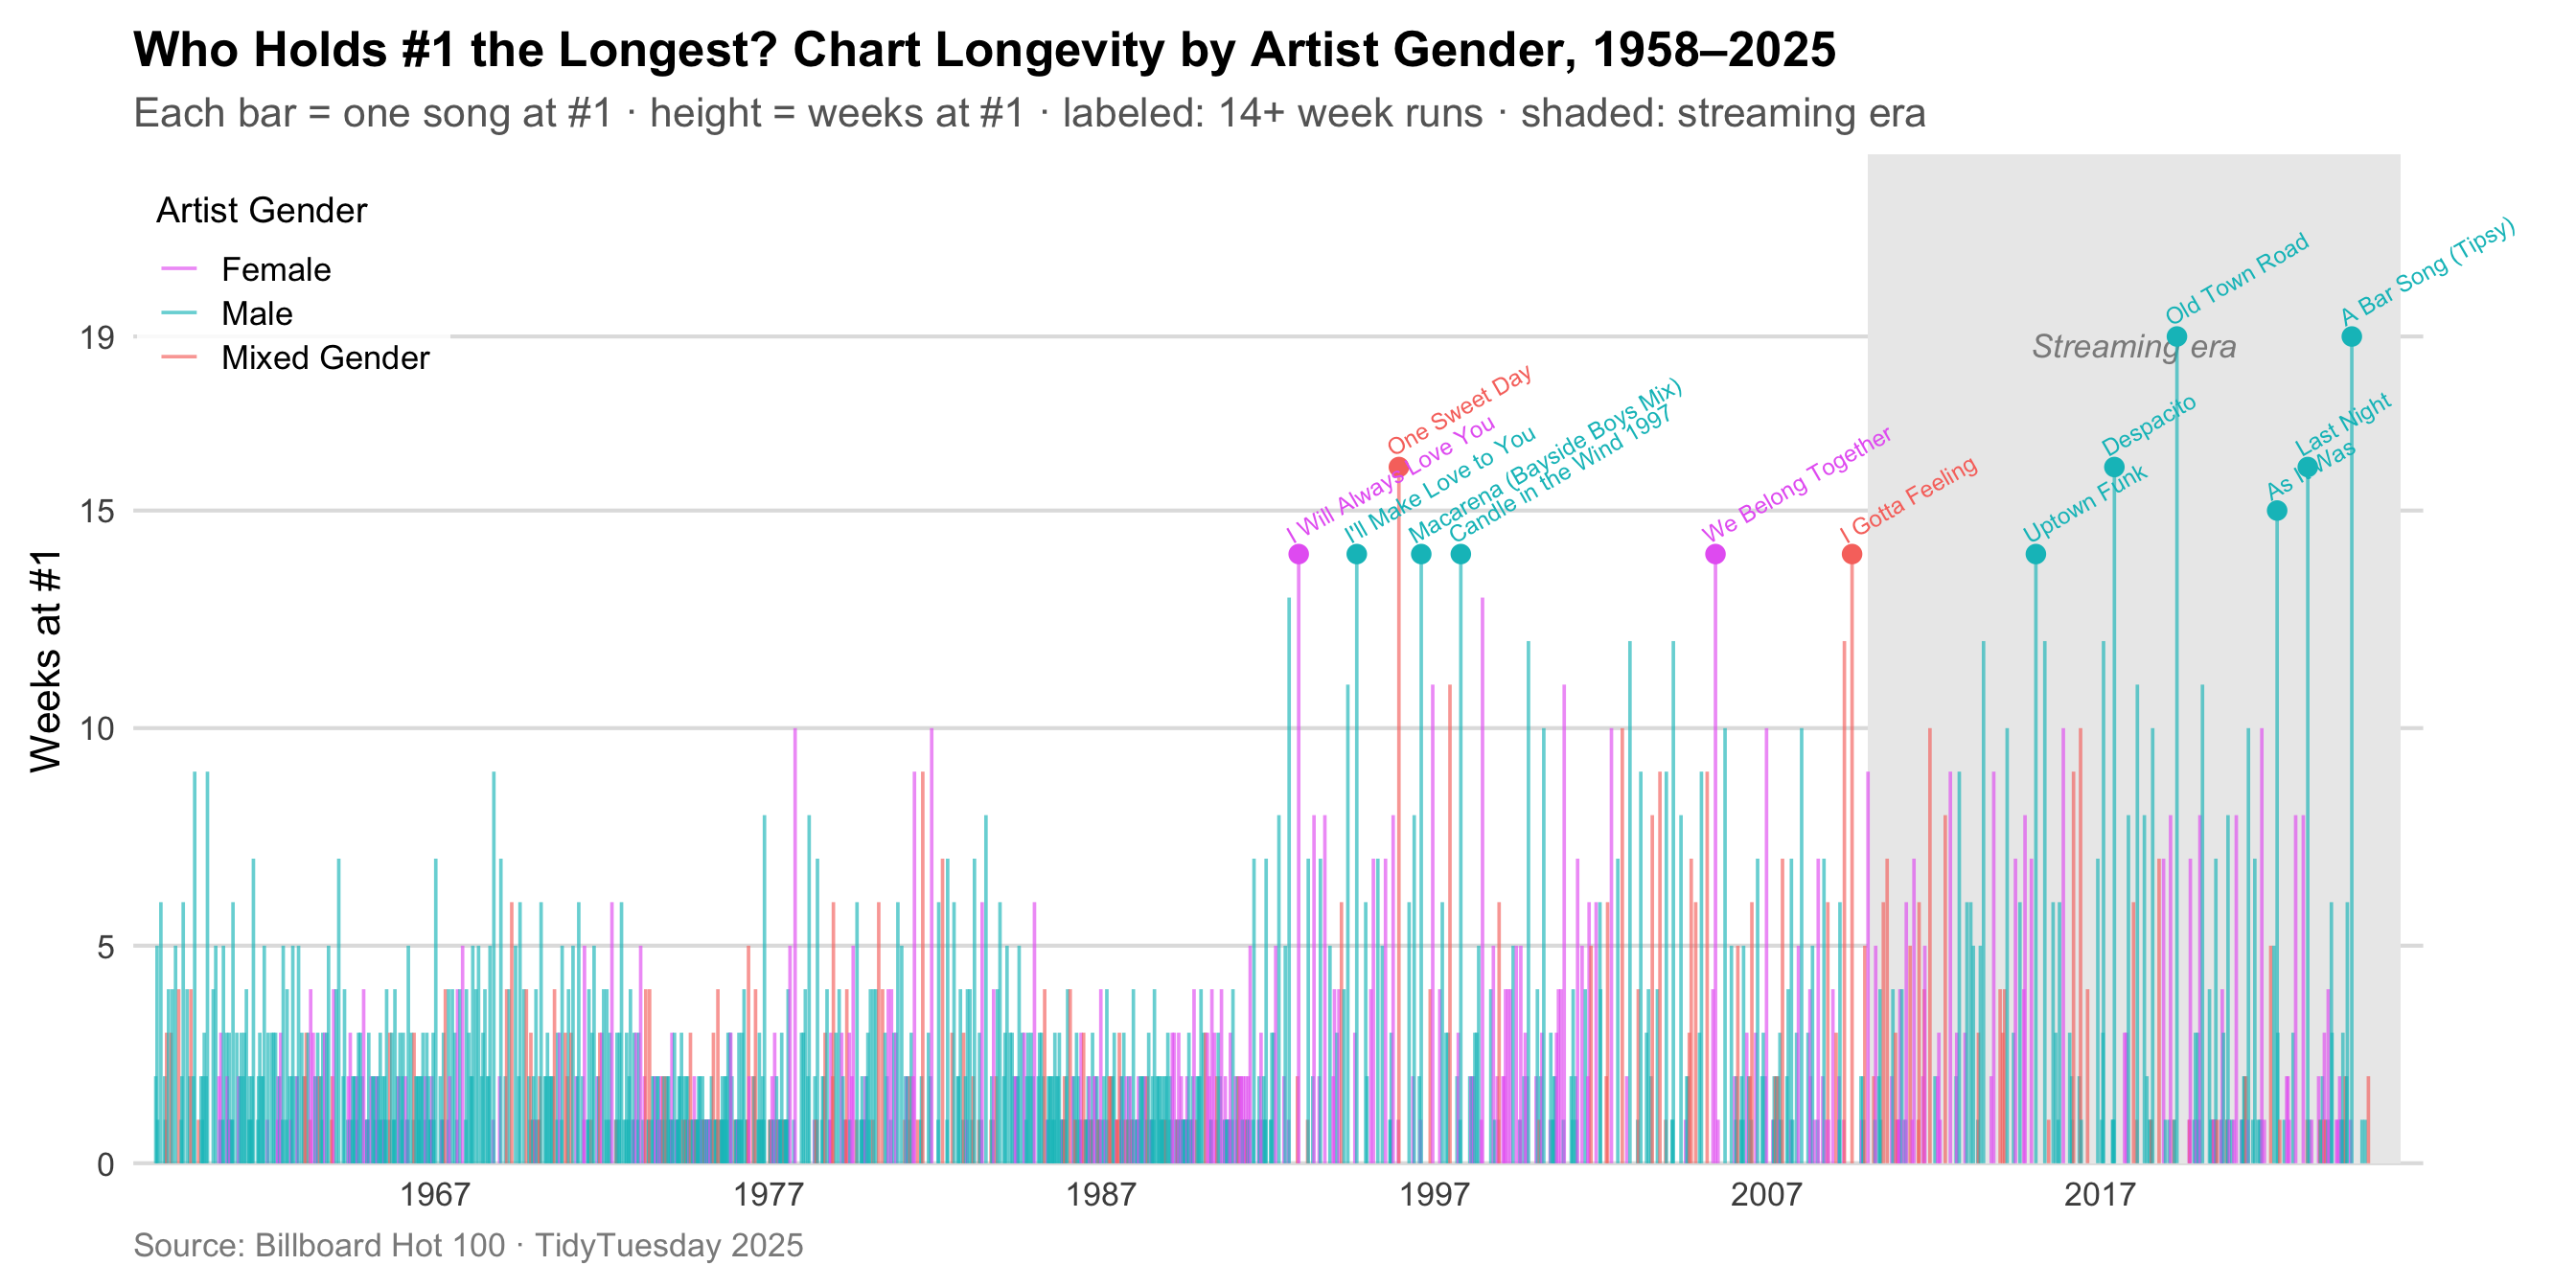
- Plot 1: Chart barcode timeline — every #1 song as a vertical bar, colored by artist gender
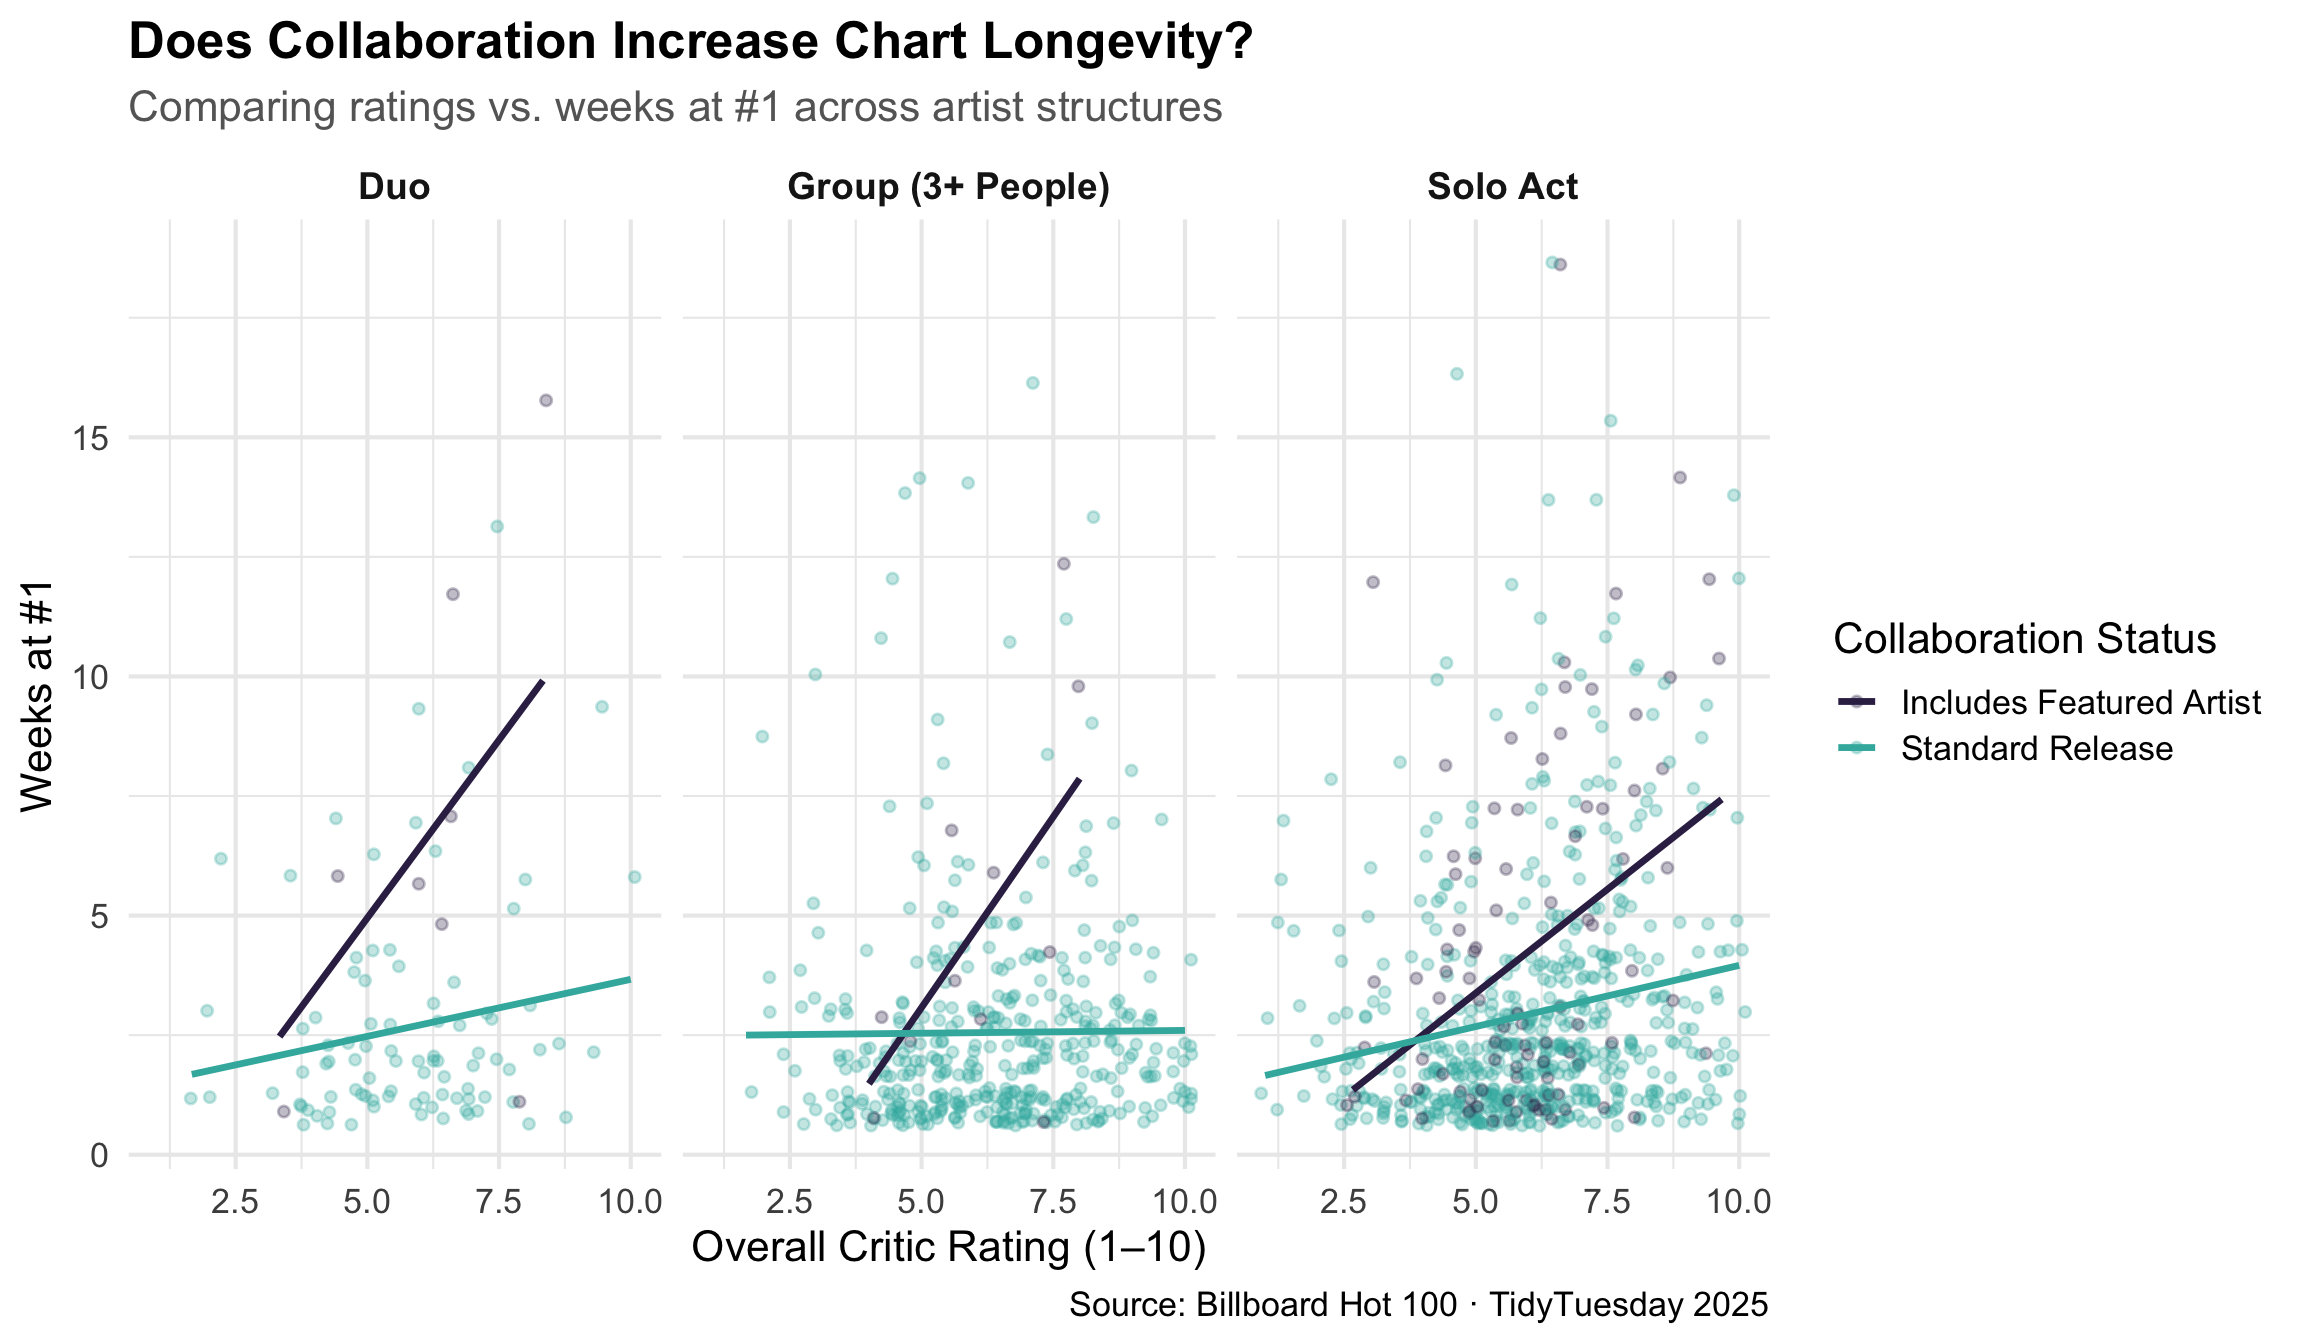
- Plot 2: Faceted scatterplot — critic rating vs. weeks at #1, by artist structure and collaboration status
Question 2: Chart Barcode — Longevity Over Time
![Timeline segment chart showing every Billboard #1 song from 1958 to 2025 as a vertical bar whose height equals its weeks at #1 and whose color encodes artist gender. The streaming era (2010+) is shaded and shows a clear skyline shift toward longer runs. Thirteen songs with 14+ week runs are labeled.]()
Question 2: Collaboration and Critical Reception
![Faceted scatterplot with regression lines showing overall critic rating vs. weeks at #1 for solo acts, duos, and groups, colored by whether the release includes a featured artist. Featured releases show a steeper positive slope.]()
Key Takeaways
Q1: Acousticness collapsed; energy and danceability rose across all genres
Q2: Streaming era extended chart runs; featured artists amplify the effect of high critic ratings
Data: Billboard Hot 100 · TidyTuesday 2025 (Chris Dalla Riva)