Pokémon by the Numbers: Body Builds and Battle Power!
Exploring Pokémon BMI and Competitiveness Across Egg Groups and Generations
Kevin Chang, Shreya Tuli, Aishwarya Khubchandani
2026-03-05
Introduction
The Pokémon dataset (TidyTuesday) gives us a fun but structured way to explore how design choices relate to measurable attributes like size and battle strength. Because it includes both numeric stats and meaningful categories (types, egg groups, generations), it’s well-suited for clear comparisons and fun visualizations!
Source: TidyTuesday Pokémon dataset
Size: 949 Pokémon (rows) × 22 variables (columns)
Unit of analysis: One row per Pokémon entry
Question 1 Introduction
How do body-mass index vary across Pokémon egg groups, and do the group patterns and extreme outliers align with intuitive design expectations?
Approach: We compute a BMI-style index (weight/height²) and use two plots—mean ± SD and distribution/outliers—to compare “heaviness-for-size” across Pokémon egg groups.
Figure 1: Mean BMI by egg group (with s.t.d.) - Bar Chart
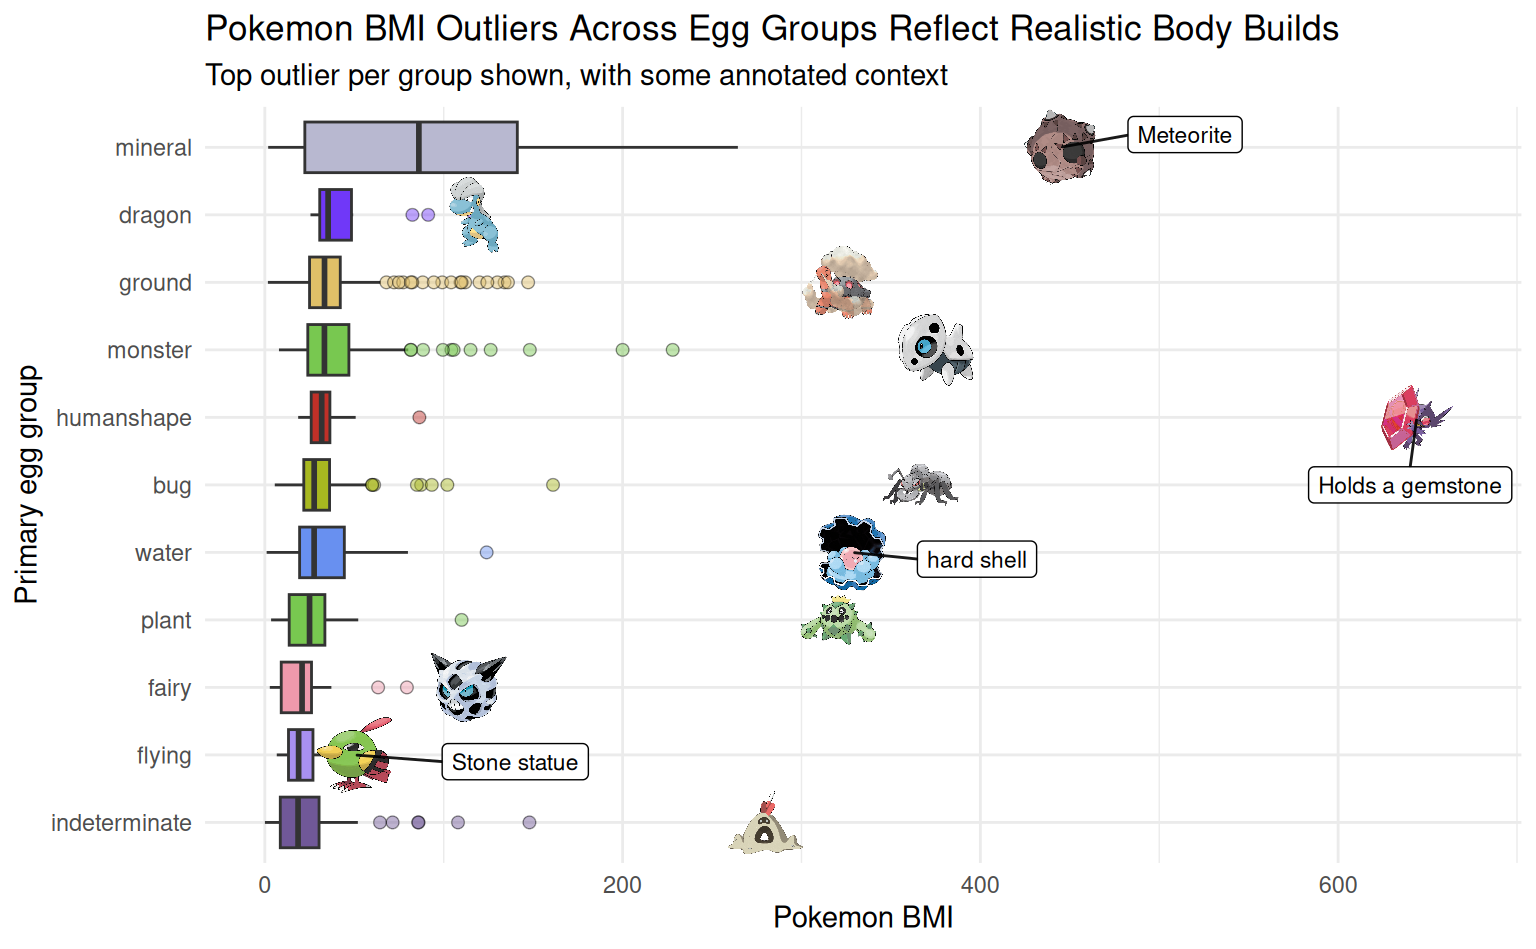
Figure 2: BMI distributions + outliers - Boxplot
Question 1 Analysis - Mean BMI
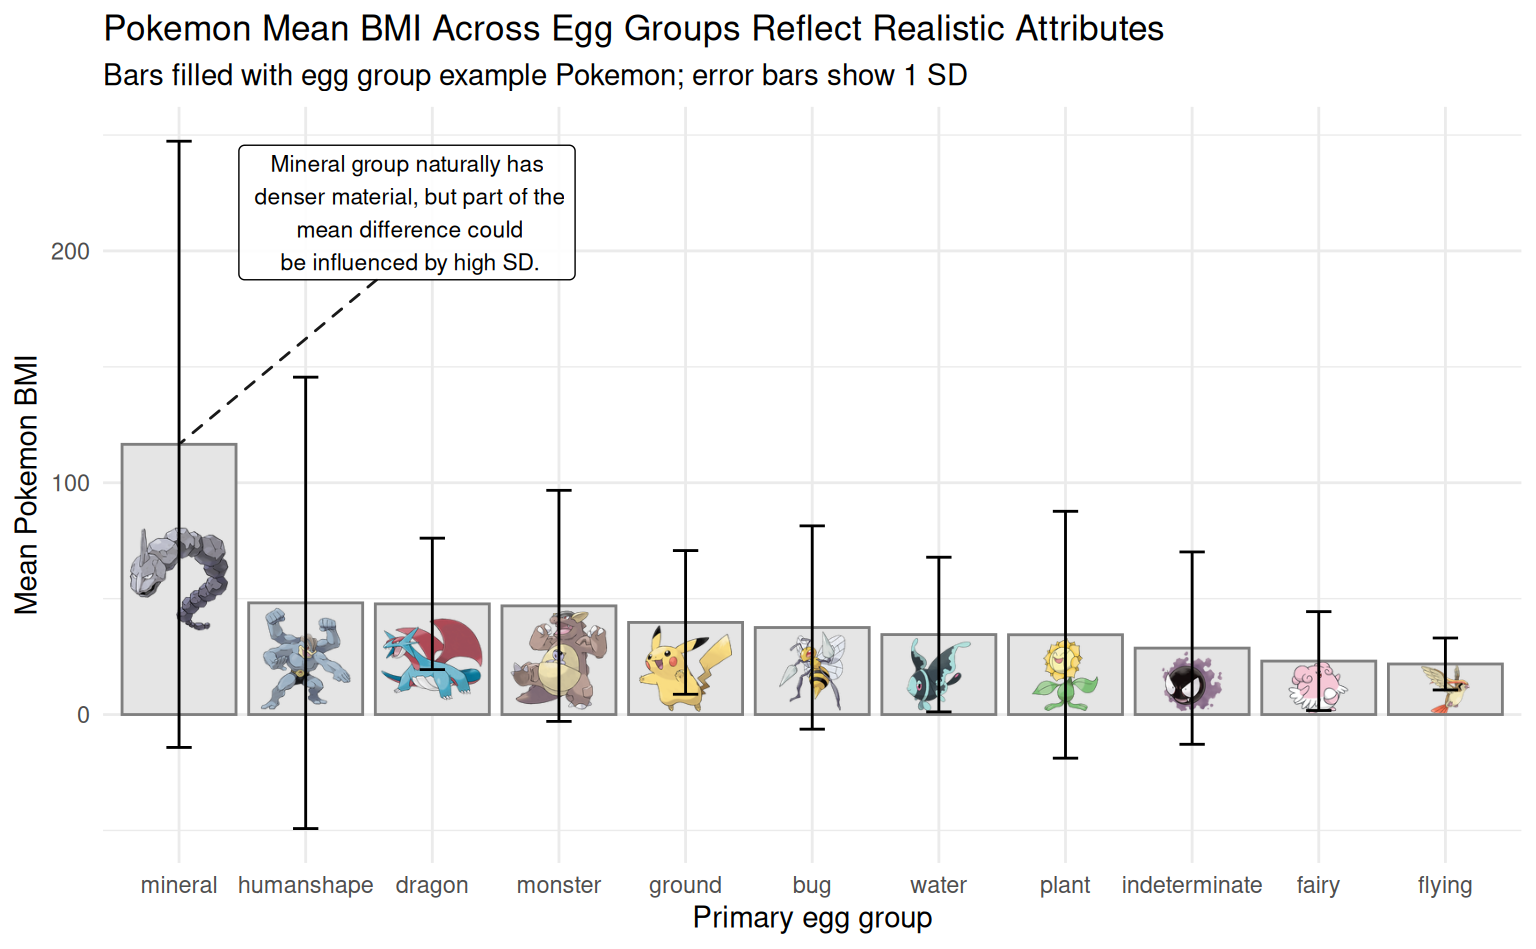
Figure 1
Question 1 Analysis - Outliers
Question 1 Discussion
Pokémon BMI (weight/height²) varies by egg group in ways that feel “realistic” overall, and the biggest outliers are explainable by each Pokémon’s design concept.
- Mineral has the highest mean BMI, Fairy and Flying have the lowest means (and relatively tighter spread)
Outliers that support design realism:
- Mineral (Minior): a meteor/space rock
- Humanshape (Mega Sableye): holds a massive gemstone
Question 2 Introduction
What Pokemon types are becoming more competitive across generations?
Approach: We define competitiveness using total base stats (Hitpoints + Attack + Defense + Speed+ Special Attack & Defense). Then we use two visuals:
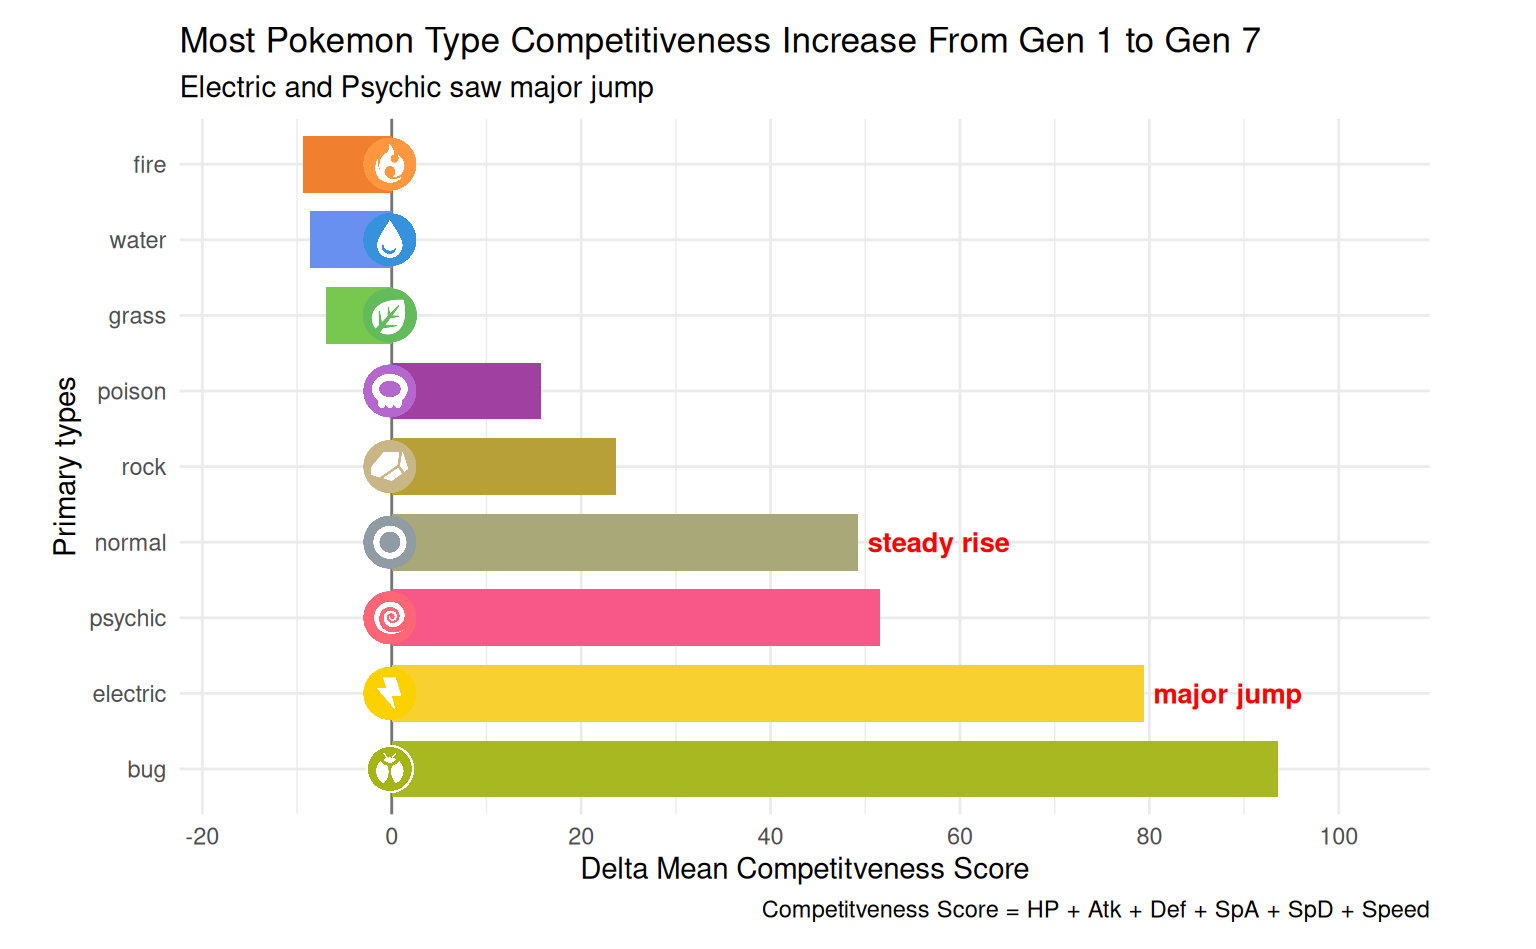
Figure 3: Change in mean competitiveness from Gen 1 → Gen 7 by type (Delta of mean total base stats)
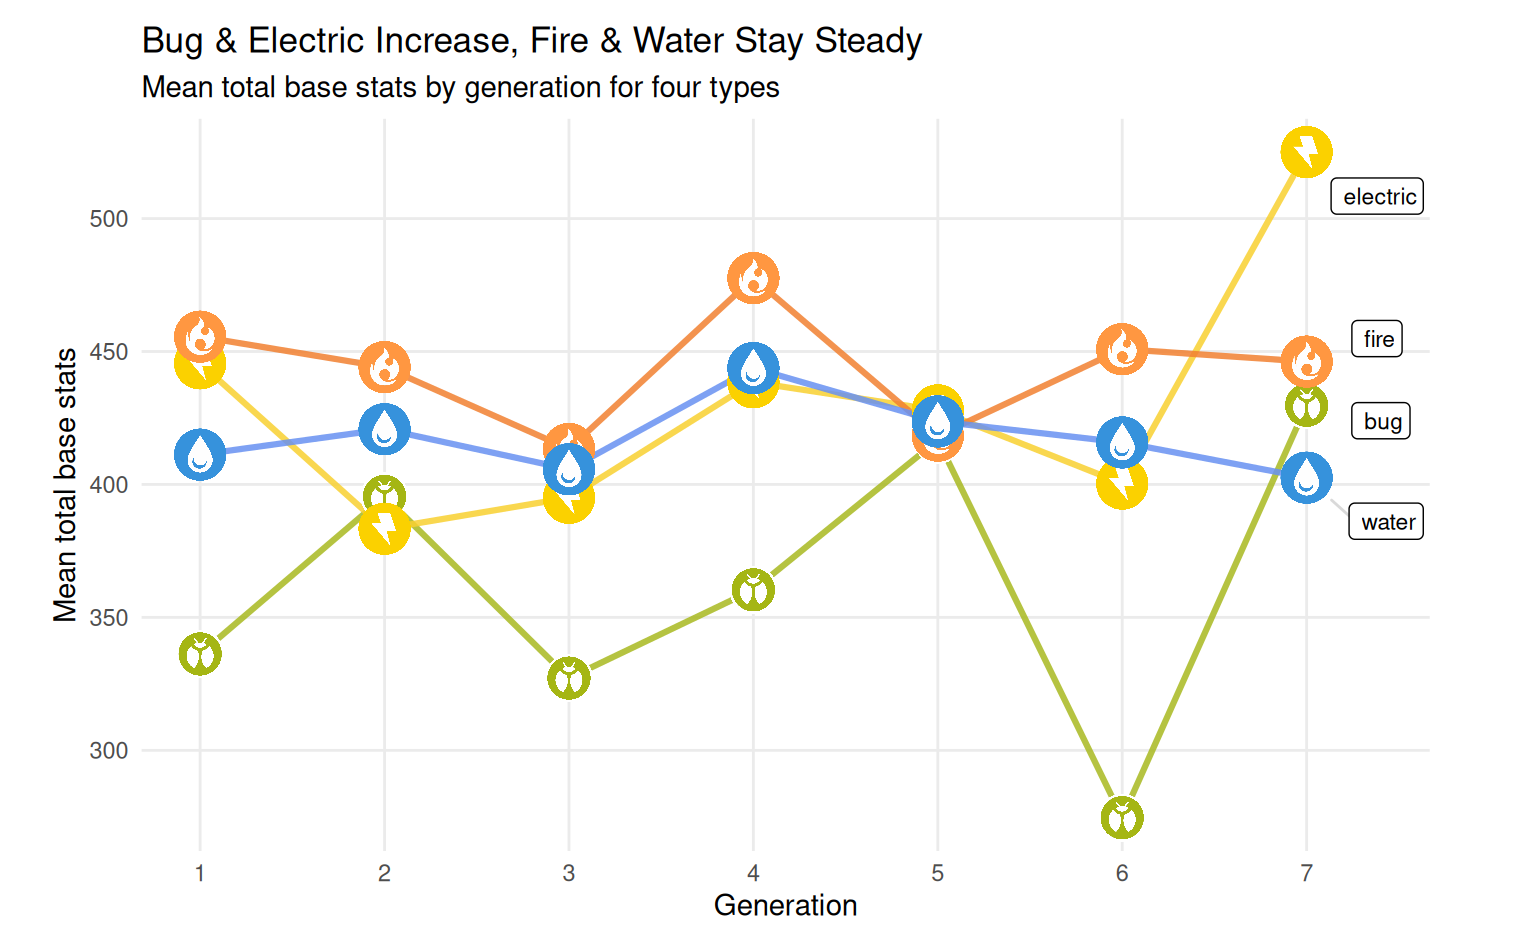
Figure 4: Select 4 types from Figure 3; 2 biggest risers (Bug, Electric) and 2 most flat (Fire, Water) to show changes unfolding over generations
Question 2 Analysis - Gen 1 vs 7
Question 2 Analysis - Trends
Question 2 Discussion
Main result (Gen 1 → Gen 7)
- Biggest gains: Bug and Electric
- Also rising: Psychic and Normal; Fire/Water/Grass are flatter
What the 4-type trend clarifies
- Growth isn’t uniform: types don’t move together
- Bug/Electric rise over time (not just a one-gen spike)
Why it feels believable
- Bugs usually early-route picks in early gens, but later become more late-game-viable
- Electric gets more high-powered designs over time
Conclusion & Limitations
Q1: BMI varies by egg group in a way that feels intuitive
Q2: Gains vary by type; Bug/Electric rise most, Fire/Water/Grass stay flat
Limitations:
We only use egg_group_1
Primary type only: ignores dual types