Netflix Movies & Shows
What kinds of factors can cause engagement to change?
Proud Koala
Aniha Kuninti, Jasmine Pearson, Serene Pan
2026-02-12
Introduction: What have we been watching on Netflix?
- Source: Tidytuesday Netflix Engagement Reports
- Size: 61167 Movies and Shows (Rows) x 13 Variables (Cols)
- Unit of Analysis: One Movie/Show Per Reporting Period
Intro to Question 1
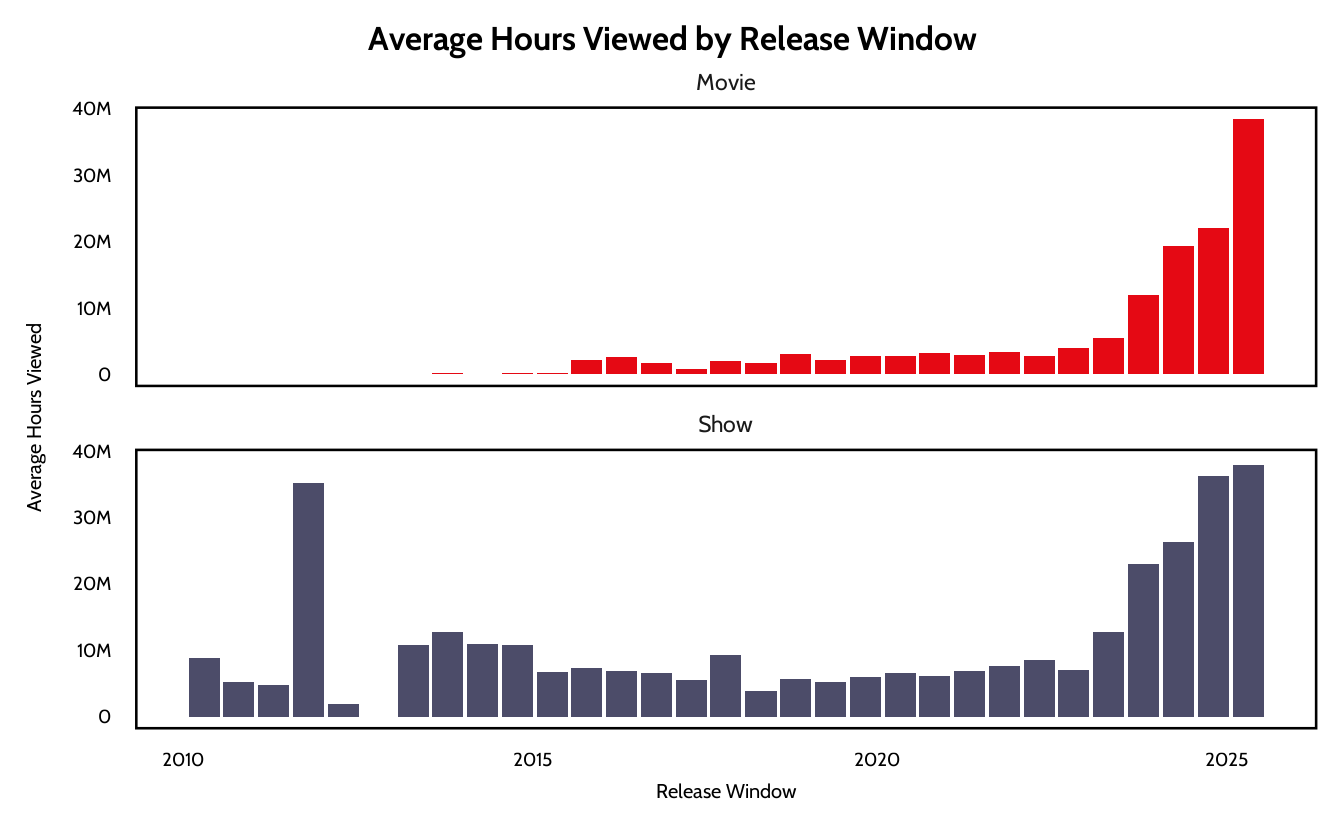
Are movies and shows released in certain 6-month windows associated with higher average engagement?
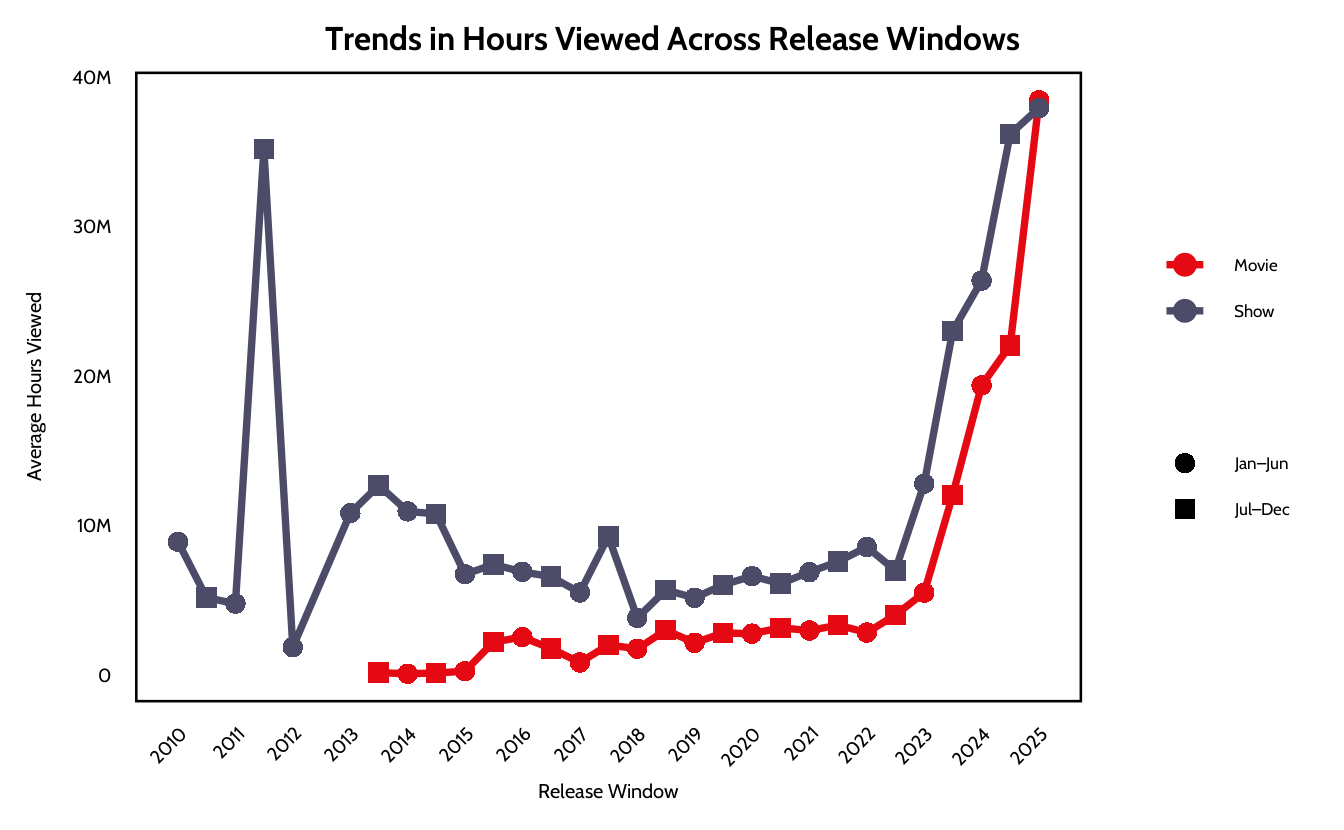
Approach: We aggregate average and median hours viewed by six-month release window and format (movie vs. show), using grouped bar charts and line graphs to compare engagement levels across periods, considering movie and show differences.
- Figure 1: Avg Hours Viewed Separated by Content Type
- Figure 2: Release Window vs Avg Hours Viewed
Intro to Question 2
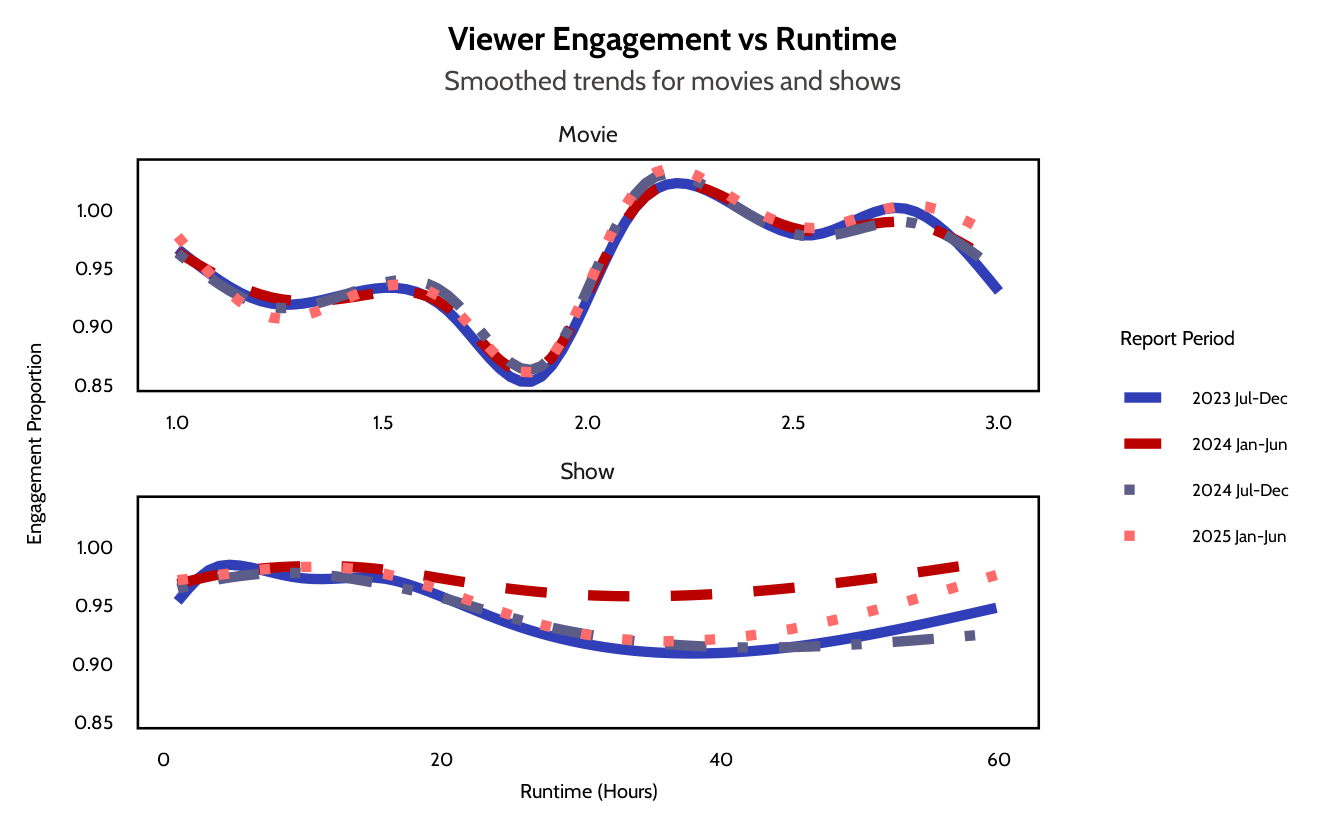
Do longer movies and shows have the same amount of viewer engagement as shorter ones?
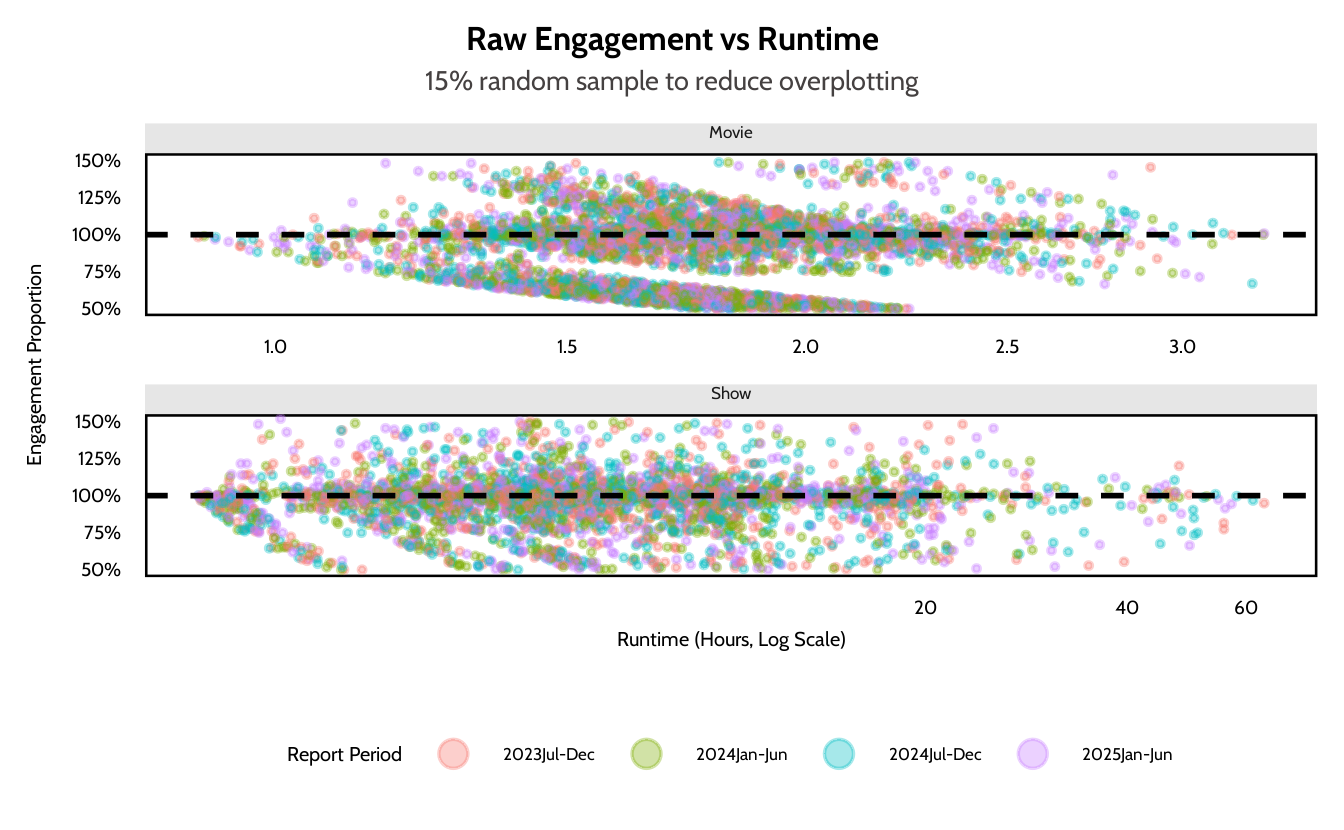
Approach: We examine the relationship between runtime and engagement proportion using a smoothed, faceted trend plot to compare movies and TV shows while minimizing noise. We also create a jittered scatterplot of the raw data, with a log transformation.
- Figure 3: Geom_Smooth Plot of Data
- Figure 4: Scatter Plot of Raw Data, Log Scale
Key Takeaways
• Shows consistently generate more viewing hours than movies
• Viewer engagement remains close to full runtime across most titles
• Runtime has minimal impact on completion rates
• Viewer behavior appears consistent across release periods