MTA Underground Art Gallery
Understanding How Transit Infrastructure and Time Shape Public Art Across the MTA
2026-03-05
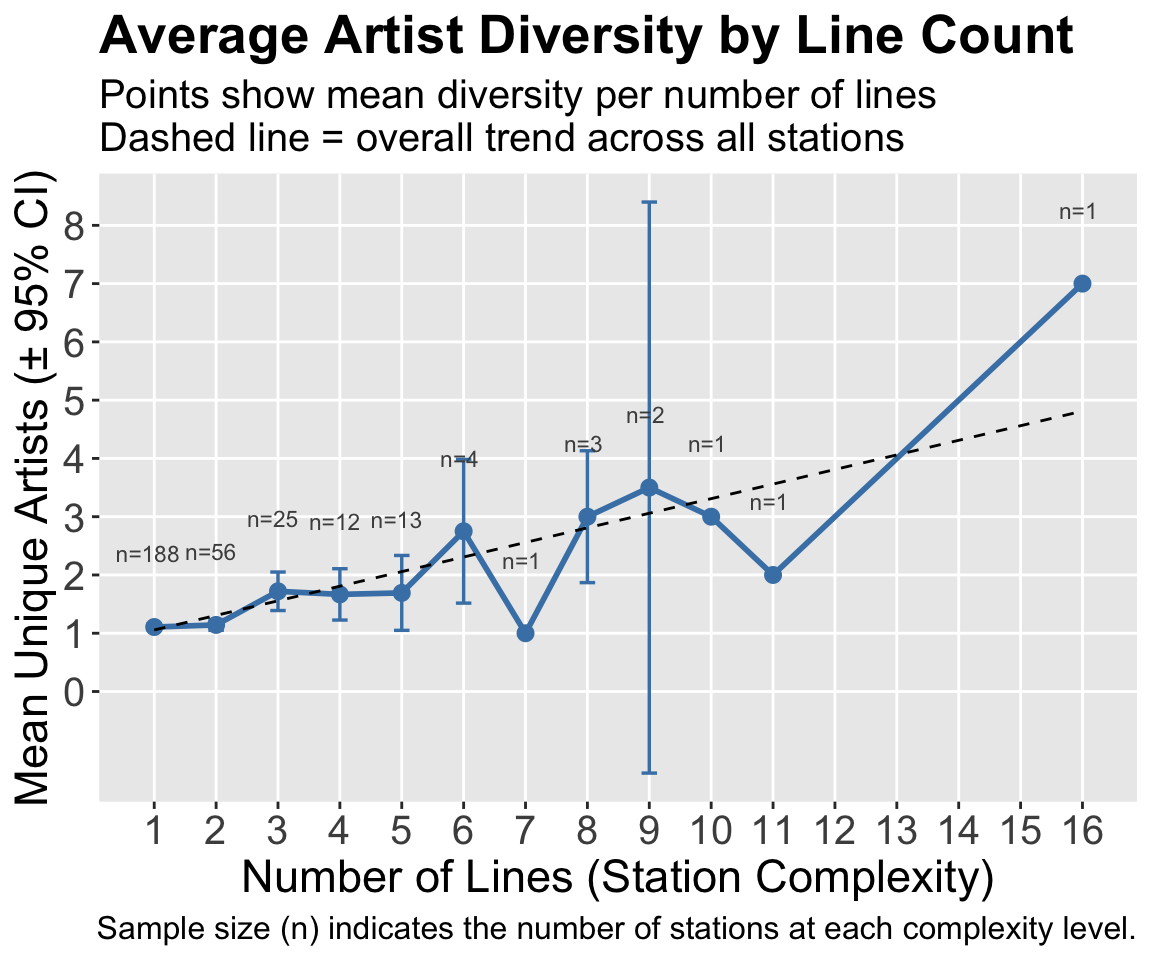
Q1.2
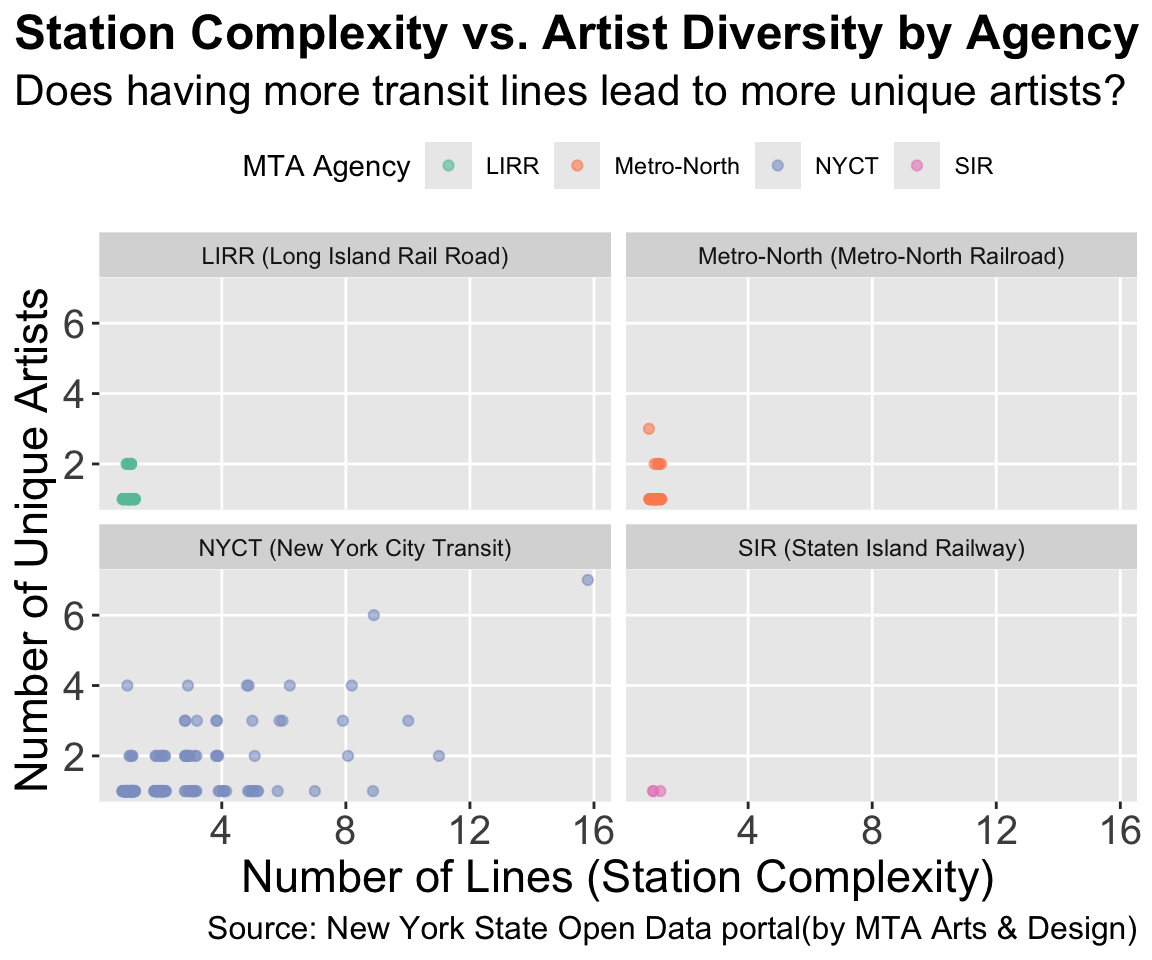
- Agency Gap: Commuter lines → low complexity, flat diversity
- Subway Centric: This relationship is exclusive to NYCT
- Urban vs. Suburban: Urban hubs diverse; suburban lines uniform
Q2.1
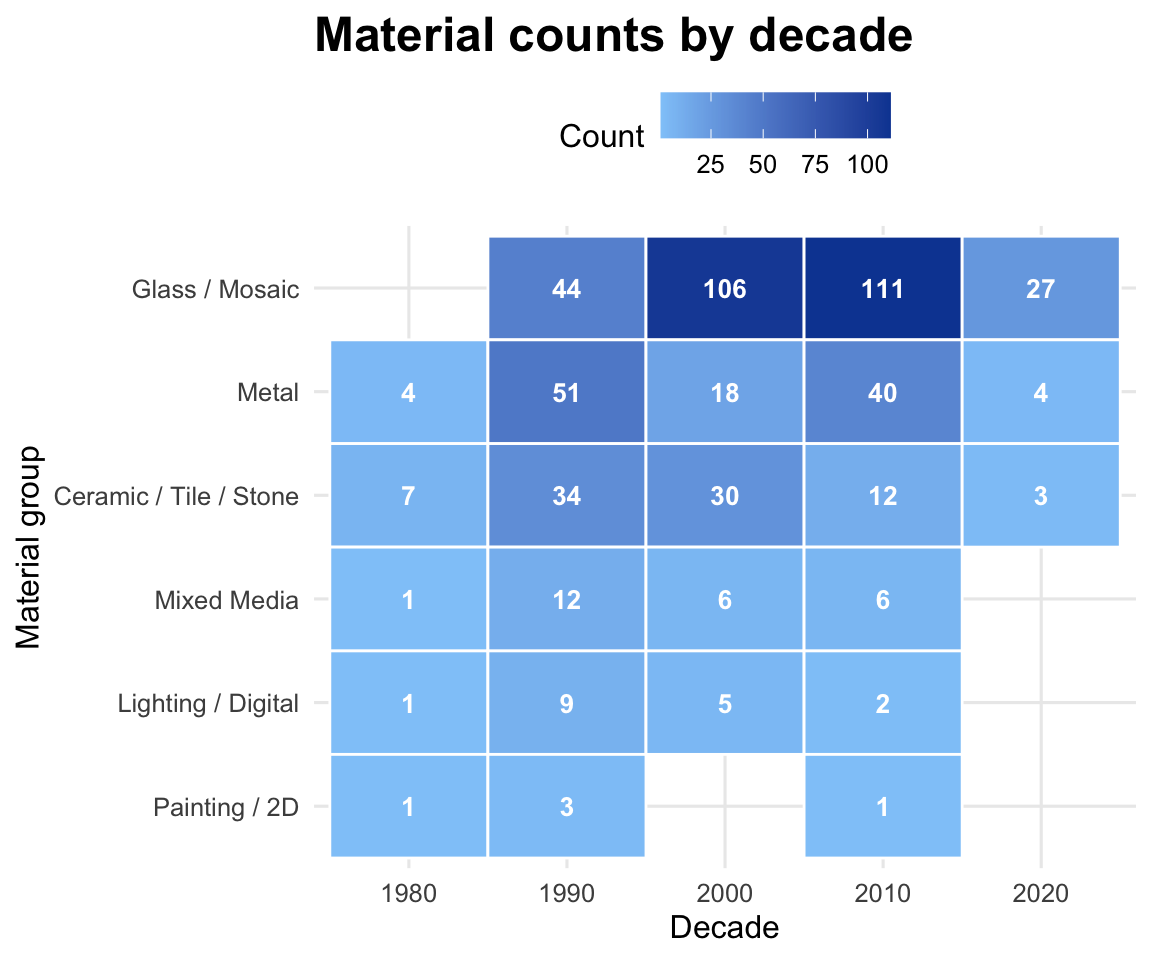
- Glass/Mosaic dominates, especially from the 1990s–2010s, peaking around 2010
- Metal and Ceramics appears consistently across decades but at much lower counts
- Other materials are rare, with only occasional installations in earlier decades
Q2.2
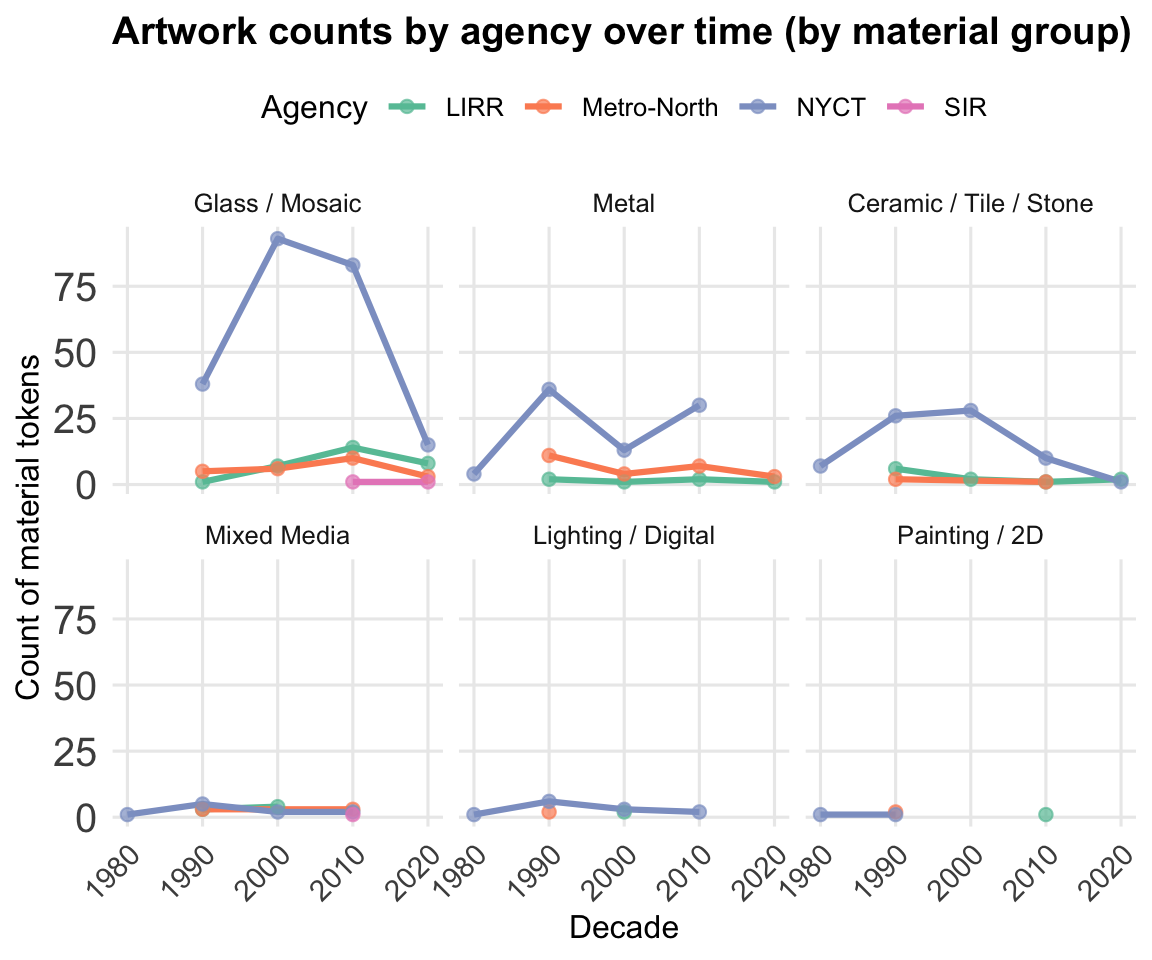
- NYCT dominates most artwork categories, especially glass/mosaic, ceramic, and metal across decades.
- Artwork production peaks around the 1990s–2000s, with noticeable declines in later decades.
- Other agencies contribute fewer artworks, showing smaller and more stable trends over time.