The Genomics of Cuisine
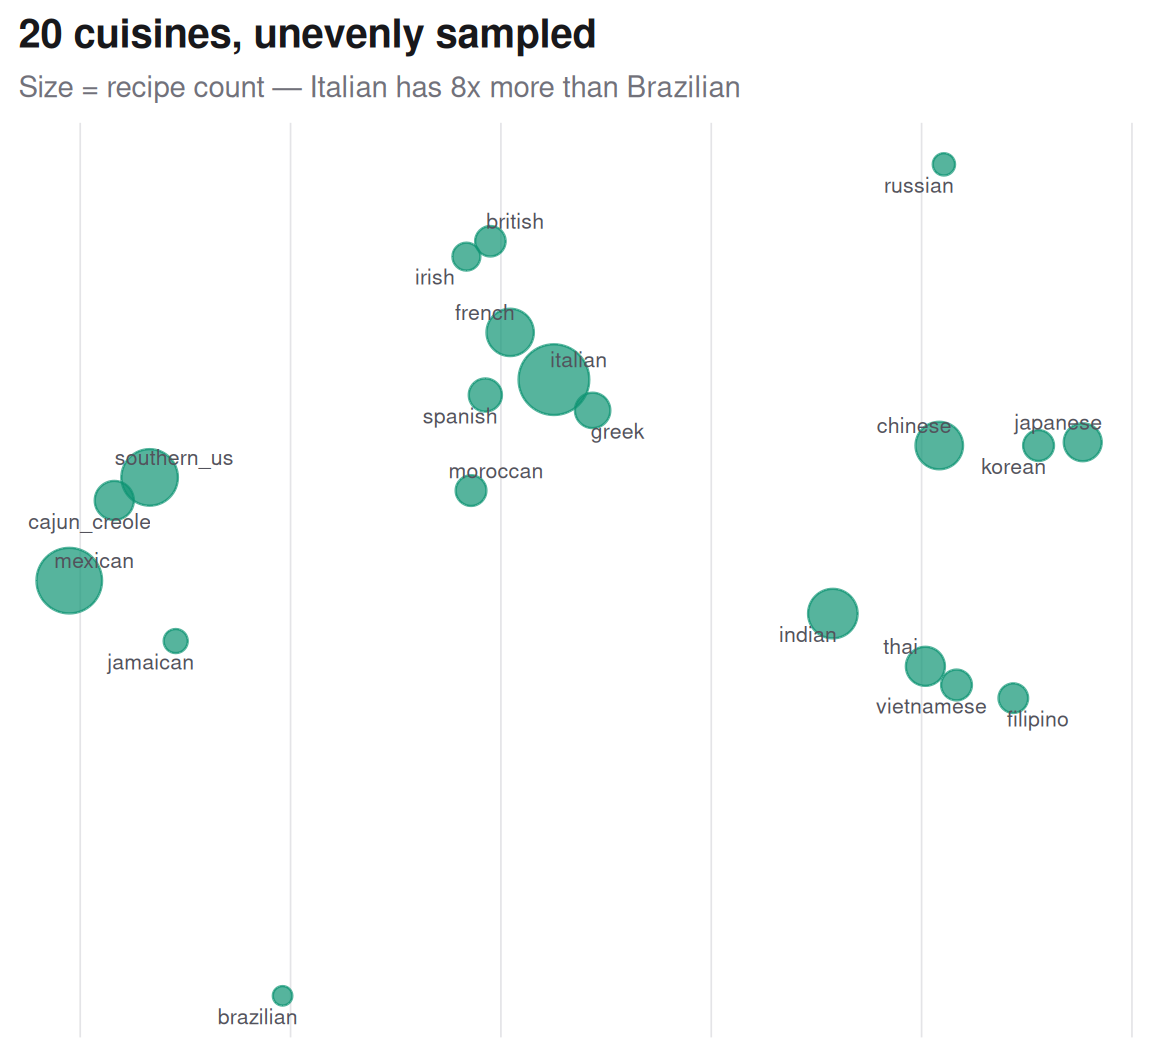
Mapping Flavor Compound Relationships Across 20 World Cuisines
2026-05-13
Methods
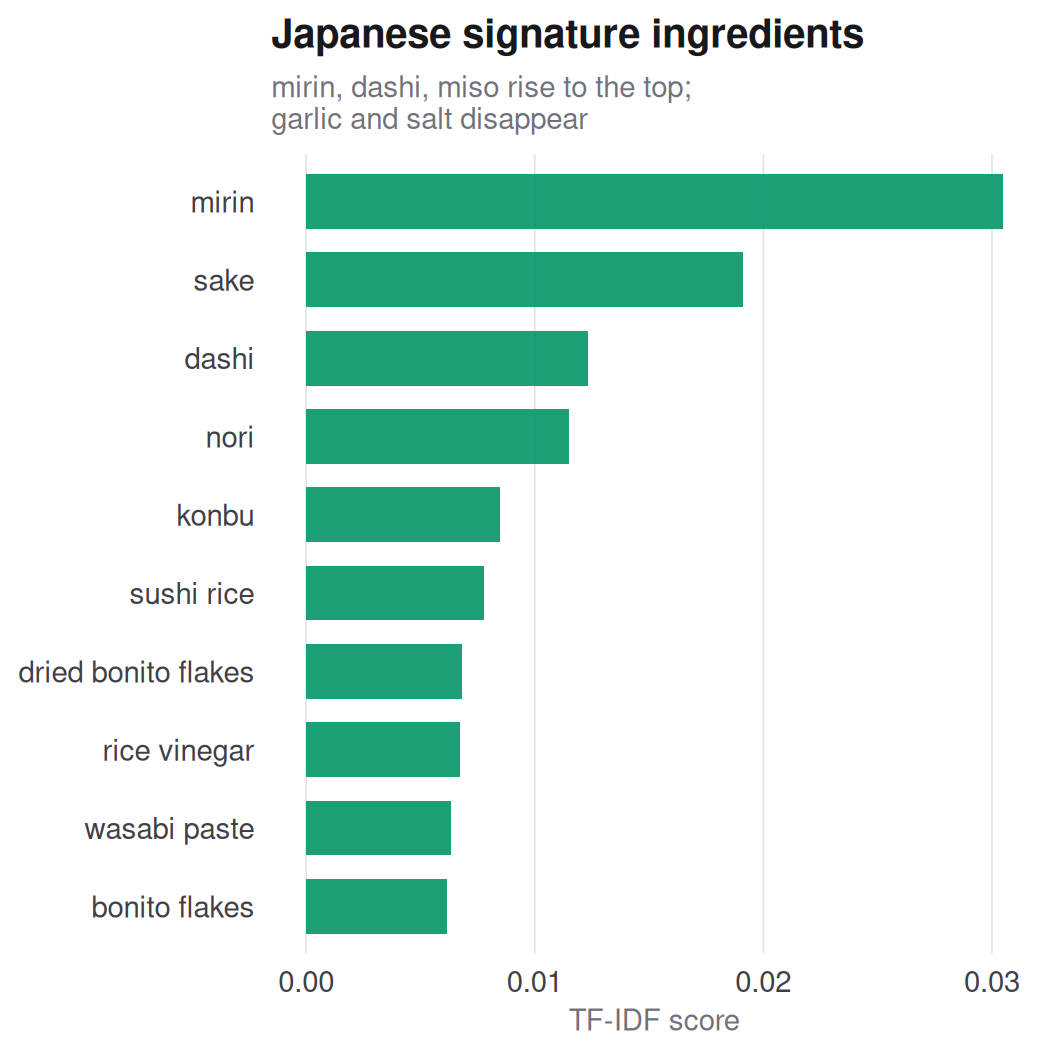
TF-IDF:
Finds ingredients that are frequent in a cuisine but rare elsewhere:
\[\text{TF-IDF}(i,c) = \underbrace{\frac{\text{count}(i,c)}{\text{total}(c)}}_{\text{TF}} \times \underbrace{\log\!\left(\frac{20}{\text{cuisines using } i}\right)}_{\text{IDF}}\]
- Salt → IDF ≈ 0 (all 20 cuisines use it)
- Mirin → high IDF (only Japanese)
Jaccard similarity + UPGMA:
Each cuisine = a binary set of ingredients (present/absent):
\[J(A,B) = \frac{|A \cap B|}{|A \cup B|}\]
- Surprise score = \(J(A,B) \times \frac{\text{geo\_dist}}{\max(\text{geo\_dist})}\) — upweights pairs that are culinarily close despite being far apart