# A tibble: 6 × 20
  FATALITY_ID EVENT_ID FATALITY_TYPE FATALITY_AGE FATALITY_SEX FATALITY_LOCATION
        <dbl>    <dbl> <chr>                <dbl> <chr>        <chr>
1       19771  5339023 D                       67 F            Outside/Open Are…
2       19777  5340059 D                       70 F            Outside/Open Are…
3       19778  5340060 D                       50 M            Outside/Open Are…
4       19779  5340061 D                       51 M            Outside/Open Are…
5       19787  5339351 D                       42 F            Vehicle/Towed Tr…
6       20378  5338230 D                       18 F            In Water
# ℹ 14 more variables: EPISODE_ID <dbl>, STATE <chr>, YEAR <dbl>,
#   MONTH_NAME <chr>, EVENT_TYPE <chr>, CZ_TYPE <chr>, CZ_NAME <chr>,
#   BEGIN_DATE_TIME <dttm>, CZ_TIMEZONE <chr>, END_DATE_TIME <dttm>,
#   INJURIES_DIRECT <dbl>, INJURIES_INDIRECT <dbl>, DEATHS_DIRECT <dbl>,
# DEATHS_INDIRECT <dbl>Storm Event Data Analysis
National Weather Service (NWS)
Elegant Pikachu ϞϞ(๑⚈ ․̫ ⚈๑)Siyuan Tao, Jingruo Chen, Tung-Yen Wang, Claire Xu
2023-12-04
Introduce the topic and motivation
Objective: Explore the relationship between storm types, geographical locations, and storm-related fatalities in the US.
Steps:
- Explore patterns and historical trends in storm behavior.
- Visualize storm characteristics and attribute correlations.
- Identify potential mitigation strategies for storm-related incidents.
- Provide recommendations for future planning practices to mitigate storm risks.
- Present findings through data visualizations and reports.
Project Questions:
What storm types exhibit the highest fatality rates?
How have the characteristics and frequency of storms evolved throughout history?
How have the months of storms influenced the number of fatalities?
Etc.
Introduce the data
Data source: Storm Data from the National Weather Service (NWS).
Storm Data from the NWS provides comprehensive statistics on injuries and damage estimates for U.S. weather incidents from 1950 to the present.
The NCDC Storm Event database categorizes storms by type, state, and date.
Representative years (2003, 2013, 2023) were selected for analysis.
Six datasets were merged, excluding prior years with missing entries and CSV errors in Storm Event Location data.
UI Design Color System
Discrete Color Palette: Classic_Green_Orange_12
Continuous Color Palette: Terrain

Highlights from EDA #1
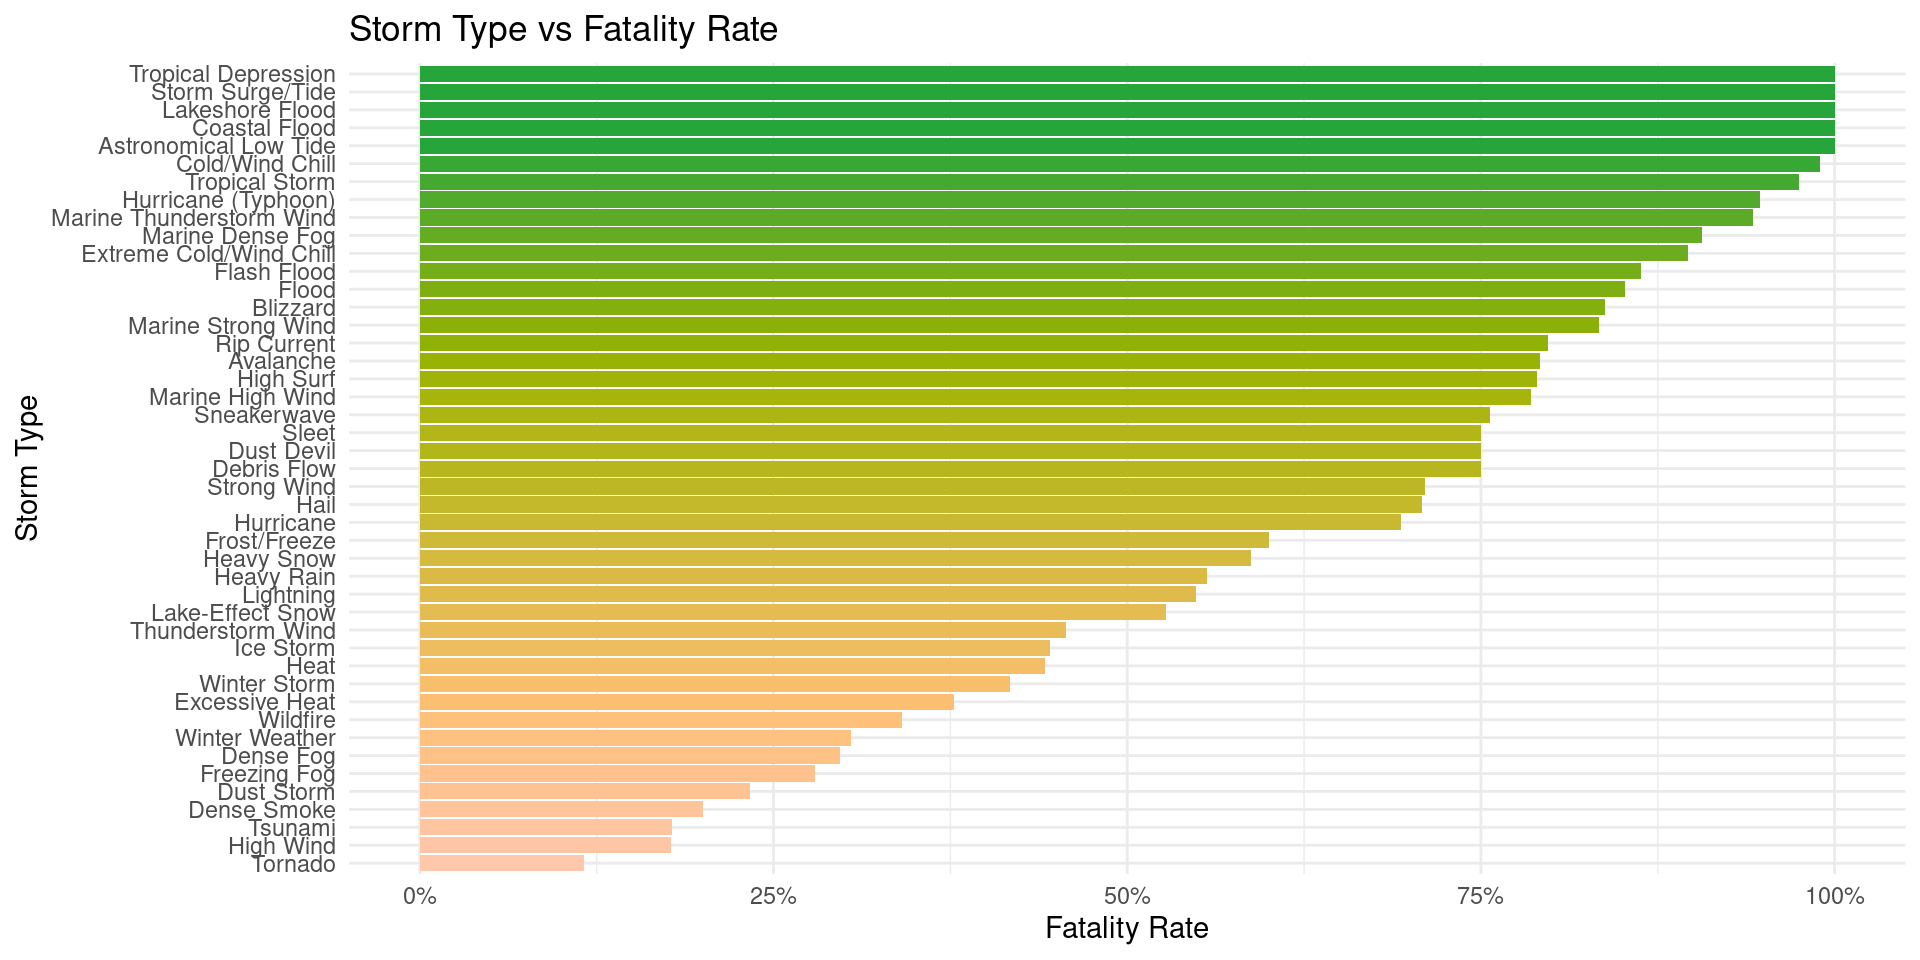
Q1: What storm types exhibit the highest fatality rates?
Highlights from EDA #2
Q4: How have the characteristics of storms and their frequency evolved throughout history?
Highlights from EDA #3
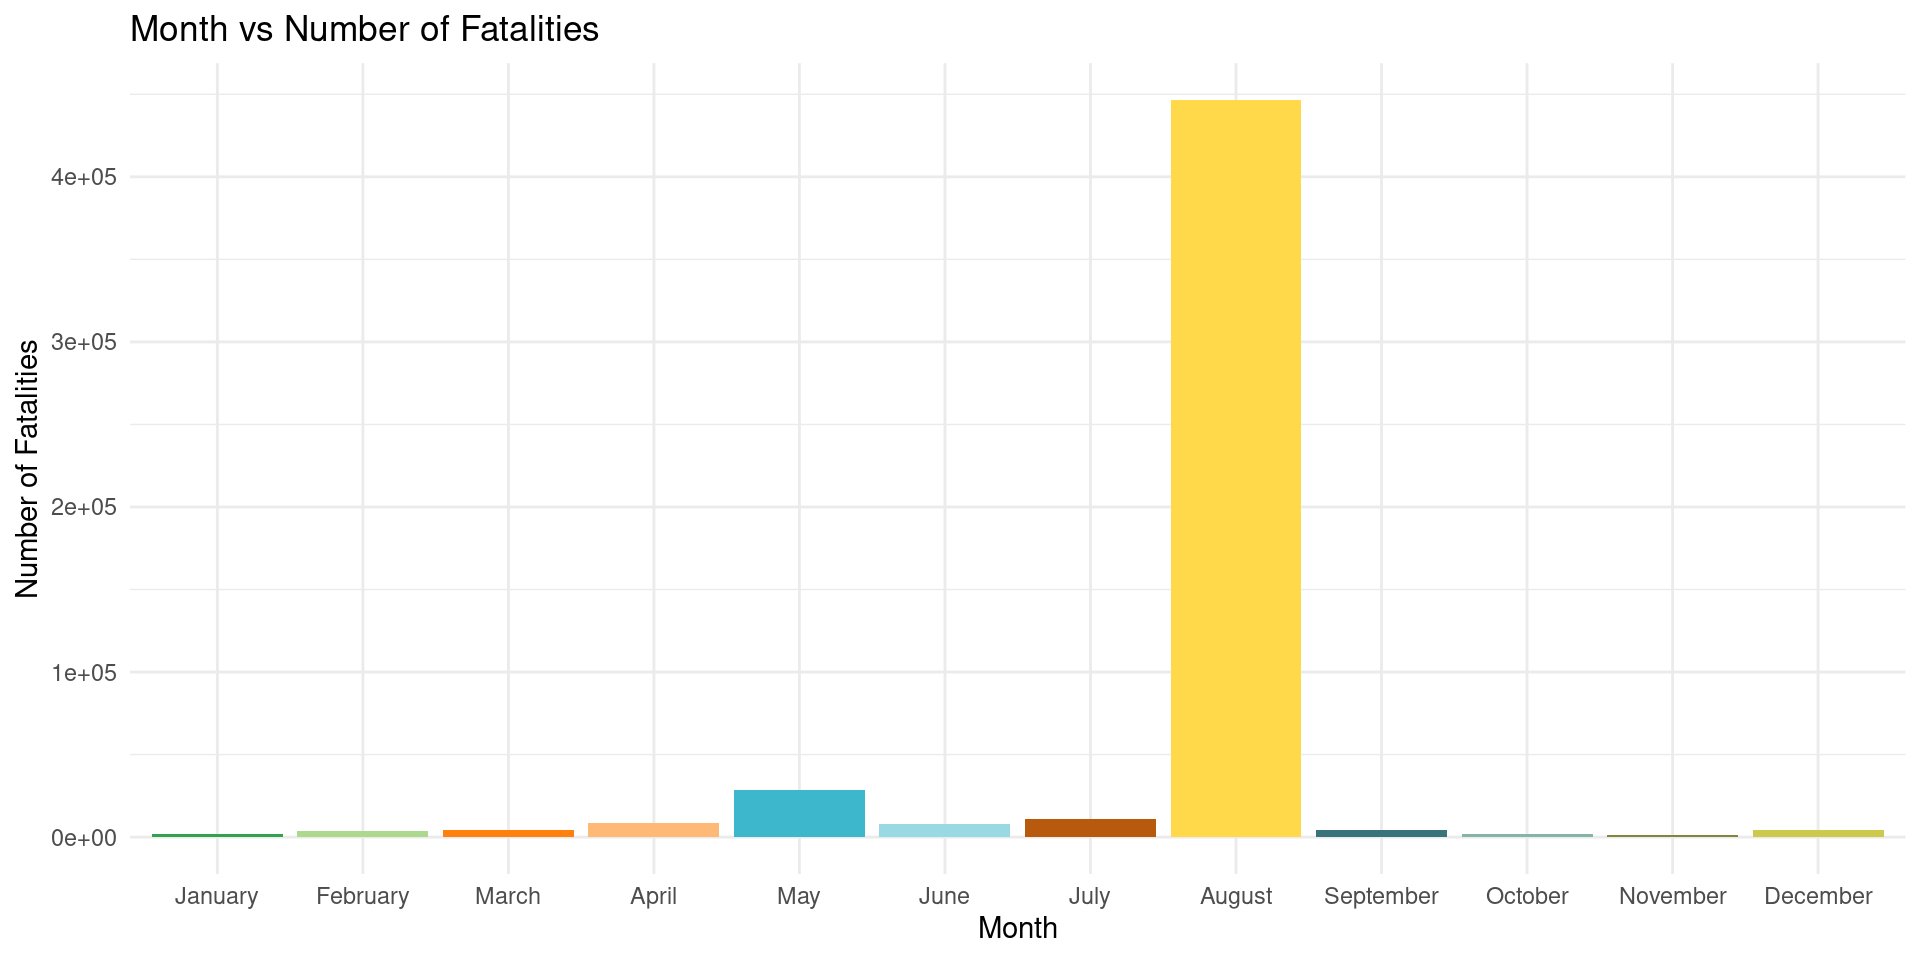
Q6: How have the months of storms influenced the number of fatalities?
Conclusions
- Conclusions (Up until now)
- Storm types with high fatality rates include Coastal Flood, Marine Strong Wind, Hurricane (Typhoon), Heavy Snow, Dust Devil, and Cold/Wind Chill. Notably, Nevada, Oklahoma, and California experience the highest storm-related fatalities, primarily due to wildfires.
- Demographically, individuals aged 36-53 and 72-90 have the highest fatality rates, and males consistently record more fatalities, especially in the 18-35 age group.
- Storms lasting between 0-10,000 and over 100,000 seconds exhibit the highest fatalities, suggesting significant impact at both initial and extended phases. Summer months consistently show the highest fatality rates.
- Future Work
Explore more temporal trends and investigate prevention methods to mitigate risks.
Deepen analysis of the correlation between storm events and regions.
Integrate machine learning algorithms to gain actionable insights to reduce storm-related fatalities.
Thank you for listening! ϞϞ (๑⚈ ․̫ ⚈๑)
