Table of Contents
Lab1: Light Following Robot Part 1
Introduction
For this lab, I created two light sensing circuits. To do this, I utilized two ADC pins on the Arduino Nano Every, along with two photoresistors and 10kOhm resistors. The circuit allowed the microcontroller to determine how bright it was in the directions in which the photoresistors were facing. In the next Lab, I will use this feature to help the robot turn to face and move toward a bright light source.
Lab 1 Design
Materials
- Two 10kOhm resistors
- Two CDS photoresistors
- Breadboard
- Arduino Nano Every
- Robot Frame
Hardware
The circuit used to determine directional brightness was a voltage divider that used a photoresistor in the pull-up network, and a 10kOhm resistor in the pull down network.
The middle node of this circuit is fed to an analog pin on the Nano Every which is processed using Analog-to-Digital conversion (ADC). When a bright light is incident on the photoresistor, it’s resistance drops, raising the voltage on the analog pin. On the other hand with no bright present, the photoresistor’s resistance rises, lowering the voltage on the analog pin.
Understanding this, we can process the ADC result according to the equation (1023*Vin)/Vref, and can reason that higher numbered results indicate a brighter light source in the direction of the associated photoresistor.
We know Vin to be the voltage on the Analog pin of interest, but Vref can be set to a couple different things, including an external voltage provided to the Vref pin, an internal 1.1 volt source, or an internal ~5-volt source from the USB connector. The CTRLC register specified in the ATMega4809 data sheet (the microprocessor on the Nano Every) controls which source to use using two ‘REFSEL’ bits. These bits are set to 01 in this lab, indicating a Vref of ~5V from the internal USB connector.
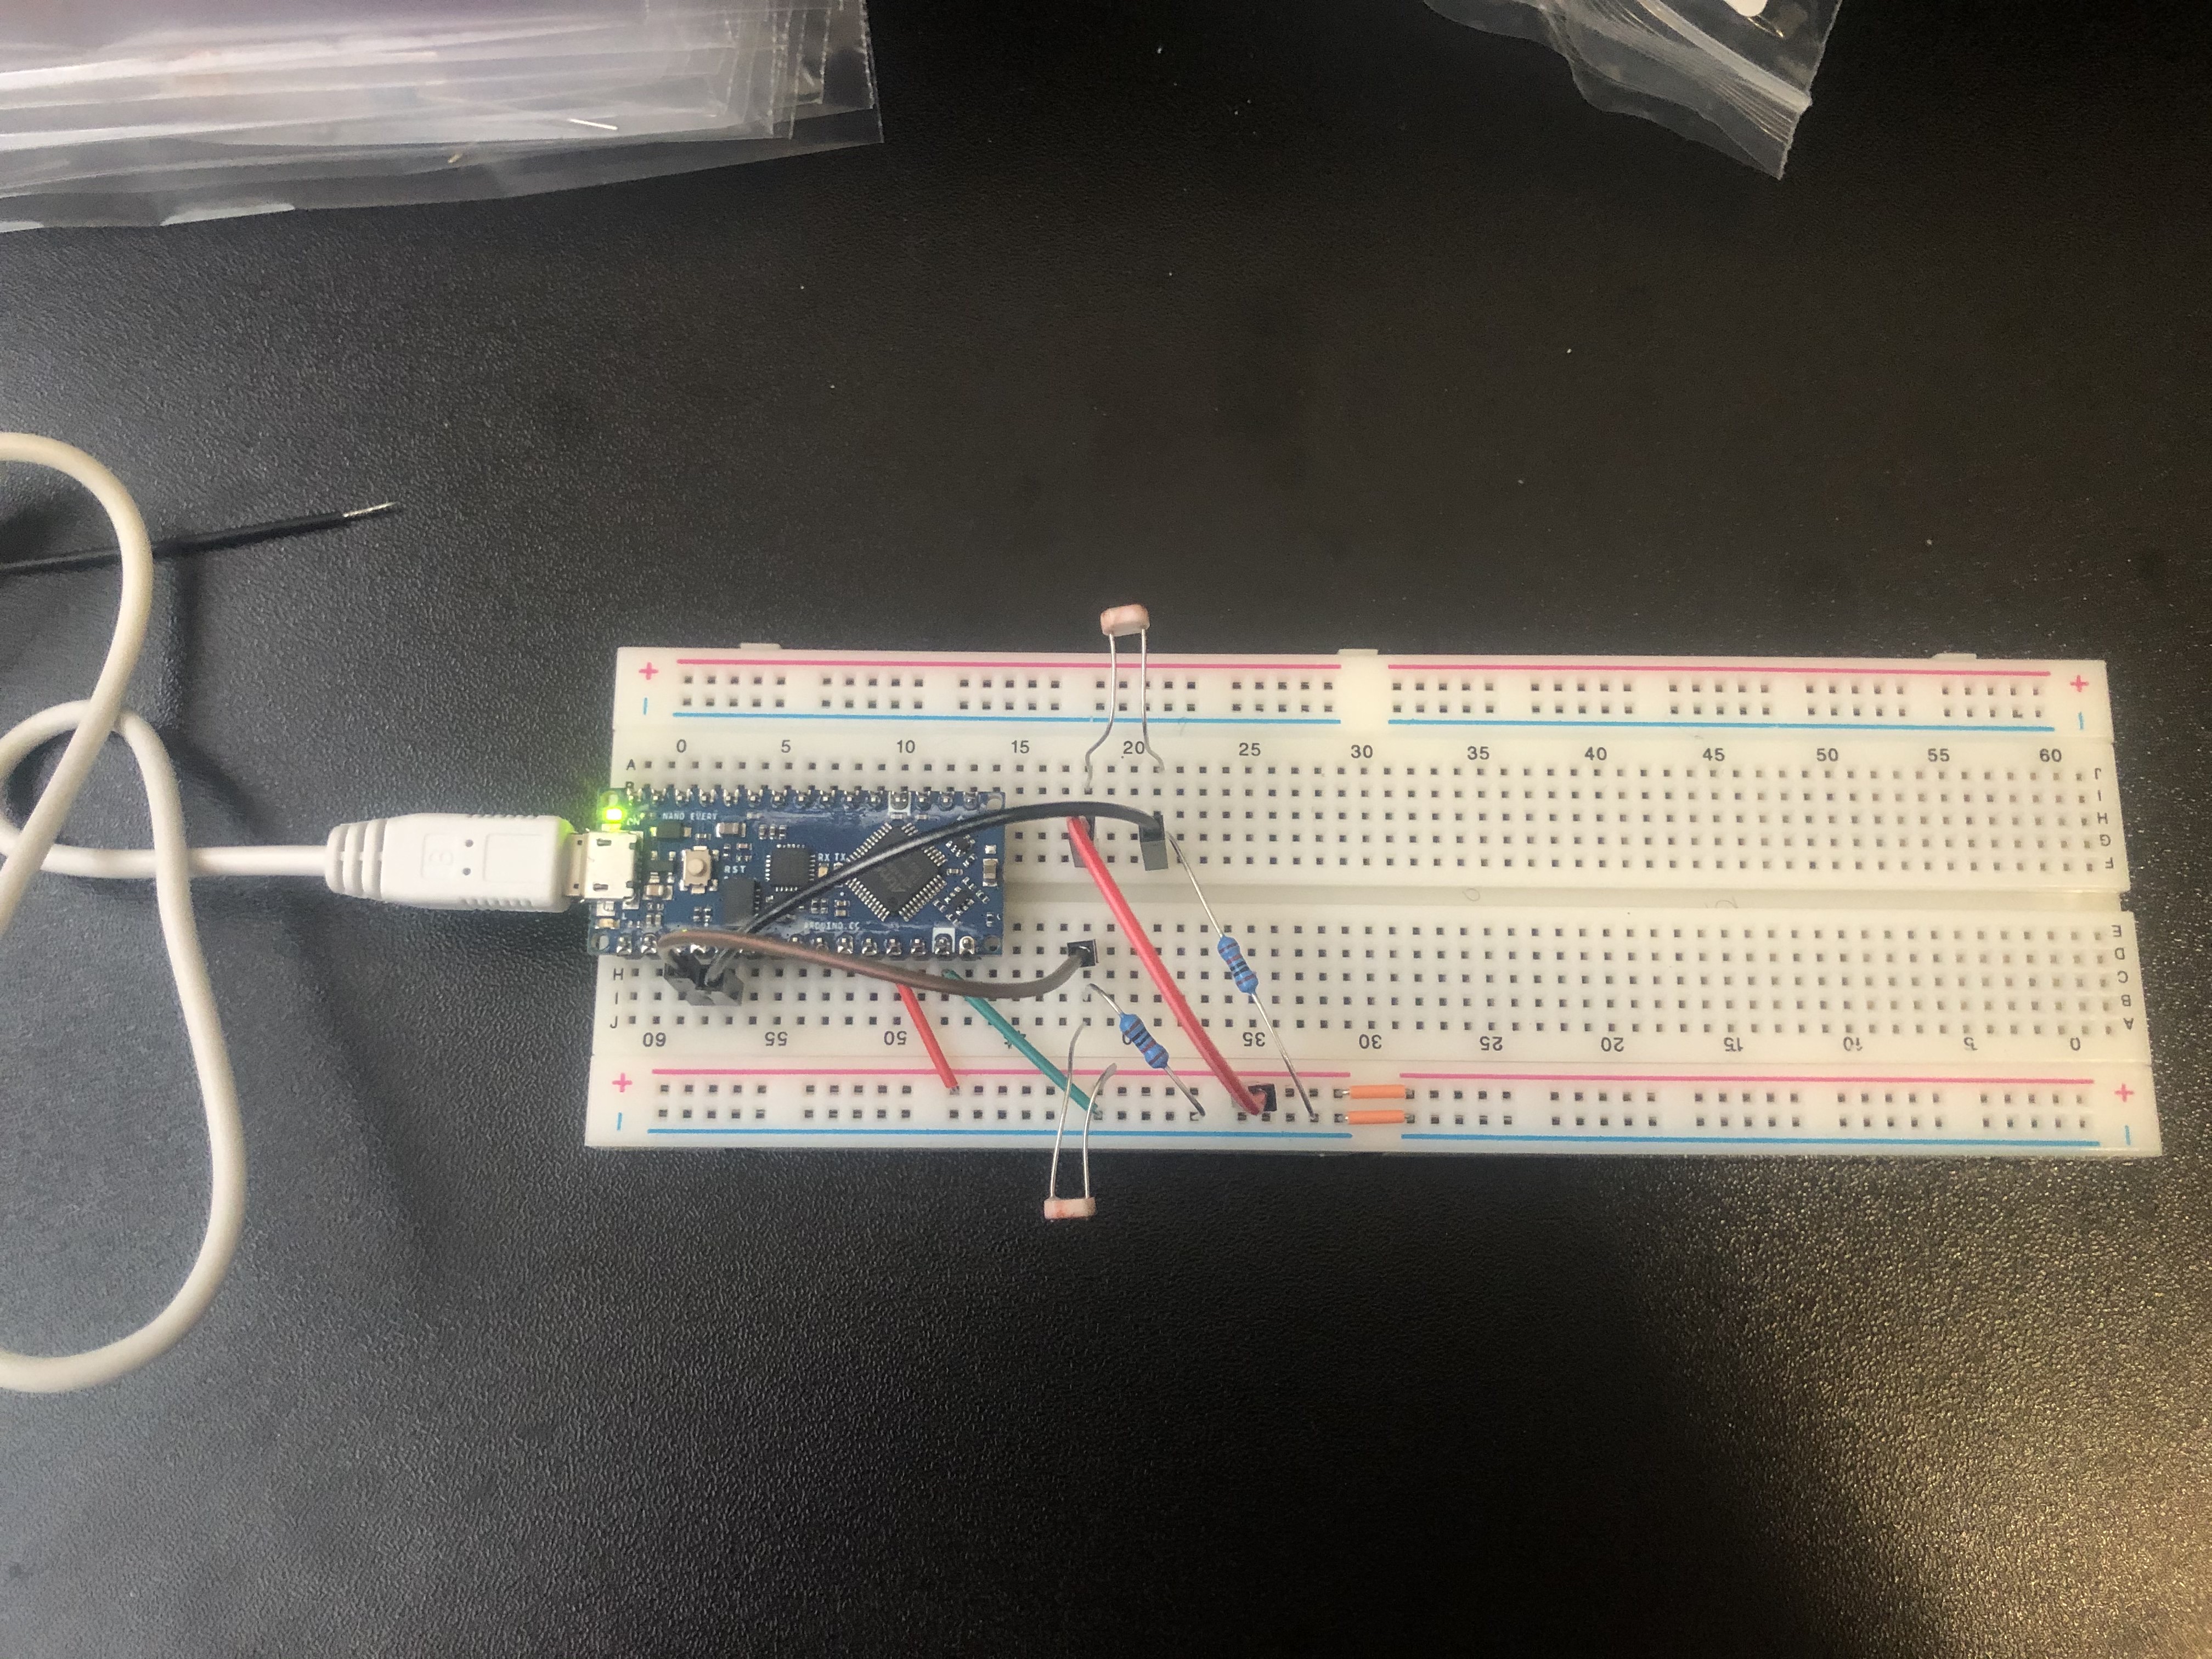
Below the voltage divider circuit described earlier:

And again with both voltage divider circuits.
Software
In order to complete the system, I needed a way to receive and interpret the data coming in from the ADC pins. I read the pins using some standard analogRead calls and normalize the measurements. For this lab, I simply print out the normalized measurements, however, in the future, these measurements will be used to steer the motors.
Lab1 Questions
- Given the 10kOhm resistor, how much current will be drawn by the voltage divider circuit under little illumination and bright illumination?
Under a bright light source, the photoresist has a resistance of about 25 kOhms, this makes the total resistance of the branch 35kOhms and with a Vin of 5 volts, then the current draw is 143 uA. In dark conditions, the photoresist has a resistance of 500kOhms meaning a total resistance of 510kOhms. Thus the current draw is 9.8uA.
- What is Vref?
As mentioned earlier, the Vref should be 5V, according to the CTRLC register connected to Vdd.
- Is Vdd really 5V?
No, after connecting the 3V3 into the analog pin, the reading was 703, this corresponds to 4.80 V for Vdd.
- In bright light, what is the analog pin reading?
If the light was right next to the photoresist, the analog pin was about 1000.
- In ambient light, what is the analog pin reading?
The pin read about 500-600 under ambient conditions.
Lab2: Light Following Robot Part 2
Introduction
In this lab, I created a light following robot that would spin in place by default, but when a bright light source is present the robot would turn to face it and move towards it. To achieve this, beyond what was implemented in Lab 1, I added an L293D chip to serve as an H-bridge circuit for powering two DC motors. This allowed me to drive the motors in either direction by changing the polarity of the voltage, and I can use a pulse width modulated signal to control the speed of the motor. This configuration allowed me to control the motors, and to obtain brightness readings from the photoresistors.
Lab 2 Design
Materials
- L293D H-bridge
- Two 10kOhm resistors
- Two CDS photoresistors
- Two DC Motors
- Three AA batteries
- One 9V battery
- Breadboard
- Arduino Nano Every
- Robot Frame
Hardware
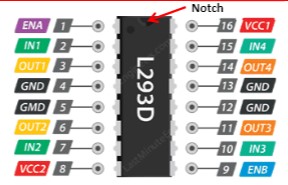
Figure 1: L293D Pinout
The motors are powered with three AA batteries via the L293D integrated circuit. VCC2 is used to connect to the AA batteries to drive the motors, and VCC1 provides internal 5V logic level power to the IC. The EN pins 1 and 9 were connected to PWM-capable pins on the Arduino Nano Every. Each of the driver inputs (Pins 2, 7, 10, 15) were connected to digital pins on the Nano Every. Each of the driver outputs were connected to the motors appropriately, 1Y and 2Y to the same motor, 3Y and 4Y to the other. When 1A and 2A are both HIGH or both LOW, the motor will not turn. As long as the enable PWN signal is not 0% duty cycle, the motor will spin when 1A and 2A have opposite logic levels, and reversing which is which will cause the motor to spin in the opposite direction. The same can be applied to pins 3 and 4.
The same photoresistor circuitry is used as in lab 1, using two voltage dividers with 10 kOhm resistors. The middle node of these dividers are connected to analog pins, which use the ADC to perform analog reads corresponding to the brightness in the direction of that photoresistor. In order to help the robot tell if it was facing the light, the photoresistors were turned about 30 degrees away from the front of the robot on either side.
In order to protect the Arduino, a male-female jumper wire was added in the later stages of the lab to keep the 9V pin far away from the Arduino. (Not shown in the image below as the picture was taken before it was added)

Figure 2: The robot with all of the necessary connections
Software
In order to complete the system in software, I needed to make sure the robot could respond to different lighting conditions appropriately, and that I could blink the onboard LED as specified.
The first step was to setup all of the necessary variables I'd need, as well as configure certain Arduino pins to output mode. This step included defining variables corresponding to pins connected to the H-bridge IC, and constants for different motor speeds. Since the robot is only supposed to turn towards a bright light source, in setup I also run a 2 second long loop in which the robot collects brightness data with no bright light source on and obtains an average ambient light value. This allows the robot to enter the "confused robot" mode where it spins around blinking the LED regardless of how bright the room naturally is. I obtain the brightness values in the same manner as described in lab 1.
I created functions to make the robot turn left, turn right, stop, and move forward. This is simply to make the code easier to read, and is generally good practice since I utilize some of these functions more than once within the code.
To implement the confused robot phase, I check to see if there is a significant difference in brightness between the photoresistors. To do this, I utilized the normalized values of the photoresistors, and check to see if the difference between them is greater than 0.2. This would mean NMleft or NMright was greater than 0.6, and likely a bright light source is present. If not, then the robot turns left repeatedly, beginning the "spinning" part of the specification. I utilize the function millis() as described in lecture to keep track of time. When the current milliseconds is more than 500 greater than the previous millisecond reading, the LED toggles.
If the difference between the two brightnesses is greater than the threshold, then the robot will turn towards the brighter side until the photoresistor readings are nearly equal. This allows the robot to turn to directly face the light source.
After turning to face the light source, the robot enters a loop which moves it forward, so long as the overall brightness is considerably greater than the ambient value of light I calculated earlier in the setup portion of the code. In this stage, I had an issue when testing the robot where the robots move forward function would send the robot curving in different directions, depending on which direction the robot had to turn to face the bright light source. If the robot had been turning left, the position of the caster wheel was such that the left motor needed to be stronger powered than the right, and vice versa. I created two different functions for this, and called them conditionally based on the direction the robot had been spinning prior to the move forward part of the code.

Figure 3: A video demonstration with the working light following system.
Lab3: Arduino FFT
Introduction
For this lab, I performed Fourier analysis in both MATLAB and on the Arduino Nano Every itself to obtain a variety of frequency domain plots. To achieve this, the lab required the implementation of a basic microphone and amplifier circuit. As an exercise of this lab, we also attempted to gain some insight into the experimental results for a variety of different filters.
Lab 3 Design
Materials
- LM358 Op-Amps
- Resistors
- Capacitors
- Electret Microphone
- Breadboard
- Arduino Nano Every
- Jumper wires
- Computer (for MATLAB analysis)
Hardware
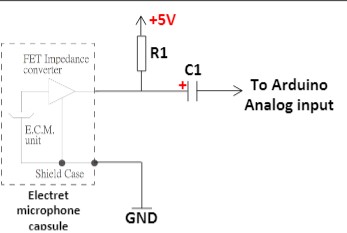
Figure 1: Electret Microphone Circuit
The first part of the lab consisted of building a simple microphone circuit with a pull-up resistor and a capacitor. This signal is not amplified and has quite a bit of noise as a result. The negative terminal of the capacitor goes to an analog pin on the Arduino.
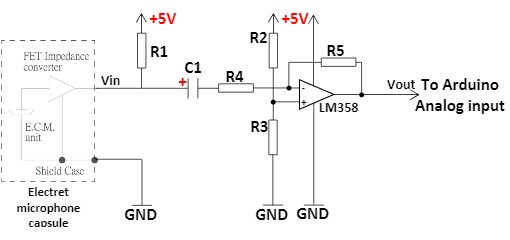
Figure 2: Amplification Circuit
The next portion of the lab had us build an amplification circuit to help resolve the frequency content of signals played into the microphone. This was done using a simple DC biased inverting op amp with a gain of ~ 150. Experimentally, I found that my gain was about 125, based on the height of the 500Hz peak compared to the unamplified signal. The op amp circuit is shown above in Figure 2.
The next portion of the lab had us implement a series of filters, including a passive low and high pass filter, and an active Butterworth band-pass filter. Unfortunately the results of these filters were inconsistent and nonsensical due to the amount of noise present from various portions of the circuit, including the op-amps, and the microphone itself. To implement the low pass filter, we attach a 1.2kOhm resistor to the output of the amplification circuit, and a 0.1uF capacitor from the other side of the resistor to ground. We then attach the intermediate point to the Arduino's analog input. For the high pass filter, the capacitor and resistor simply switch places.

Figure 3: Butterworth Band Pass Filter
The above band pass filter is designed to only pass a frequency band of 500-900Hz. The filter unfortunately did not appear to work as intended.

Figure 6: Unamplified 500Hz Signal in MATLAB
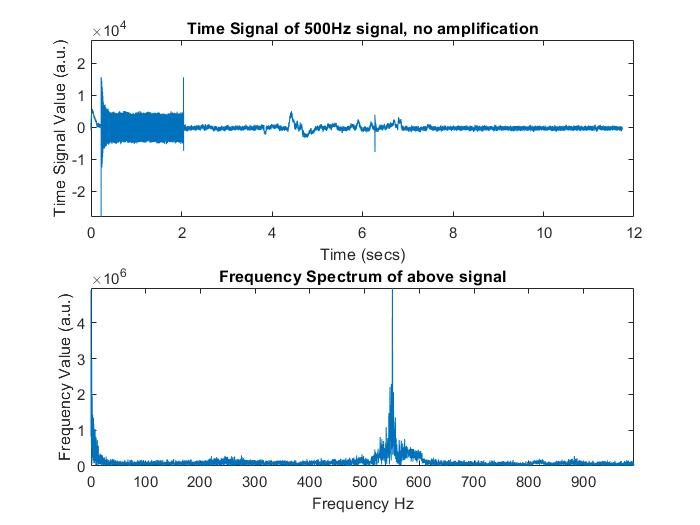
Figure 7: Amplified 500 Hz Singal in MATLAB
Software
For the software component of this lab, there was both an Arduino and a MATLAB portion, as well as a few LTspice simulations.
I first created LTspice simulations for a low pass and high pass filter, but later I created one for the Butterworth band pass filter as well. I used LTspice to obtain theoretical transfer functions for these filters, which would later on be compared to the experimental filters. The theoretical LTspice simulation vs. experimental results plots are shown below for each filter:

Figure 6: Low Pass Filter Results
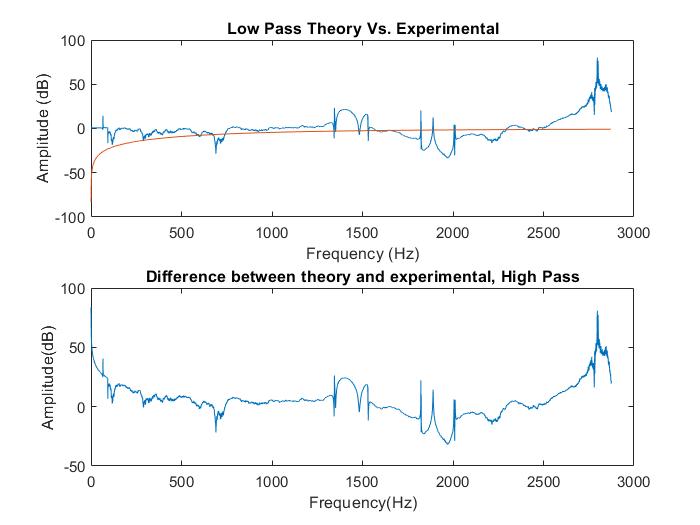
Figure 7: High Pass Filter Results

Figure 8: Butterworth Band Pass Filter Results
In the first part of the lab, we took an FFT in MATLAB of data sent via the Arduino. MATLAB would play a sound using the chirp function, for a particular duration. It would then read a certain number of data points, while keeping track of the duration of the data read. This allowed me to roughly estimate the sampling frequency MATLAB acheived. Thus, I could properly scale the x-axis of the frequency spectrum to go from 0 to the nyquist frequency (fs/2) with the number of points equal to half of the FFT points generated by MATLAB's built-in FFT function. I also used MATLAB to generate plots for each of the specified graphs, including those above for the filters. The Arduino code in the first part involved setting the ADC up in free running mode, and selecting the particular channel that the output of the microphone/amplifier/filter circuit would be connected to. We also initialize a serial connection to allow MATLAB to read data from the Arduino. This code also included functions to read the ADC, and to tell when a ADC conversion has completed. In the loop section of the code, we check if an ADC conversion is done, and if so, we read the ADC, and rescale the output value from 0-1023 to a 16-bit signed int. Then, finally we print this value to the Serial monitor.
In the latter part of the lab, we perform the FFT right on the Arduino, using the ArduinoFFT3 library. In order to get this working, I setup a serial connection and the ADC the exact same as earlier, however this time I save the initial state of the ADC so that we can restore it later on. I also initialize TCA0, which I'll use to generate interrupts at exactly 2400Hz, or every 0.41667 ms. I do this by enabling overflow interrupts, and setting the overflow value/clk prescaler together such that the number of cycles that pass between each interrupt correspond to 0.41667ms. I use an array of 257 values to collect ADC samples, which will ultimately be used to take the FFT. A counter incremented in the TCA ISR allows me to index this array, and also allows the main loop to tell when an adequate number of samples have been taken. Once the counter reaches 257, the ISR no longer takes samples, and the main loop turns off TCA0 altogether, so no more interrupts will occur. At this point, I convert the adc array into 16-bit signed ints, from the current 0-1023 range, and set every other value of the fft_input array to this rescaled value. All of the odd indexed values in the fft_input array are set to zero. The fft is then taken with a series of function calls from the FFT library, and the output array is printed to the serial monitor so we can at least visualize the Arduino FFT in MATLAB. The resulting plots for 500, 700, and 900 Hz signals are shown below:
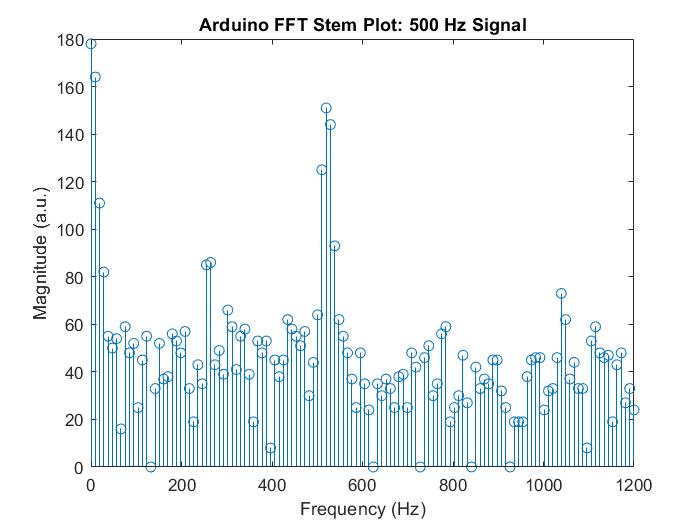
Figure 9: Arduino FFT 500 Hz Signal
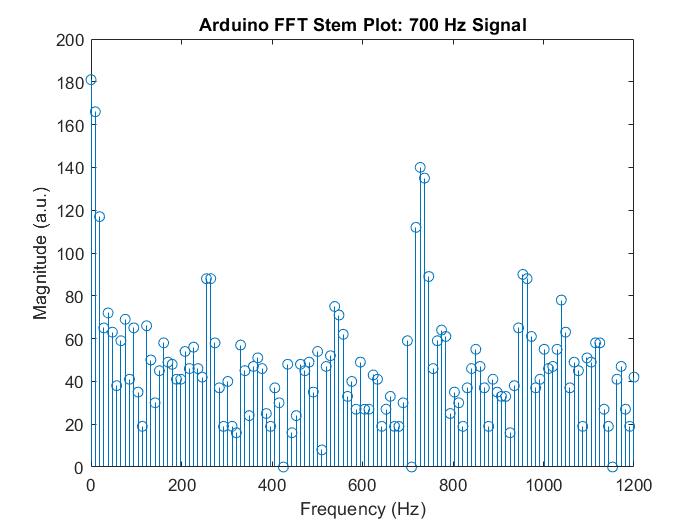
Figure 10: Arduino FFT 700 Hz Signal
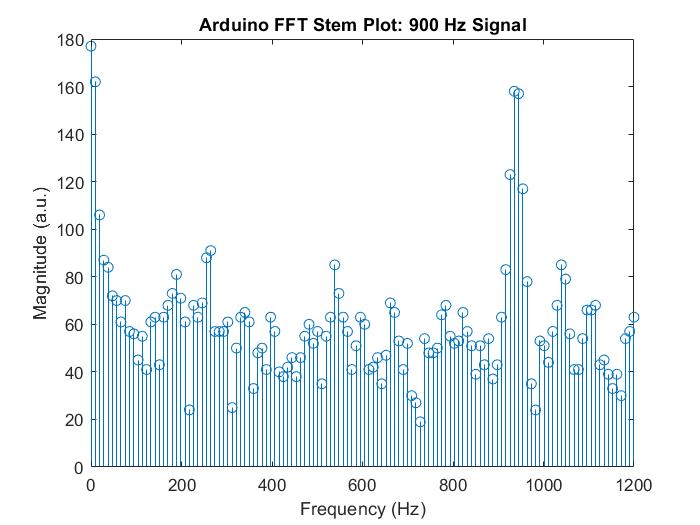
Figure 11: Arduino FFT 900 Hz Signal
Lab4: Ultrasonic Sensor Robot
Introduction
In this lab, I created a robot capable of detecting objects, and their distance from the robot, using an ultrasonic sensor. This enabled my robot to perform basic object detection and avoidance. In part 1 of this lab, I set up two obstacles. As the robot performed one rotation in place, it turned on the LED to indicate that it detects an object at the specified distance. In this portion of the lab, the microphone on the robot was used to take audio samples converted to an FFT in software. This enabled the robot to be activated using a specific frequency. Playing (or singing if your ear is that good) a 550Hz tone will start the robot's spinning motion. In part 2, the robot was required to navigate through a series of obstacles. In this demo, the robot is able to follow light, and avoid hitting objects. It utilizes concepts from lab 2, and lab4 part 1 to do this.
Lab 4 Design
Materials
- LM358 Op-Amps
- Resistors
- Capacitors
- Electret Microphone
- Breadboard
- Arduino Nano Every
- Jumper wires
- Computer (for sound generation)
- Two box shaped obstacles
Hardware
For the Hardware portion of this lab, I set up the Serial interface to the computer to allow for debugging. In addition I configure the ADC the same as was done in lab 3, saving the initial state so that I can restore it once the 550Hz start signal was recognized. I set up up TCA0 differently in this lab, because I was required to use the Arduino functions millis() and micros() to perform timing. This requires TCA0 to be used with a prescaler of 64. As a result, I needed to divide my overflow interrupt period by 64, to ensure that the ADC is still sampled at the same rate as in lab 3 (2400 Hz).
For part 2 of the lab, I did not need to use the timer, or the ADC. The extent of the hardware used was limited to the built-in LED, photoresistors, and the ultrasonic sensor.
Software
For the software component of Lab 4 part 1, the robot takes an FFT continuously until the robot recognizes a 550Hz signal. A counter is used to help the robot determine when enough samples have been gathered. Once enough samples have been collected, TCA0 interrupts are temporarily disabled, and the FFT is calculated. I then then if the few bins corresponding to ~550 Hz, give or take a few Hz, are above a threshold value. IF not the robot turns interrupts back on, and takes another FFT. If so, then a 550Hz signal is considered to be present and the robot begins phase 2.
In phase 2, the robot spins around in a circle once, all while collecting ultrasonic sensor data. Triggering an ultrasonic sensor read requires specific timing, and I utilized the function micros() to get the correct pulse widths, and the function millis() to ensure I did not trigger a read too often. Using the data collected, I converted that data to centimeters, and if the distance was within one of two specified ranges where obstacles were supposed to be placed, I turned the built-in LED on. If the distance exited these ranges, I turned the LED back off. Once the robot had been turning for 4.5 seconds, it comes to rest in a while(1) loop.
For Lab4 part 2, the demo required a lot of different events to occur under different conditions. To achieve this, I use states to code the robot and make it do what it should, at the right time. For example, once the robot approaches obstacle 1 the first time, it should not be able to be lured left, so I indicate in my code that if I am in that certain state, then the robot should not respond to a bright light coming from the left. In order to sense light and move the robot accordingly, I reuse much of the same code from lab2. In order not to run into objects, I read distances from the ultrasonic sensor, and if it is less than 5 cm away, the robot stops moving forward toward the light.
The final demo for the lab is shown below: