Tiffany's ECE 3400 webpage
Welcome to my robot-building documentation for Intelligent Physical Systems!
Lab 2: Filtering and FFT
Summary:
In this lab, implemented the audio processing functionality of our robot. The robot must listen for a specific frequency which will trigger it to begin navigating the maze. We also implemented an override start button in case the audio trigger malfunctions during the demo.
Task List:
- Simulate low and high pass filters in LTSpice
- Assemble microphone circuit
- Build an amplifier for the microphone
- Perform FFT on the Arduino
- Implement an override start button
Part 1 - Simulating low and high pass filters
To begin, we simulated the behavior of low and high pass filters using the LTSpice software. We first created a low pass filter with a capacitor value of 0.1 uF and a resistor value of 1.2 kOhms. Then, we graphed the circuit’s response to different AC frequencies as shown below:
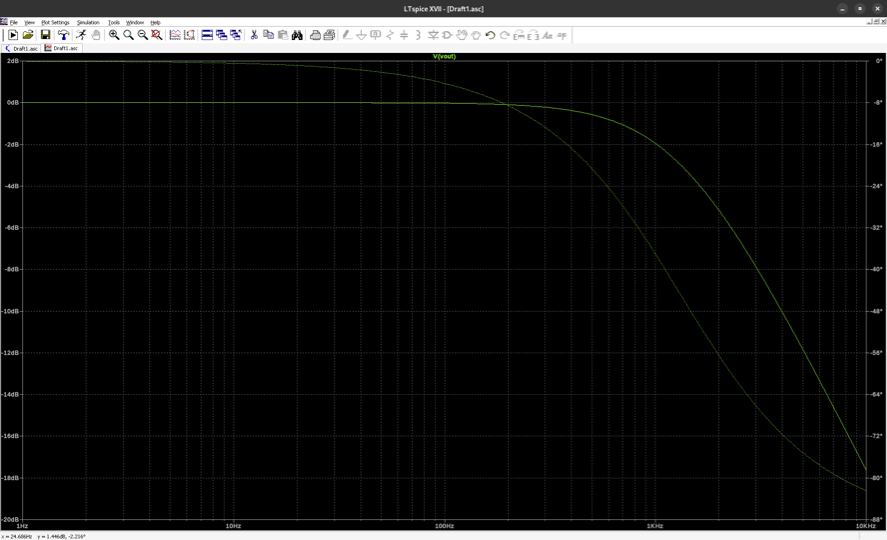
The cutoff frequency as determined from the graph at -3dB is 1.33 kHz.
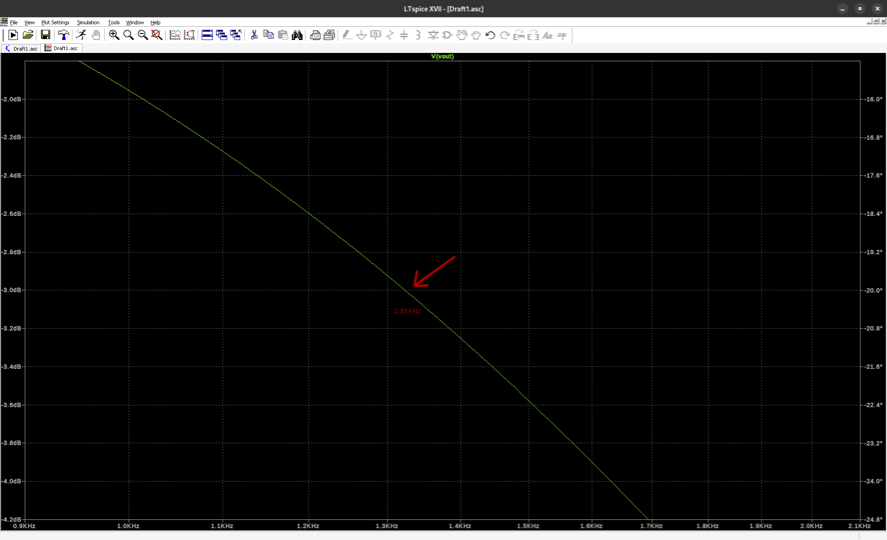
To confirm this observation, we can use the equation 1/(2πRC) to calculate the expected cutoff frequency. Plugging in our values of R and C, 1/(2π x 3.3E3 x 0.1E-6) = 1326.29, which confirms our observed value of 1.33 kHz.
Next, we created a high pass filter with the same capacitor and resistor values as before. We again graphed the circuit’s frequency response, as shown below:
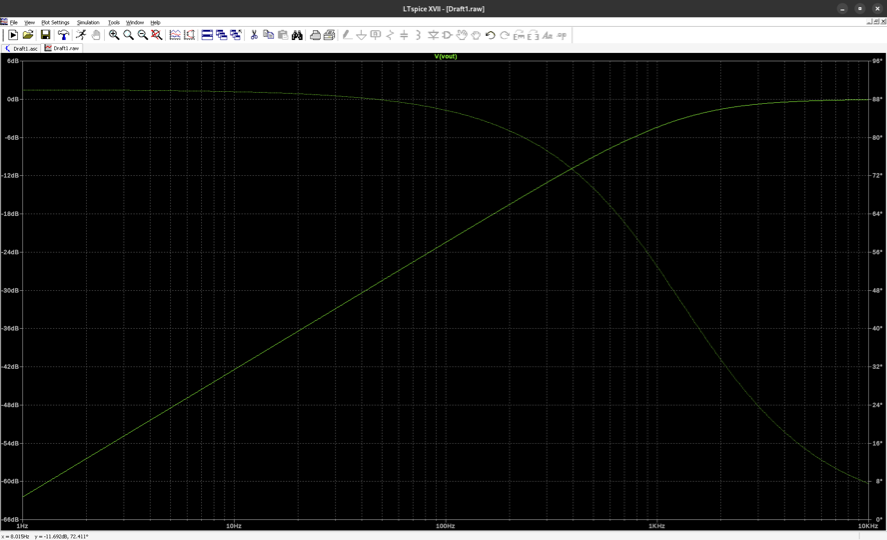
The cutoff frequency observed from the graph at -3dB is 1.33 kHz.
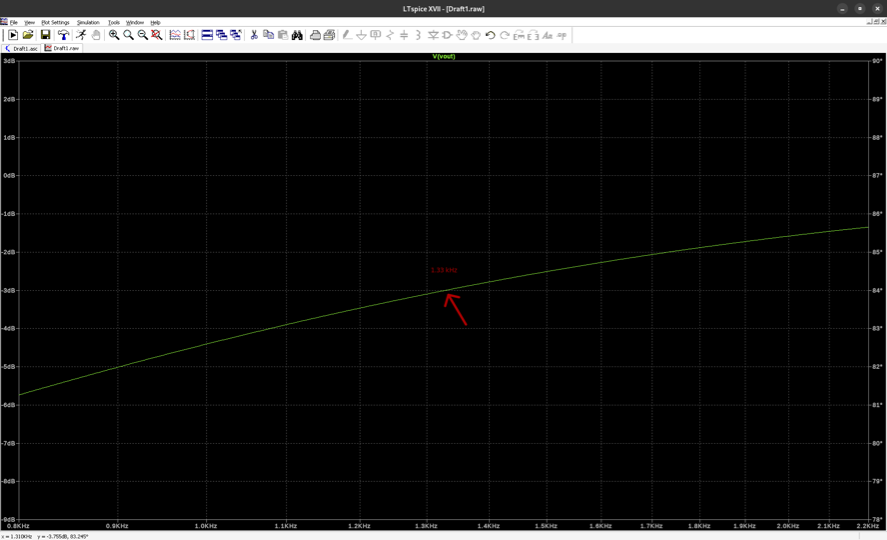
This value makes sense, since we didn’t change the R or C values, and the cutoff frequency equation is the same.
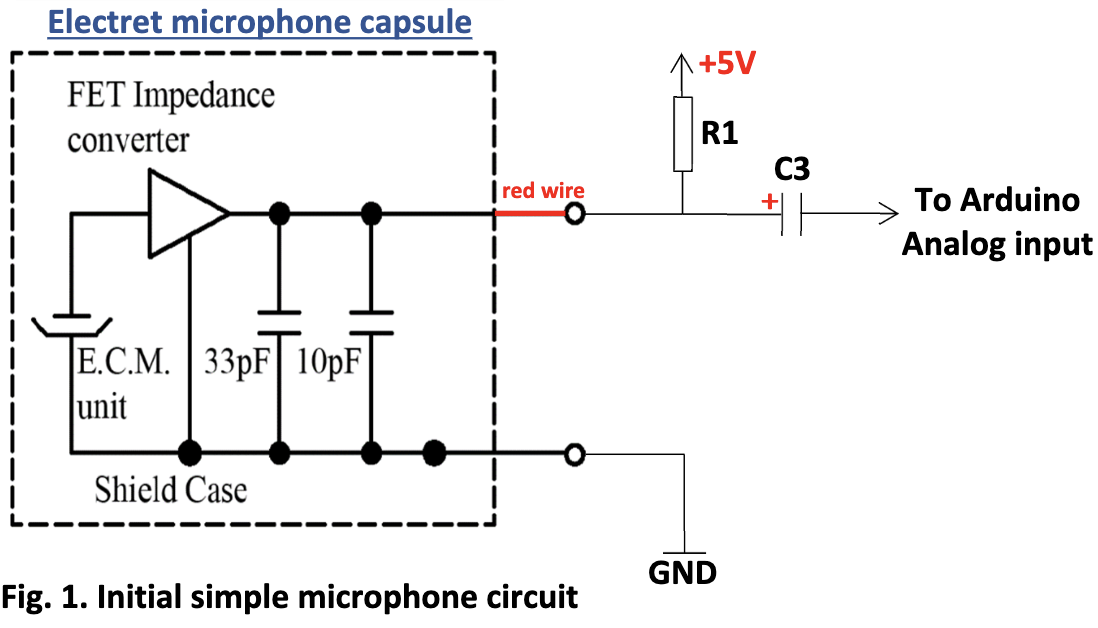
Part 2 - Microphone circuit
Components of the microphone circuit:
- Microphone
- 4.02kOhm Resistor
- 0.22uF Capacitor
Here is the circuit diagram:
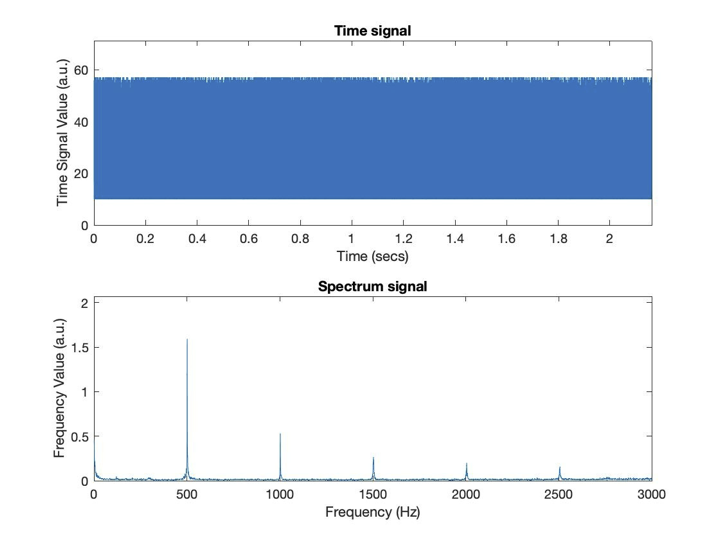
After assembling the phototransistor circuit, we verify its functionality by playing a frequency and plotting the Fourier transform of the waveforms detected by the microphone. To receive data from the microphone, we set up the ADC on the Arduino witb Free Running Mode and read its value using ADC0_read(). The audio frequency detected by the microphone is generated from another laptop running our Matlab code. In Matlab, we generate a tone of slightly increasing frequency, the value of which we can control. We start out by generating a 500Hz tone and plotting the Fourier transform of the detected waveform using our Matlab program. The result is as follows:
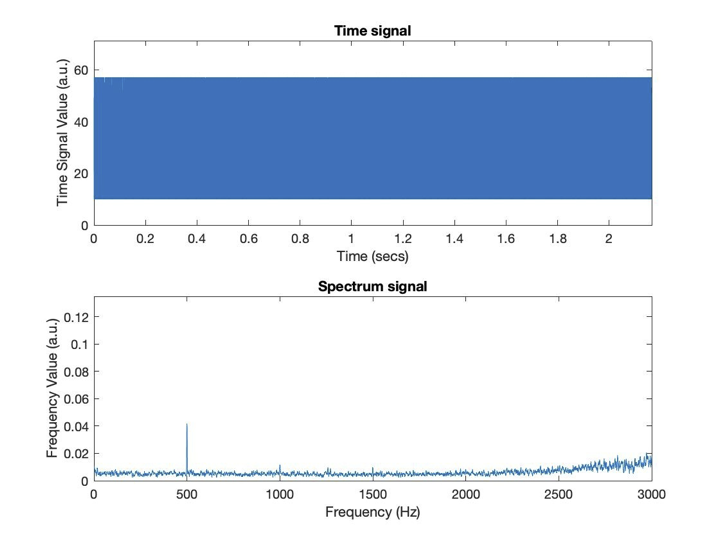
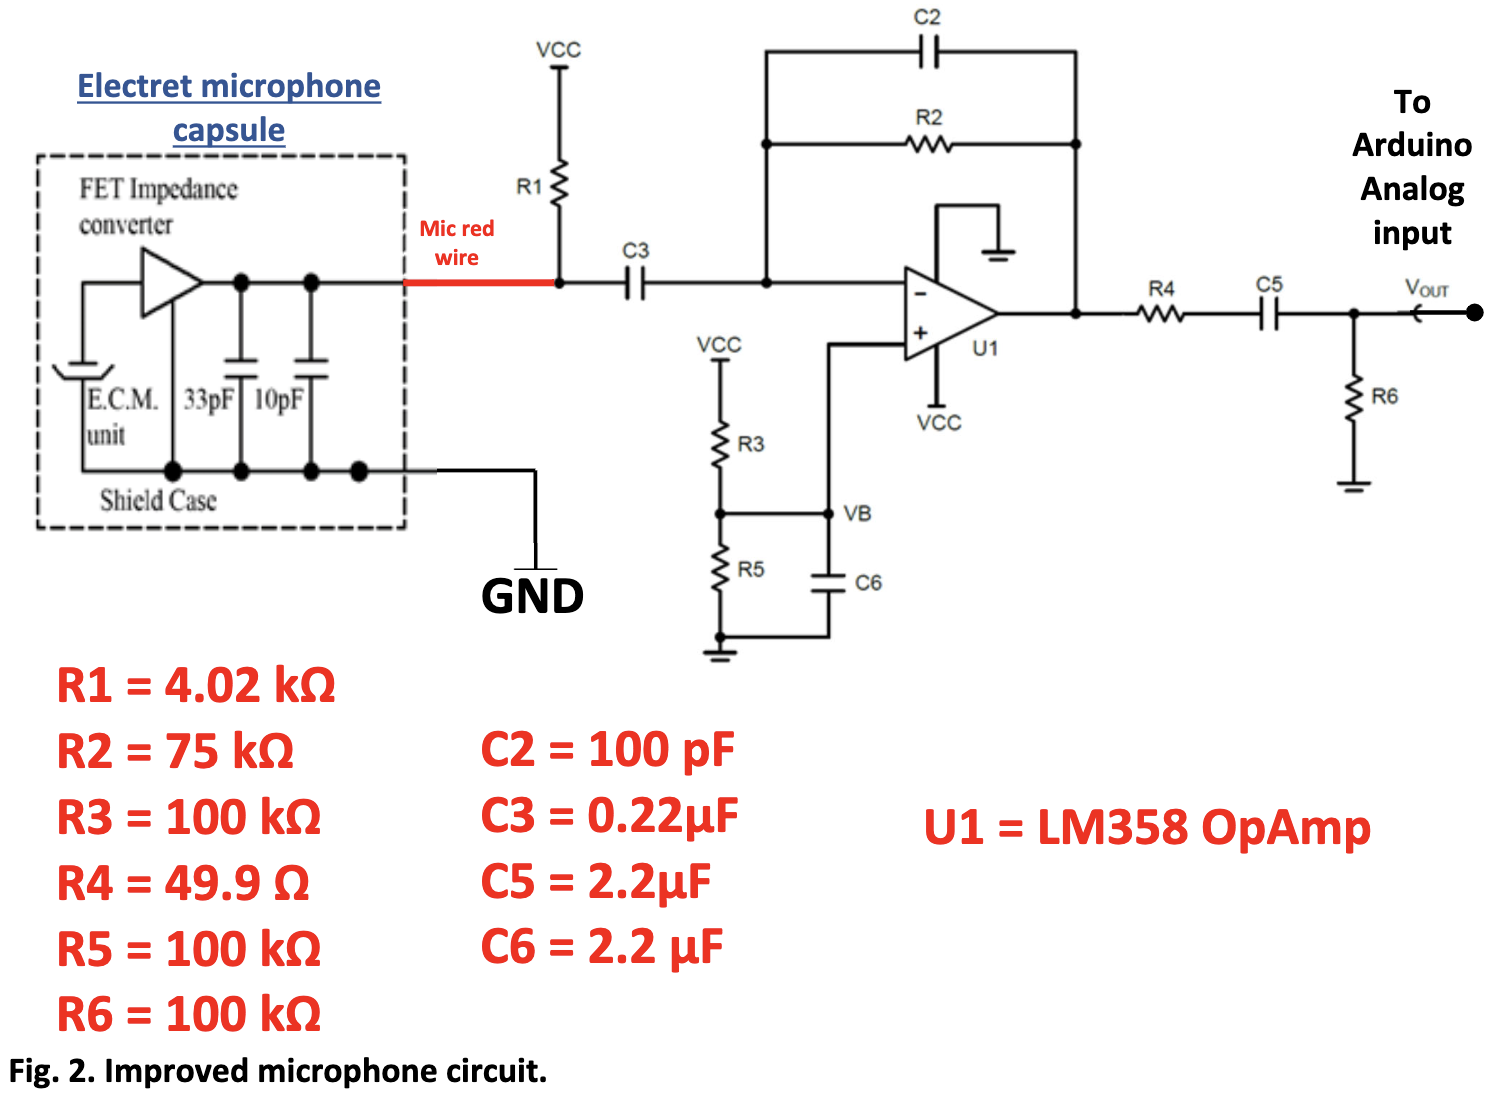
Part 3 - Amplifier circuit
As evidenced by the above plot, the 500 Hz signal detected by the microphone is not very strong. In order to amplify this signal, we incorporate an amplifier circuit using a LM358 op-amp. Here is the circuit diagram for our amplifier circuit:
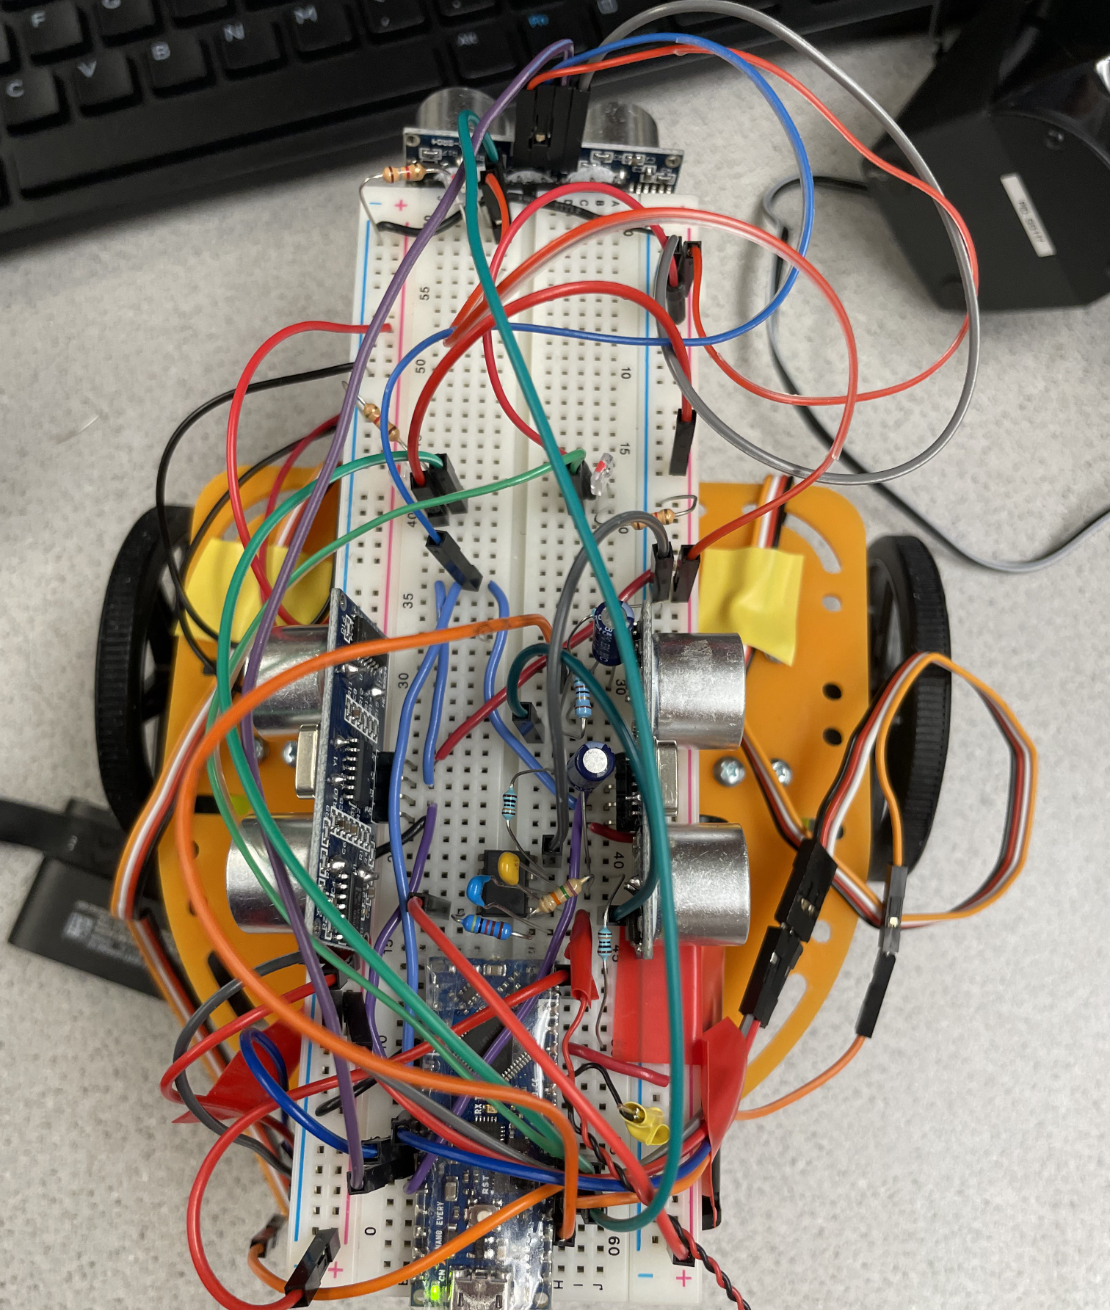
Here is what our breadboard looks like after building the amplifier circuit. To conserve space, we fit the circuit into the space between the ultrasonic sensors and the Arduino.
Using this amplifier circuit, we repeat the above test to have the microphone pick up a 500Hz frequency. This time, the Fourier transform plot looks like this:
As you can see, the amplifier circuit was very effective in magnifying the signals we are interested in, making it easier for us to analyze and process the microphone input.
Part 4 - Amplifier circuit
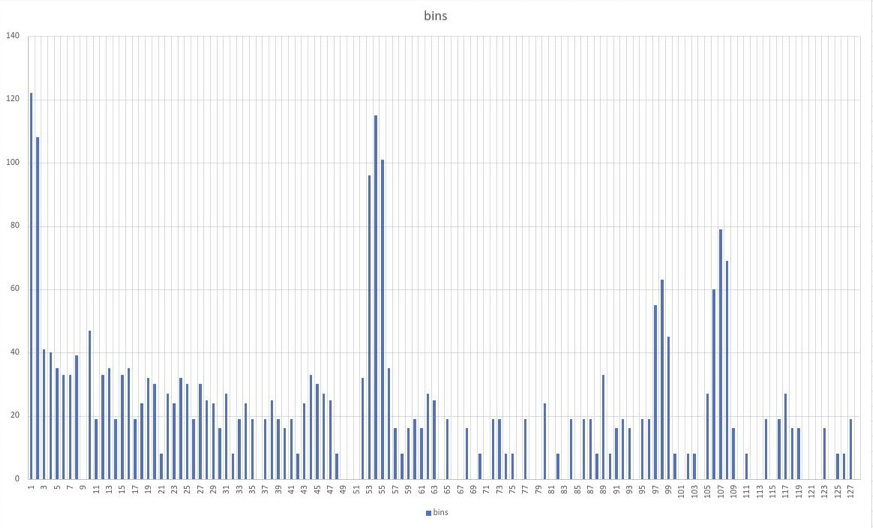
Up until now, we have been using Matlab on my laptop to analyze and visualize the Fourier transform of the audio signal. However, the Arduino must ultimately be able to perform the Fourier analysis of the input frequencies by itself. To do this, we imported a Fast Fourier Transform Arduino library. For the input to the FFT, we sampled 257 ADC values using interrupts on the TCA with an interrupt interval of 0.41667ms. The TCA is set to normal mode with overflow interrupt and event counting disabled, and it uses a clock division of 64. After 257 samples, the TCA is disabled and FFT is performed. Omitting the first value, we have 256 values, corresponding to 256 bins. Since the FFT is symmetrical, we only consider the first 128 bins. After using the FFT library to perform a Fourier transform, the output is analyzed and plotted in Matlab. We generated spectrums for the following frequencies:
500Hz:
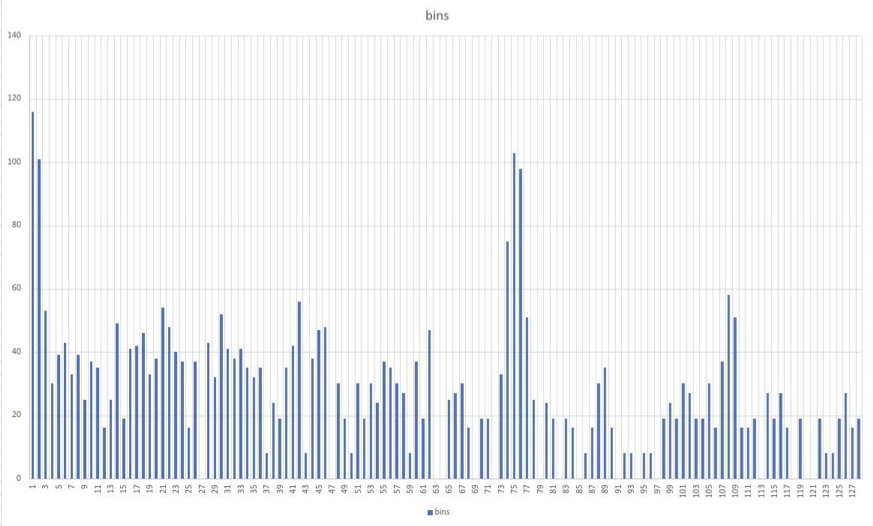
700Hz:
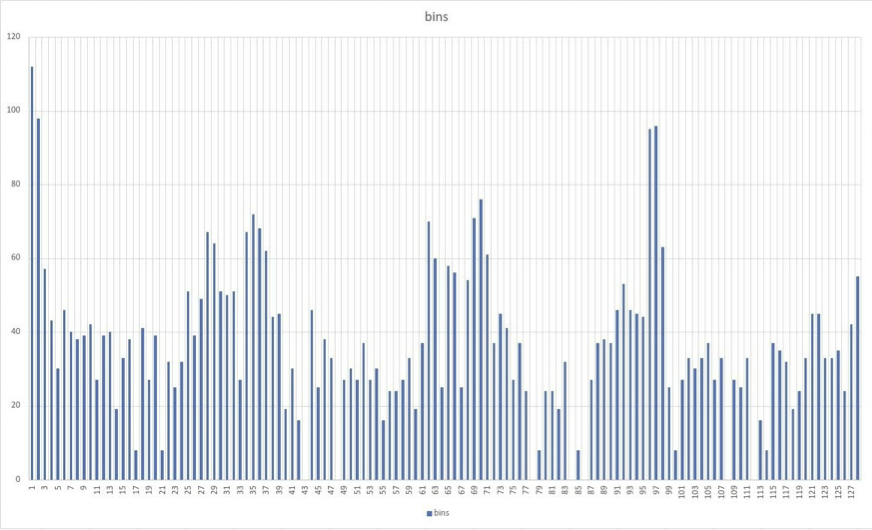
900Hz:
Part 5 - Override start button
The plan is for the robot to begin moving upon detecting a trigger frequency; however, we are also equipped with a backup plan. In case the sound detection fails during our demo, we will press an override start button to start the robot. After testing the functionality of the button, we wrote code to combine the audio detection component with the button. If either the trigger frequency is detected or the button is pressed, we will print a message to the serial monitor. In the code for our final demo, we will simply trigger the start of our navigation algorithm instead of printing a message.
Thanks for reading! Come back next week for more~