Phototransistors & Display
Description
In this lab, we built IR light detection circuit on breadboard. We tested the IR detection using IR light emitting circuit, oscilloscope, and Nano. In the second part of this lab, we worked on a 4-digit 7-segment display for the display component of the base station.
Part 1: Light Detection and Frequency Measurement
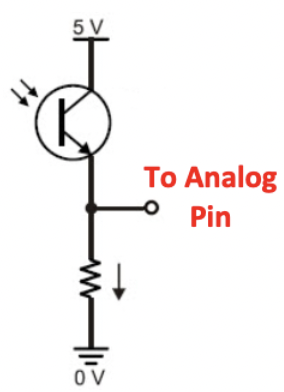
The robot is expected to detect “treasures”, which are infrared (IR) LEDs while navigating the maze. To measure the IR signals, we built detection circuit that consists of phototransistors and resistors. As shown in Fig.1, the collector side of the phototransistor is connected to the +5V Vdd and the emitter side is connected to analog pin and 2.2 k ohm resistor. The voltage measured by the analog pin is determined by the amount of light hitting the phototransistor.
The treasure we used is a small circuit with IR LED powered by signal generator. On the signal generator, we first set the frequency of sinusoidal waveform to 1k Hz and peak-to-peak voltage to 1.2 V. Then we used oscillsocope to observe voltage waveform of IR LED and phototransistor. On oscilloscope, we have CH1 measuring the signal generated by signal generator and CH2 measuring the voltage between emmiter side of phototransistor and GND. You can see from the video that shows how phototransistor responded when IR LED is placed at different distances fron the phototransistor. As IR LED gets closer to the phototransistor, the amplitude of CH2 would increase.
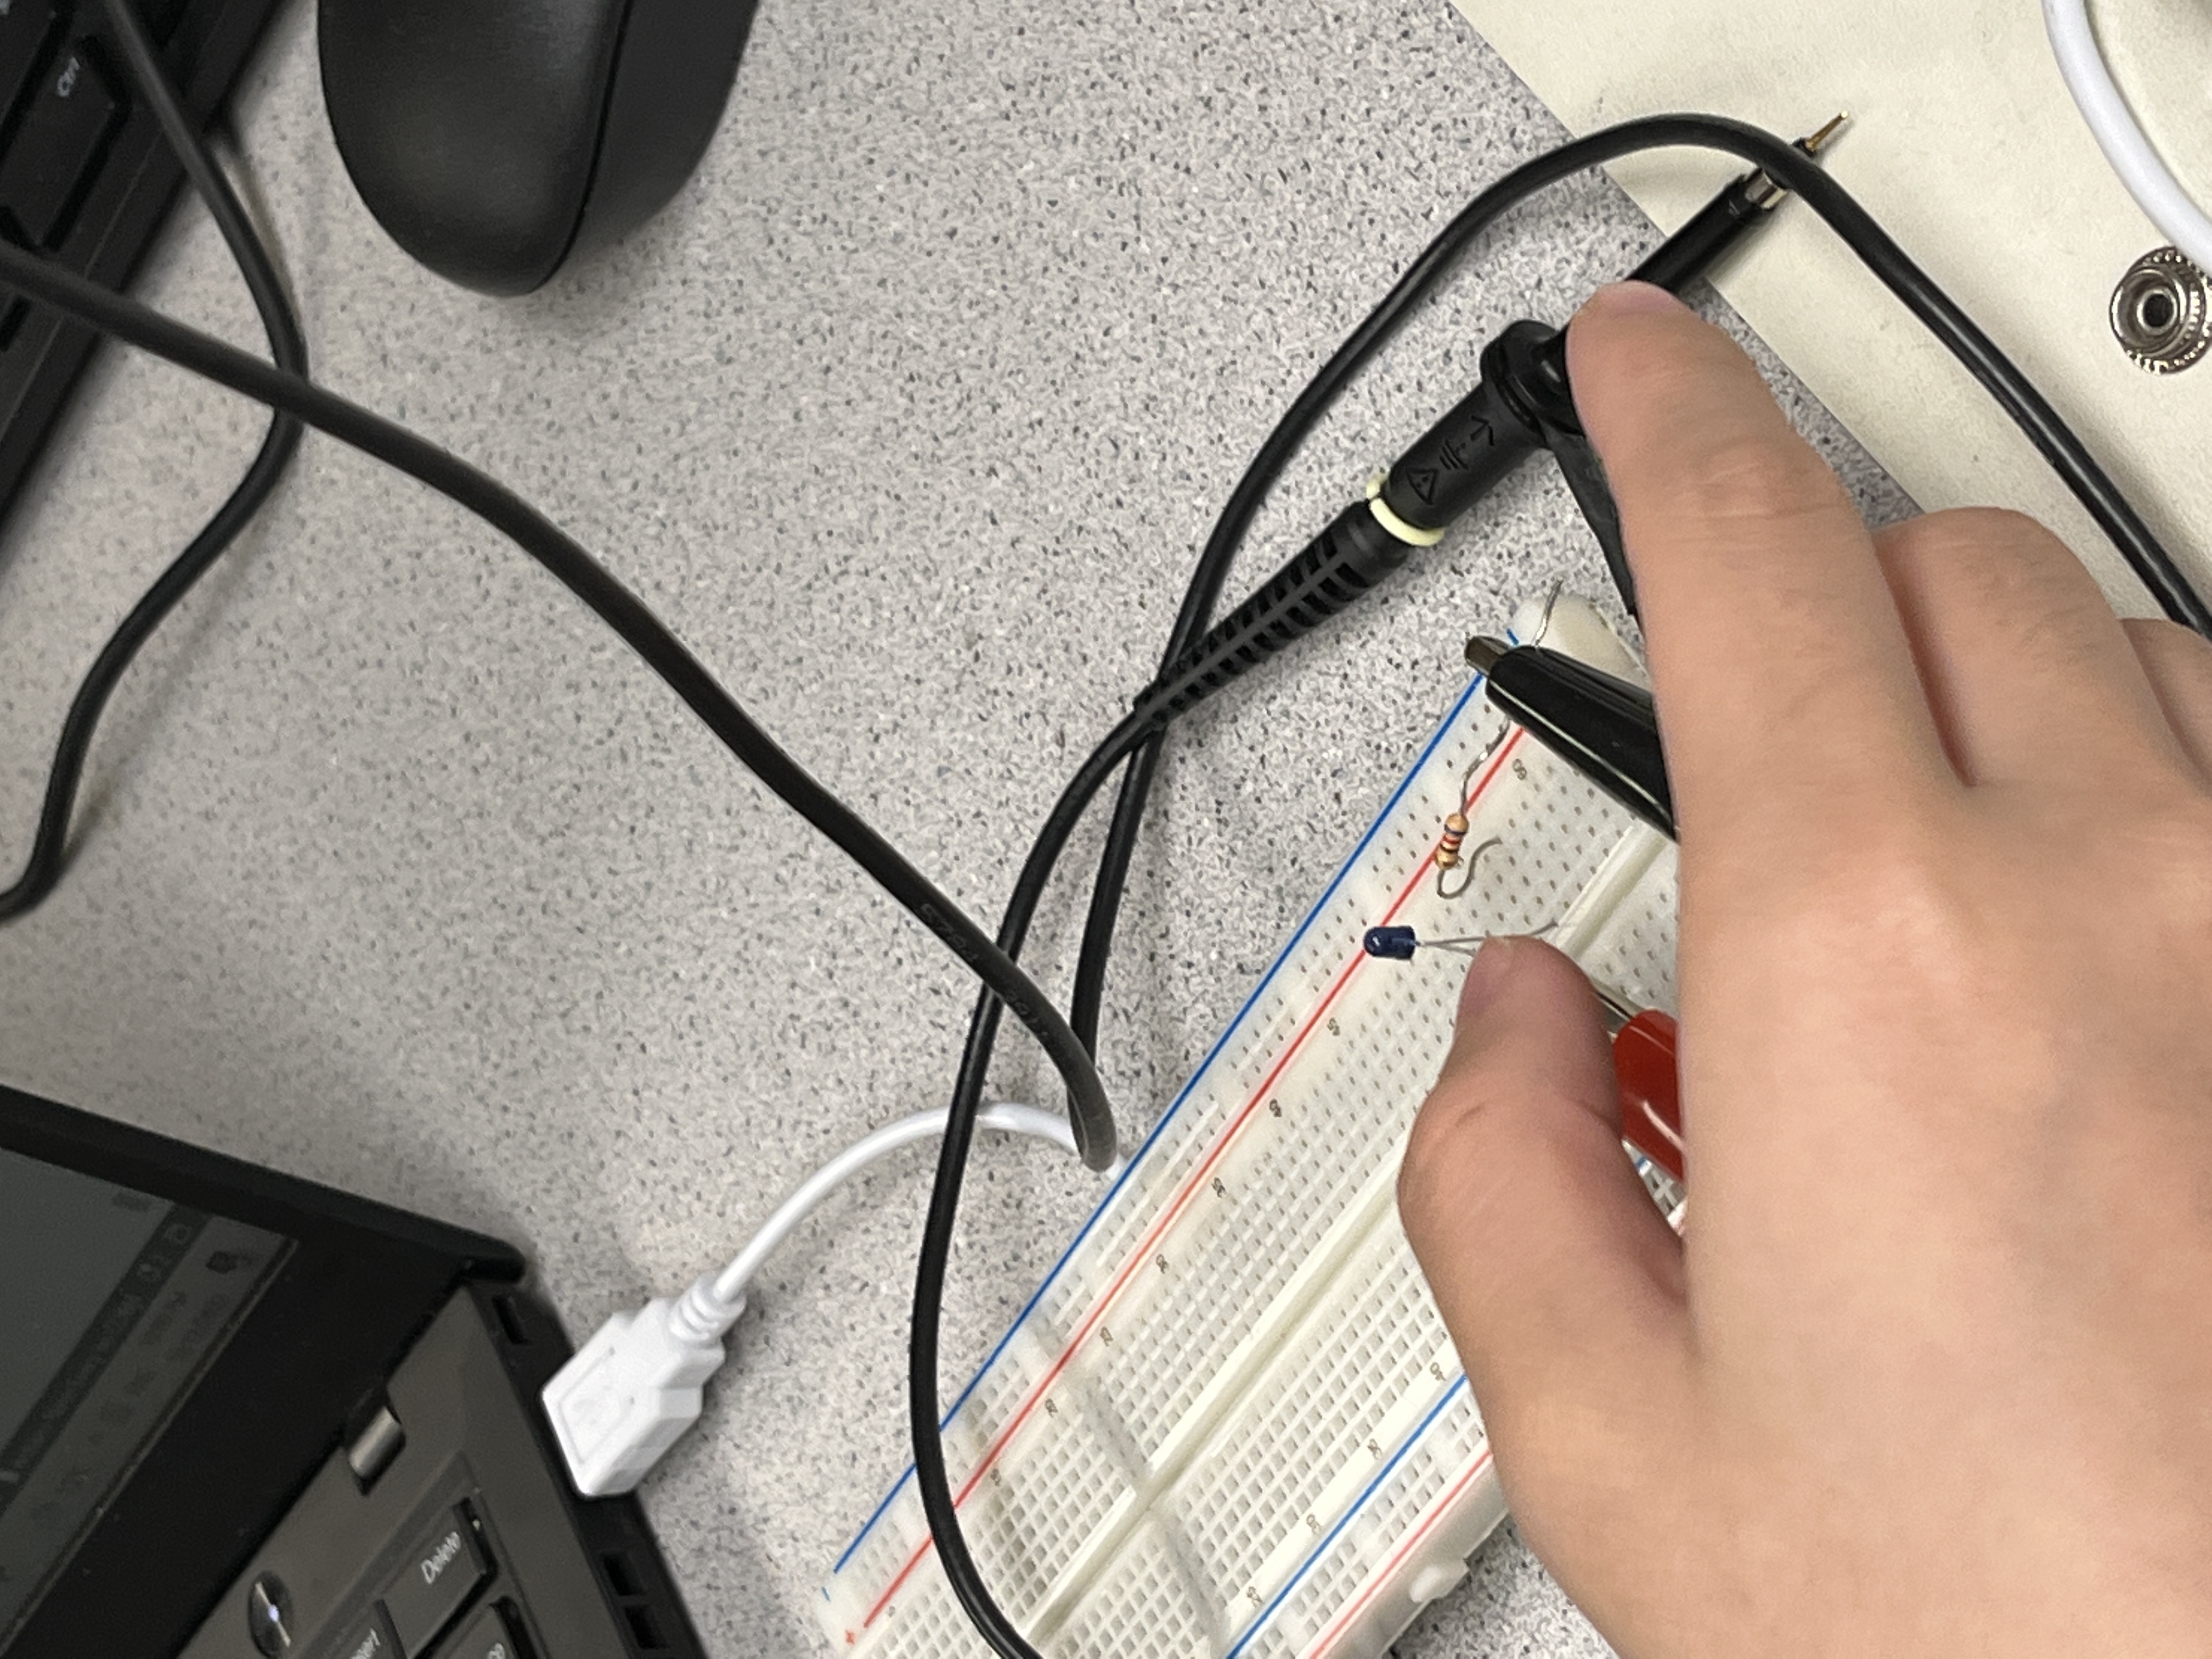
After testing our phototransistor circuit with 1k frequency, we then increased the frequency to 9k. At this frequency, we observed a more distorted signal, as shown in the video. The reason for this distortion might be due to the rise and fall time of the phototransistor. The IR LED is at 9k frequency, which means the period of it is about 0.1m Seconds. As frequency increases, the period would decrease and get close to the rise and fall time phototransistor, in other words, there will be less time for the phototransistor to react on this fast on and off.
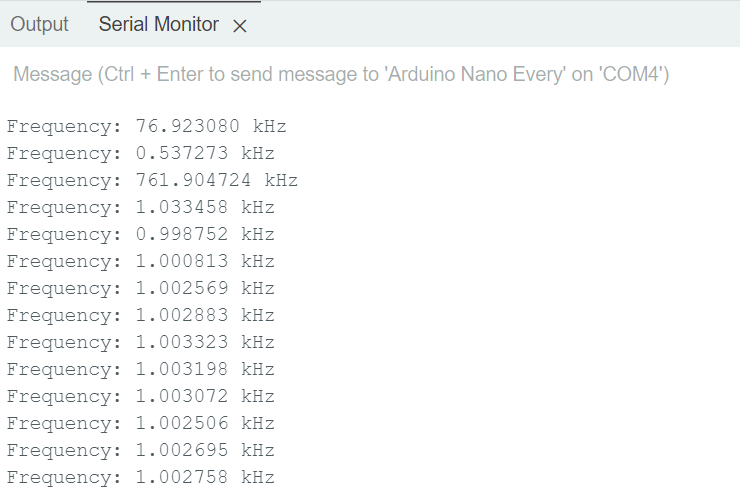
Finally, we used the Nano to test the frequency of the LED. In our code, we modified the DACRED value to make it based on ambient light measured during setup. See Fig.3, The Serial Monitor successfully displayed the measured frequency when the signal generator is set to 1kHz.
After we finished testing one phototransistor, we put two additional phototransistors on the robot, so now there is one at front, left, and right sides. Using three phototransistors is an efficient way to help the robot to find treasures without turning over and over again. Our code cycles through each phototransistor and detects whether there is an oscillating IR signal.
Part 2: 4-Digit 7-Segement Display
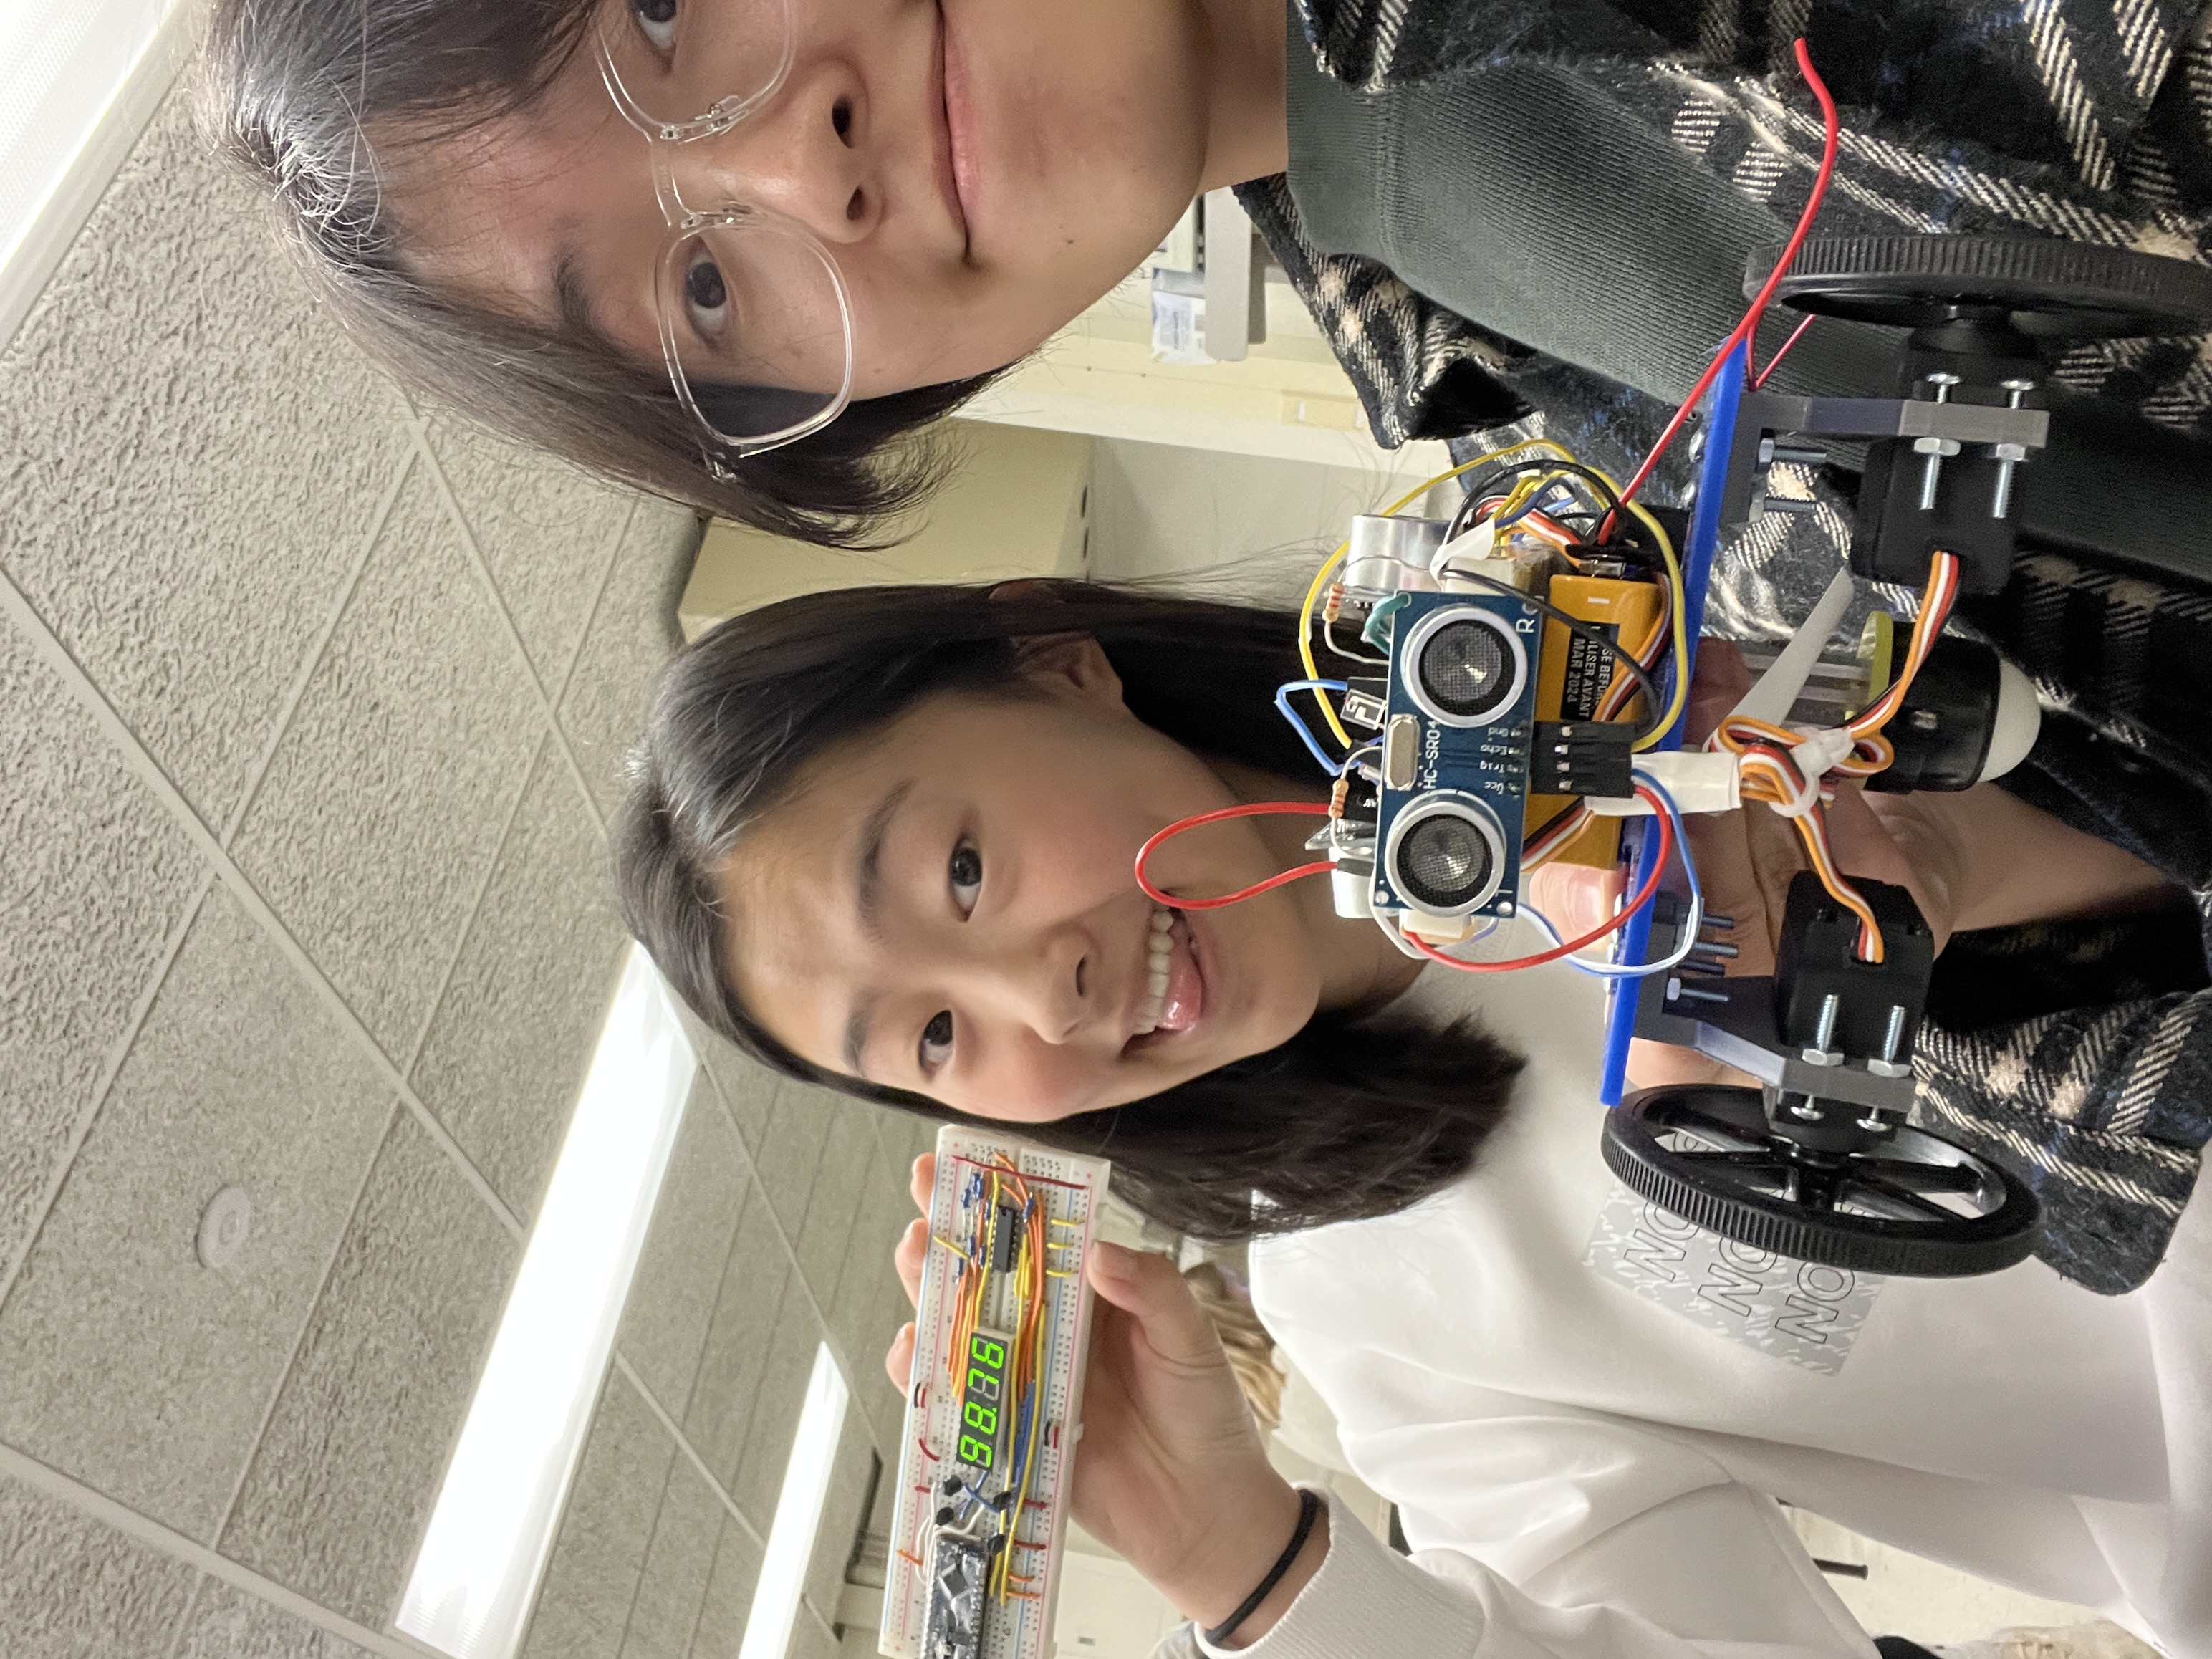
In second part of lab, we finished wining of 7-segment display. It is a very time-consuming and complicated task, but thankfully, my partner Alina is very good at designing and orgnazing wires. That’s why we have a very neat and beautiful board that can display 4-digit numbers and decimal point when the number is ten-thousands or hundred-thousands.
Part 3: Photo of Us!