aky26-nan46
Lighty Light Zoom Zoom
Introduction
The name of our system is Lighty Light Zoom Zoom. The main feature of our system is lighting up LEDs based on the movement of the board. By reading the acceleration data on the board, our system is able to increase the intensity of the LEDs on the board relative to how hard you shake it in any direction. Shaking the system along its width will increase RED LED’s intensity, shaking it along its length increases the GREEN LED’s intensity, and shaking it up and down increases the BLUE LEDs intensity. All three directions can be utilized to create a myriad of colors. When you stop shaking the board in a respective direction the corresponding LED will then fade out until it turns off.
System overview
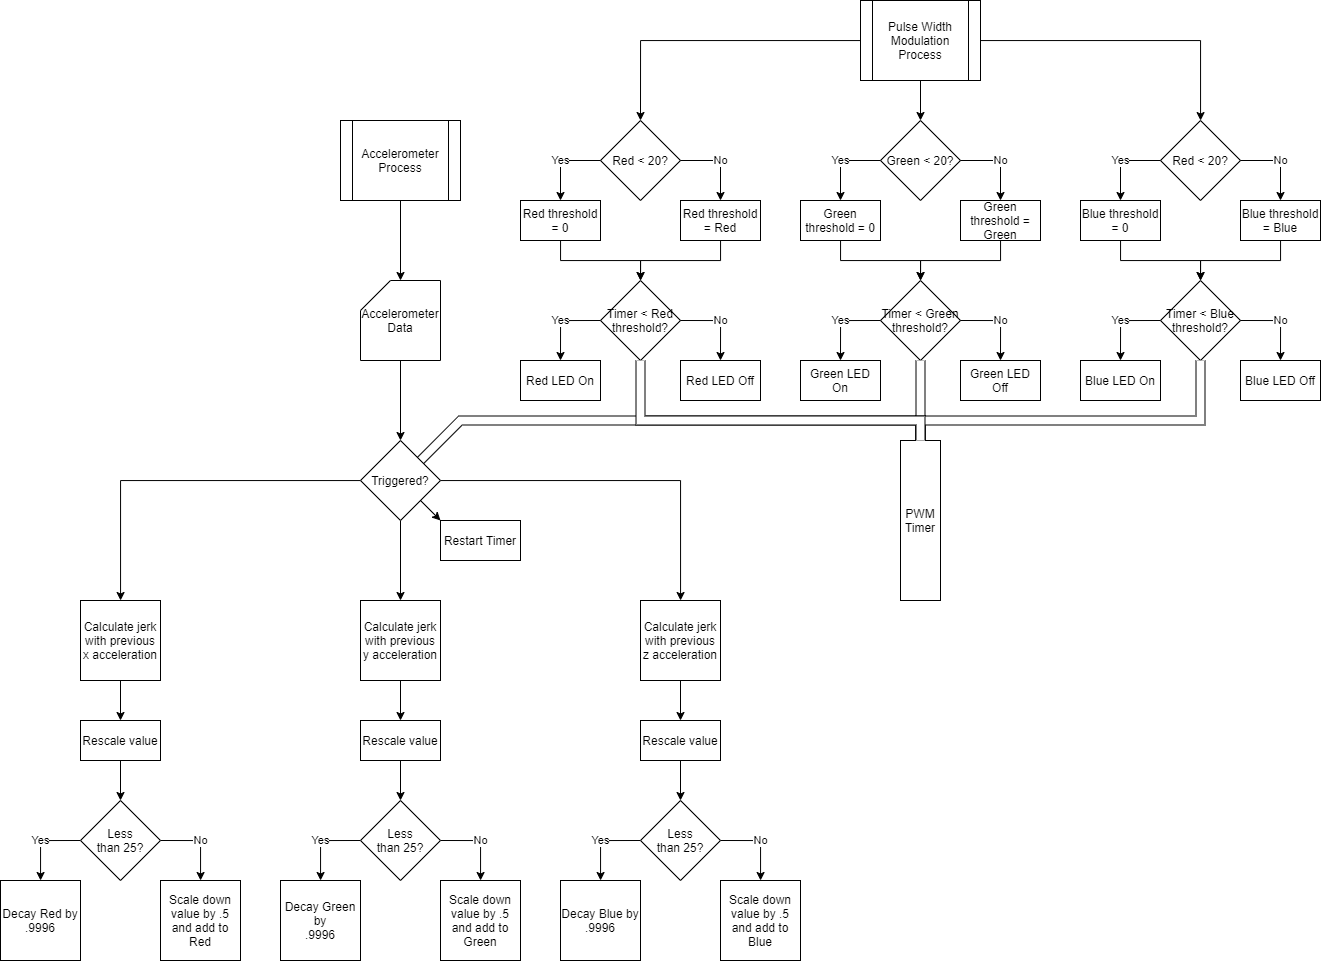
Figure 1: Diagram of the project system.
Project Video (link)
System description
We used single precision floating point hardware for our project.
In order to implement our system, we took advantage of the scheduler in Lab 3. We used this scheduler to manage two processes
called retrieveData and adjustPWM.
The process retrieveData continuously retrieves new acceleration data from the accelerometer. The second process adjustPWM uses Pulse Width Modulation to change the intensity of the LEDs relative to the jerk of the system.
Pulse Width Modulation (PWM) is used to control the LED intensity. It changes the LED intensity by continuously turning the LED on for some fraction of time and off for the remaining. This results in the LED appearing dimmer. We control the intensity by controlling the amount of time that the LEDs are turned on.
The values that are fed into the PWM systems are updated according to a PIT timer’s period. When the timer flag is set, a new jerk is calculated. This jerk is then scaled to resist noise. This new value is then added to the variable controlling the LED intensity. This process is done for each direction and their respective LEDs. If the value coresponding to the LED is too low the system will turn off the LED.
Testing
We first tested the accelerometer to ensure that we were receiving data. We visually confirmed this using debug mode and examining the string containing the accelerometer data.
We then tested our PWM implementation. We visually confirmed that the LEDs had decreased in brightness.
We then tested our processes to ensure that the context switching did not have a significant detrimental effect on the smoothness of the PWM. We visually confirmed that the LEDs remained smooth.
We then tested mapping our jerk values to our PWM. We chose to only map the red LED for simplicity. We visually confirmed that the red LED lit up whenever we moved the board around.
We finally tested different parameters for our main pipeline. We visually confirmed that we had achieved the desired effect of lighting up the LEDs based on the movement of the board.
Resources
We utilized the provided accelerometer code from Canvas.
We implemented the PWM, the jerk calculation, the various jerk scaling algorithms, and the mapping from the scaled jerk to the PWM duty cycle of the LEDs ourselves.
Work Distribution
We both coded and we frequently bounced ideas off each other. When we encountered difficulties, we discussed various ways to identify and then solve the problem.
Nnamdi wrote the Introduction and the System Description sections. Andrew wrote the Testing, Resources, and Work Distribution sections. Andrew created the System Overview diagram. Nnamdi created the video. We both reviewed each other’s work.