Introduction
TikTok has become a cultural phenomenon, with millions of users creating and sharing short video clips with music. The music on TikTok has a significant impact on popular culture, driving the success of hit songs and launching new artists’ careers. By analyzing data related to trending TikTok tracks, we hope to discover insightful patterns in the music that drives this platform. Specifically, we explored the question: what factors contribute to making a track popular on TikTok?
We are interested in exploring the relationship between song duration and the popularity of TikTok tracks. We also want to visualize the song danceability of TikTok tracks before and after COVID-19. We are curious about these two variables because of our own experiences during the pandemic – a feeling of restlessness and boredom during quarantine could have encouraged people on TikTok to create dance trends as an outlet.
From our report, we found that while there is no statistically significant relationship between song duration and its popularity on TikTok, the majority of popular tracks were between 2.5 to 3.5 minutes long. We also discovered that there is a statistically significant difference in the danceability of TikTok tracks before and after the pandemic, with a higher danceability value after the pandemic.
Data description
Why was this dataset created? Who funded the creation of the dataset?
The dataset was created to analyze the popularity of trending TikTok tracks, and understand what factors influence a TikTok track’s popularity. The dataset was created by Team Dan, a team participating in the Eskwelabs DSCN Sprint (https://github.com/romeoben/DSC7-Sprint2-TeamDan) in June 2021. We acquired the dataset from Kaggle. It is unclear who funded the creation of the dataset.
If people are involved, were they aware of the data collection and if so, what purpose did they expect the data to be used for? What processes might have influenced what data was observed and recorded and what was not?
The track creators were not involved in the data collection. The data collection was done by a third-party. The data was collected by scraping data from TikTok and compiling it into csv files. The top trending tracks on Tiktok (at the specific time of collection) influenced the data that was recorded.
What preprocessing was done, and how did the data come to be in the form that you are using?
We removed observations that had any null values. Then, we dropped the genre, playlist_id, and playlist_name columns, because they are not relevant to our research question. We did not have to rename any columns as they were all in snake case format.
What are the observations (rows) and the attributes (columns)?
Each observation is a TikTok track. The columns in our dataset include track_id and track_name, artist_id and artist_name, album_id, duration (measured in seconds), duration_mins (duration measured in minutes), release_date, popularity (integer scale from 1 to 100), danceability (integer scale from 0 to 1), and energy (integer scale from 0 to 1). Additionally, columns related to the track musicality include key, loudness, mode, “speechiness”, “instrumentalness”, “acousticness”, liveness, valence (float scale from 0 to 1) and tempo. There are 6,746 instances in total. Of this, there are 3,560 instances with unique ids.
Description of the columns
track_name - Name of the track
artist_name - Name of the artist
artist_pop - Popularity of the artist
album - Name of the album
track_pop - Popularity of the track
danceability - Danceability describes how suitable a track is for dancing based on a combination of musical elements including tempo, rhythm stability, beat strength, and overall regularity. A value of 0.0 is least danceable and 1.0 is most danceable.
energy - Energy is a measure from 0.0 to 1.0 and represents a perceptual measure of intensity and activity. Typically, energetic tracks feel fast, loud, and noisy. For example, death metal has high energy, while a Bach prelude scores low on the scale. Perceptual features contributing to this attribute include dynamic range, perceived loudness, timbre, onset rate, and general entropy.
loudness - The overall loudness of a track in decibels (dB). Loudness values are averaged across the entire track and are useful for comparing relative loudness of tracks. Loudness is the quality of a sound that is the primary psychological correlate of physical strength (amplitude). Values typically range between -60 and 0 db.
mode - Mode indicates the modality (major or minor) of a track, the type of scale from which its melodic content is derived. Major is represented by 1 and minor is 0.
key - The key the track is in. Integers map to pitches using standard Pitch Class notation. E.g. 0 = C, 1 = C♯/D♭, 2 = D, and so on. If no key was detected, the value is -1.
speechiness - Speechiness detects the presence of spoken words in a track. The more exclusively speech-like the recording (e.g. talk show, audio book, poetry), the closer to 1.0 the attribute value. Values above 0.66 describe tracks that are probably made entirely of spoken words. Values between 0.33 and 0.66 describe tracks that may contain both music and speech, either in sections or layered, including such cases as rap music. Values below 0.33 most likely represent music and other non-speech-like tracks.
acousticness - A confidence measure from 0.0 to 1.0 of whether the track is acoustic. 1.0 represents high confidence the track is acoustic.
instrumentalness - Predicts whether a track contains no vocals. “Ooh” and “aah” sounds are treated as instrumental in this context. Rap or spoken word tracks are clearly “vocal”. The closer the instrumentalness value is to 1.0, the greater likelihood the track contains no vocal content. Values above 0.5 are intended to represent instrumental tracks, but confidence is higher as the value approaches 1.0.
liveness - Detects the presence of an audience in the recording. Higher liveness values represent an increased probability that the track was performed live. A value above 0.8 provides strong likelihood that the track is live.
valence - A measure from 0.0 to 1.0 describing the musical positiveness conveyed by a track. Tracks with high valence sound more positive (e.g. happy, cheerful, euphoric), while tracks with low valence sound more negative (e.g. sad, depressed, angry).
tempo - The overall estimated tempo of a track in beats per minute (BPM). In musical terminology, tempo is the speed or pace of a given piece and derives directly from the average beat duration.
time_signature - An estimated time signature. The time signature (meter) is a notational convention to specify how many beats are in each bar (or measure). The time signature ranges from 3 to 7 indicating time signatures of “3/4”, to “7/4”.
duration_mins - The duration of the track in minutes.
Rows: 6,746
Columns: 23
$ track_id         <chr> "6kVuF2PYLuvl9T85XjNbaO", "1RGIjMFMgJxkZHMDXVYzOJ", "…
$ track_name       <chr> "Lay It Down Gmix - Main", "Bartender (feat. Akon)", …
$ artist_id        <chr> "1Xfmvd48oOhEWkscWyEbh9", "3aQeKQSyrW4qWr35idm0cy", "…
$ artist_name      <chr> "Lloyd", "T-Pain", "T-Pain", "Blxst", "Gryffin", "Bel…
$ album_id         <chr> "43C6GVlhXG4KfZuEbxty3r", "6CrSEKCF4TYrbSIitegb3h", "…
$ duration         <dbl> 302186, 238800, 238800, 161684, 218295, 122772, 12277…
$ release_date     <chr> "2011-01-01", "2007-06-05", "2007-06-05", "2020-12-04…
$ popularity       <dbl> 28, 75, 75, 76, 72, 89, 89, 50, 89, 70, 70, 98, 98, 4…
$ danceability     <dbl> 0.597, 0.832, 0.832, 0.571, 0.548, 0.855, 0.855, 0.77…
$ energy           <dbl> 0.800, 0.391, 0.391, 0.767, 0.839, 0.463, 0.463, 0.80…
$ key              <dbl> 1, 8, 8, 2, 6, 3, 3, 11, 4, 1, 1, 8, 8, 1, 3, 0, 11, …
$ loudness         <dbl> -5.423, -8.504, -8.504, -5.160, -2.371, -7.454, -7.45…
$ mode             <dbl> 0, 1, 1, 1, 1, 1, 1, 0, 0, 1, 1, 1, 1, 1, 1, 1, 0, 0,…
$ speechiness      <dbl> 0.3120, 0.0628, 0.0628, 0.2870, 0.0644, 0.0367, 0.036…
$ acousticness     <dbl> 0.04610, 0.05640, 0.05640, 0.33600, 0.13500, 0.21700,…
$ instrumentalness <dbl> 0.00e+00, 0.00e+00, 0.00e+00, 0.00e+00, 0.00e+00, 1.7…
$ liveness         <dbl> 0.1800, 0.2240, 0.2240, 0.0809, 0.1020, 0.3470, 0.347…
$ valence          <dbl> 0.565, 0.436, 0.436, 0.605, 0.314, 0.866, 0.866, 0.90…
$ tempo            <dbl> 155.932, 104.961, 104.961, 93.421, 98.932, 102.931, 1…
$ playlist_id      <chr> "6kVuF2PYLuvl9T85XjNbaO", "1RGIjMFMgJxkZHMDXVYzOJ", "…
$ playlist_name    <chr> "6kVuF2PYLuvl9T85XjNbaO", "1RGIjMFMgJxkZHMDXVYzOJ", "…
$ duration_mins    <dbl> 5.036433, 3.980000, 3.980000, 2.694733, 3.638250, 2.0…
$ genre            <chr> "TIKTOK DANCE", "TIKTOK DANCE", "TIKTOK DANCE", "TIKT…
# A tibble: 6,746 × 20
   track_id      track_name artist_id artist_name album_id duration release_date
   <chr>         <chr>      <chr>     <chr>       <chr>       <dbl> <chr>
 1 6kVuF2PYLuvl… Lay It Do… 1Xfmvd48… Lloyd       43C6GVl…   302186 2011-01-01
 2 1RGIjMFMgJxk… Bartender… 3aQeKQSy… T-Pain      6CrSEKC…   238800 2007-06-05
 3 1RGIjMFMgJxk… Bartender… 3aQeKQSy… T-Pain      6CrSEKC…   238800 2007-06-05
 4 1dIWPXMX4kRH… Chosen (f… 4qXC0i02… Blxst       7Awrgen…   161684 2020-12-04
 5 4QVS8YCpK71R… Tie Me Do… 2ZRQcIgz… Gryffin     69t8rpg…   218295 2018-08-03
 6 7BoobGhD4x5K… Build a B… 26cMerAx… Bella Poar… 5YKqfiQ…   122772 2021-05-14
 7 7BoobGhD4x5K… Build a B… 26cMerAx… Bella Poar… 5YKqfiQ…   122772 2021-05-14
 8 5OKHUpNLi4GE… Ever After 1mCY2mHc… Bonnie Bai… 4TrCexU…   231559 2018-05-11
 9 3J8EOeKLTLXO… Calling M… 6jGMq4yG… Lil Tjay    3MEKpJ7…   205458 2021-04-02
10 5caZgotE4D6e… Clap For … 03T8GHHc… YungManny   7nYMFoZ…   125579 2021-03-20
# ℹ 6,736 more rows
# ℹ 13 more variables: popularity <dbl>, danceability <dbl>, energy <dbl>,
#   key <dbl>, loudness <dbl>, mode <dbl>, speechiness <dbl>,
#   acousticness <dbl>, instrumentalness <dbl>, liveness <dbl>, valence <dbl>,
#   tempo <dbl>, duration_mins <dbl>
Data analysis
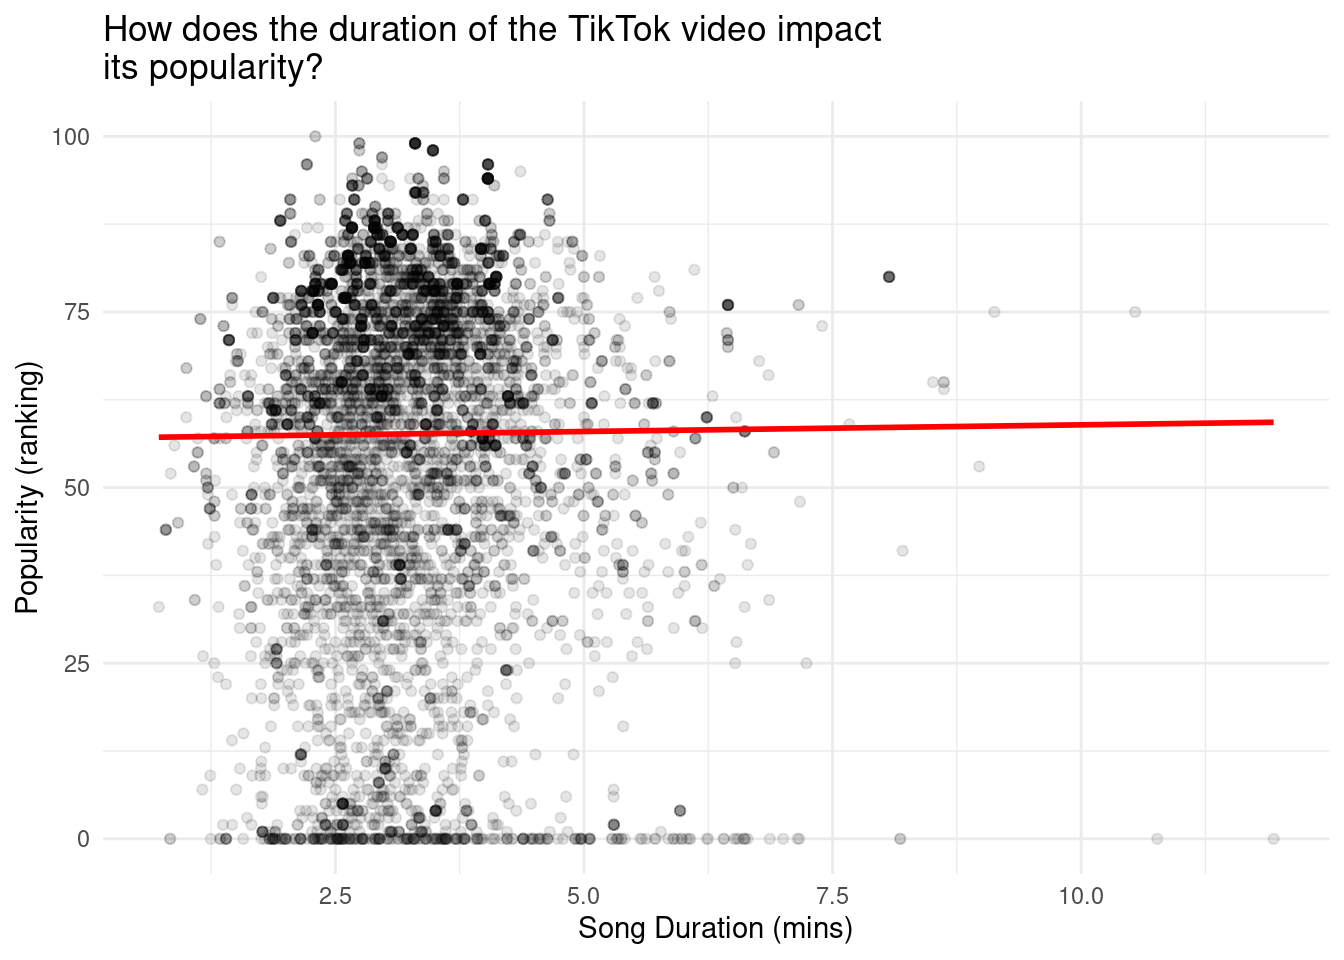
We can see that the highest ranked range from durations as low as 0.7237667 minutes and as long as over 10 minutes cans still rank at the top of the charts. However, we see the highest density of points in the range of 1.5 - 3 minutes, we can see that overall, songs tend to be around the length of 3 minutes or so, and again, we cannot say that this range of duration necessarily implies popularity.
Songs that are within this range seem to be at a “safe” duration where the artist can have time within the song to have catchy moments. Longer songs can bore and thus fail to keep audience attention, whereas shorter songs may not have enough time to have any notable moments within the song/video. Therefore, while duration is an important aspect to consider, it is not the only factor in determining track success.
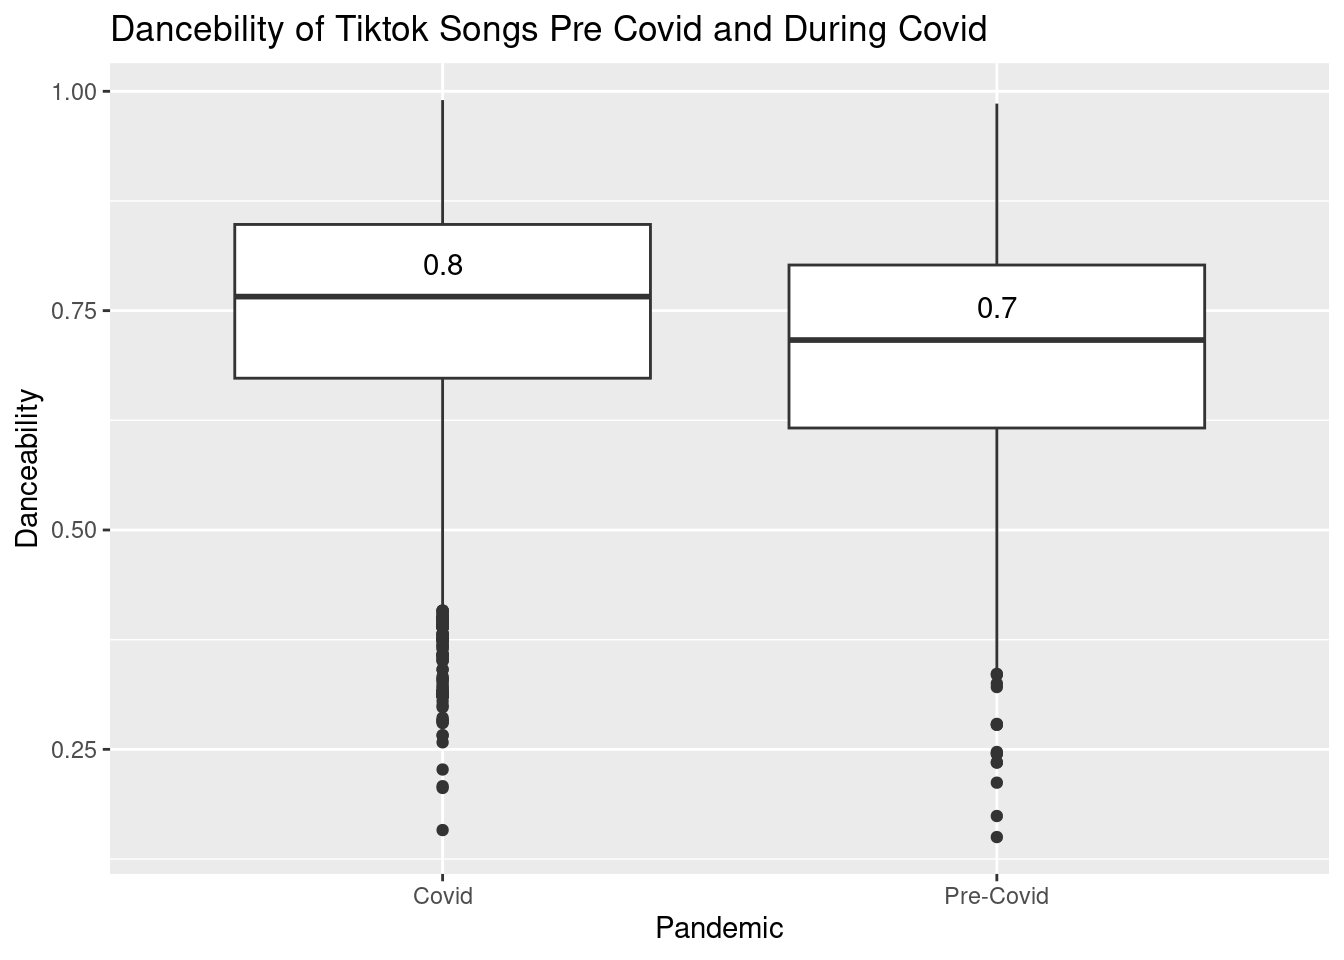
We chose the release date to be “3/01/20” because the onset of the pandemic is widely considered to be March 2020. We can see from this side-by-side boxplot that the danceability of TikTok songs during the COVID-19 pandemic is higher than before the pandemic. The median danceability before COVID-19 is less than 0.75, while the danceability during COVID-19 is greater than 0.75. This increase in danceability may be explained by the boredom that many people felt during quarantine and how they used TikTok dance trends as an outlet.
Evaluation of significance
# A tibble: 2 × 5
  term          estimate std.error statistic p.value
  <chr>            <dbl>     <dbl>     <dbl>   <dbl>
1 (Intercept)     57.0       1.03     55.4     0
2 duration_mins    0.190     0.304     0.624   0.532
Now that we have our linear regression equation is: \[
\widehat{popularity} = 57.0349781 + (0.1896151 * duration~mins)
\]
We can now perform a hypothesis test and evaluate the significance of our model…
# A tibble: 1 × 1
  p_value
    <dbl>
1   0.516
Our hypotheses are:
\[
H_0 : \beta_{duration} = 0
\]
\[
H_A : \beta_{duration} \ne 0
\]
Our null hypothesis is that there is no relationship between the duration of a TikTok video and its popularity.
Our alternative hypothesis is that there is in fact a relationship between duration of a TikTok video and its popularity.
We see that our p-value is 0.516, which is higher that our alpha level of 0.05. This means that we fail to reject the null hypothesis, thus, we conclude that there is no significant relationship between the duration of a TikTok song and its popularity at the 0.05 significance level.
Although our hypothesis test fails to reject the null hypothesis, this is not to say that there is absolutely no relationship between the duration of a song and its popularity. We can do further testing to conclude this, given that we observed we saw high density and clustering of points around the 3 minute mark.
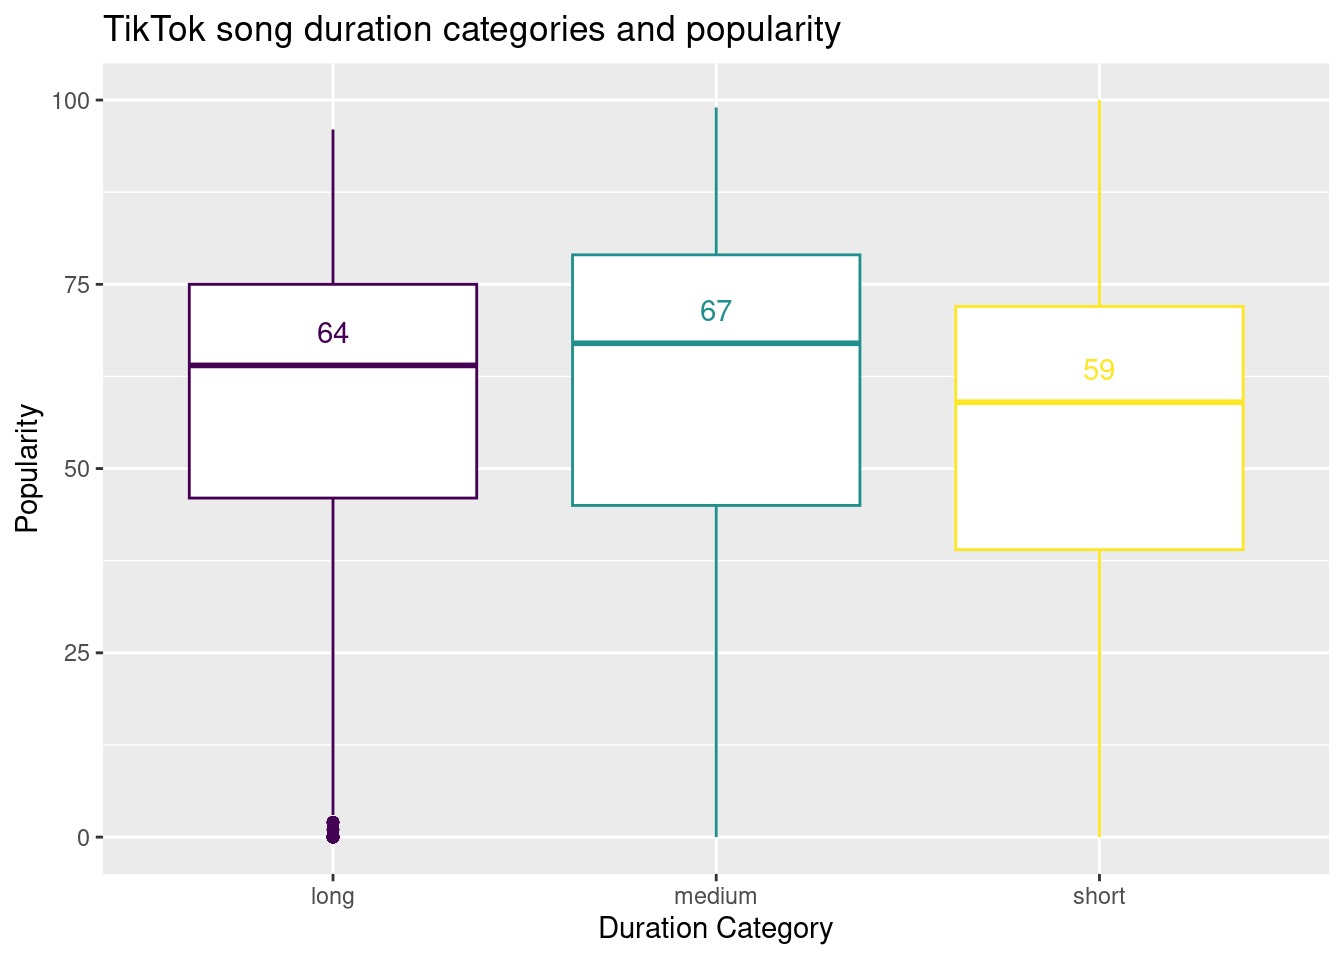
We then decided to separate the data into three categories: short songs, medium length songs, and long songs (as specified in the code).
We can see that the medium length songs (approximately 67) tend to be slightly higher in popularity than their long (approximately 64) and short (approximately 59) counterparts. However, we do not know if these differences are significant. These boxplots confirm our suspicion that the medium length songs (around the 3 minute range) tend to be more popular, however, for future direction an ANOVA is necessary to determine if the differences are actually statistically significant.
Evaluation of Significance (Part II)
Our hypotheses are:
\[
H_0: \mu_{before} = \mu_{after}
\]
\[
H_A: \mu_{before} \ne \mu_{after}
\]
The null hypothesis is that there is no difference in the mean danceability of TikTok tracks before and after 2020.
The alternative hypothesis is that there is in fact a difference in the mean danceability of TikTok tracks before and after 2020.
# A tibble: 2 × 2
  era       mean_danceability
  <chr>                 <dbl>
1 Post-2020             0.752
2 Pre-2020              0.729
# A tibble: 1 × 1
  p_value
    <dbl>
1       0
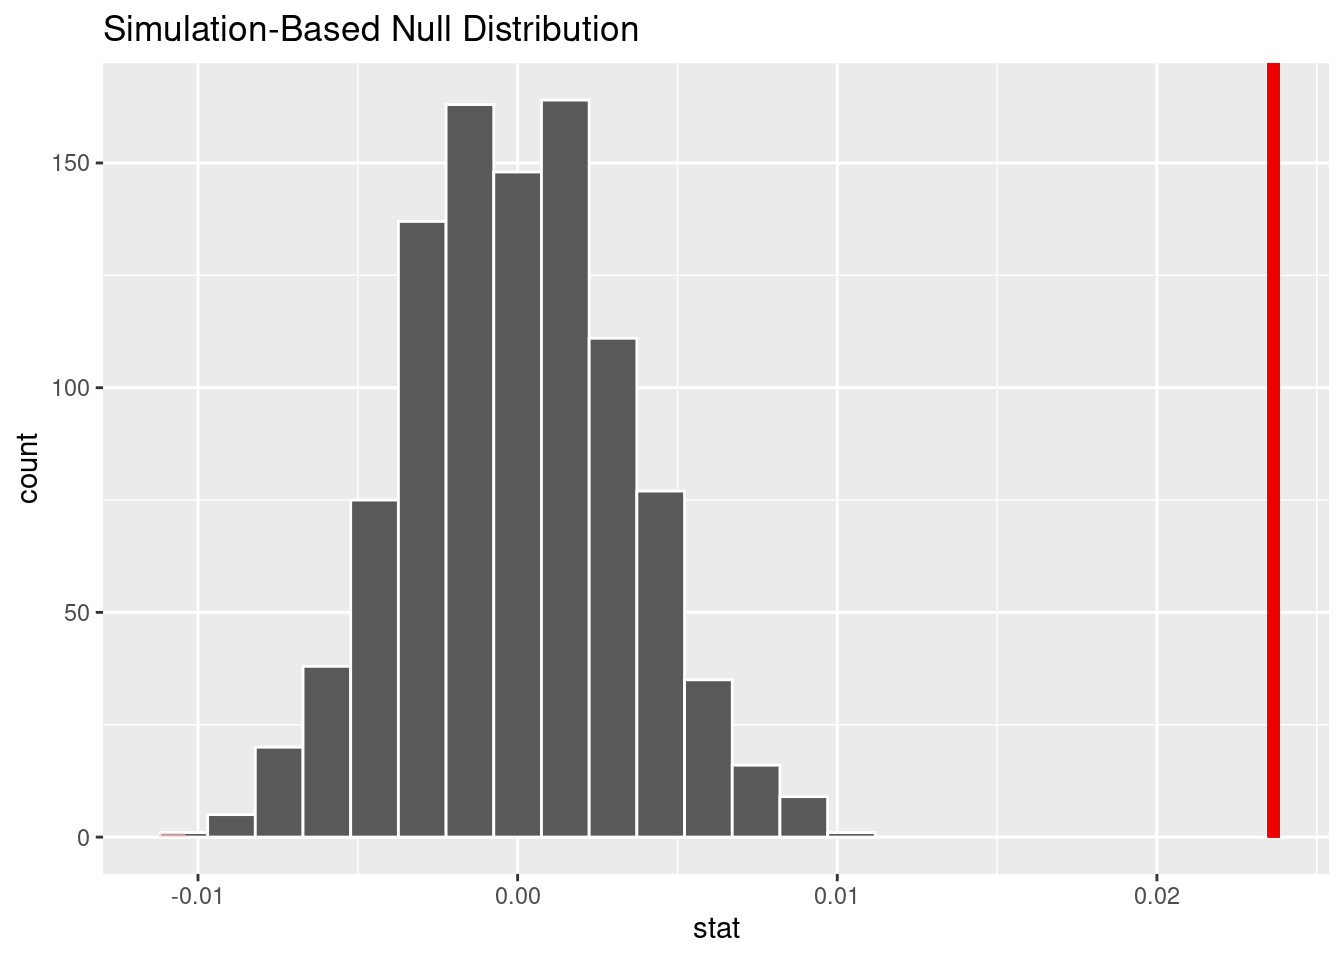
The p-value is 0. This is less than our significance level of .05, so we reject the null hypothesis: that the mean danceability of Tiktok tracks prior to 2020 is the same as the mean danceability of Tiktok tracks after 2020, in favor of the alternative: there is a significant difference between mean danceability prior to 2020 compared to post 2020.
Interpretation and conclusions
From our scatterplot of the duration and popularity of TikTok tracks, we observed that the highest density of points for tracks with highest popularity was in the range of 1.5 to 3 minutes. Our hypothesis testing and evaluation of significance shows that there was no significant relationship between the duration of a TikTok song and its popularity at an alpha level of 0.05. In order to further test this, we created divided our data into short (less than 2.5 mins), medium (2.5 to 3.5 mins), and long (greater than 3.5 mins), and determined that the medium-length songs tended to be the most popular.
We gather that approximately the 3-minute mark is a sweet spot for which songs have the appropriate length to contain captivating auditory snippets. Although our analysis is not entirely comprehensive and requires further research, our findings suggest that song duration may have a part in determining a song’s popularity on TikTok.
Overall, this research is helpful to record labels or musicals to increase their popularity on social media platforms. By tailoring their songs to be more aligned with the characteristics that we analyzed, they could potentially increase their marketability and attract new listeners through TikTok.
From our boxplot comparing the medians of the danceability of tracks before and after covid (marked as March 2020), the median is slightly higher for the post-COVID boxplot. In order to further evaluate if this increase was statistically significant, we conducted a hypothesis test. Our hypothesis test between the danceability of TikTok tracks before and after covid shows that there is a significant difference between the song danceabilities. Specifically, the mean danceability of TikTok tracks before COVID was 0.72 while after COVID it was 0.75. This hypothesis test suggests that the top trending tracks became more “danceable” after COVID.
These findings address our question as to whether danceability of tracks increased after COVID-19. It points towards the idea that people were more inclined to find an outlet for movement while being home.
Limitations
Our data is specific to the Philippines and Southeast Asia so we are limited to analyze only a portion of the users of this globally known app. Also, we are given the popularity of the tracks within TikTok, but are unaware of its popularity outside of this app. This limits our ability to understand how TikTok popularizes a song beyond the app.
Although we found that the medium length songs are more popular than their short and longer counterparts, we would have to take this analysis a step further in order to truly determine whether these differences are statistically significant. For instance, an ANOVA test could be performed to confirm our hypotheses.
Ultimately, we cannot establish causality through our analyses. Rather, our analysis aims to provide insightful correlations and associations between these variables, which can inform future research within the social media and music industries.


