An Analysis of Modern Music Criticism
Report
Introduction
We chose two datasets that are related to music journalism. One of the datasets is from a well-known music publication called Pitchfork, which has been reviewing albums since the 90s. The other is from Anthony Fantano, a music blogger and YouTuber who has been reviewing music since the early 2010s.
The research questions we are trying to explore are:
Is the source of a review a significant factor in determining the review’s score?
What’s the difference in pitchfork people’s taste over time for folk/country music and rock music?
After performing our two analyses, we found that our data provided convincing evidence that the score of a review is not independent (therefore, significant) from what review source it originates from and that the difference between the mean scores of Rock and Folk/Country albums, before and after 1990, is significant.
Data description
Who funded the creation of the dataset? Why was this dataset created?
The Anthony Fantano dataset was scraped from his blog website by kaggle.com user Apatosaur. The author of the dataset did not specify their motivations behind its creation.
We found the Pitchfork dataset on Reddit. Reddit user @snappcrack posted the dataset which was scraped by Kaggle.com user Nolan Conaway, scraping over 18,000 Pitchfork reviews (going back to January 1999) to satisfy his own curiosities. Some of the questions Nolan Conaway wanted to answer with the dataset were:
Do review scores for individual artists generally improve over time, or go down?
How has Pitchfork’s review genre selection changed over time?
Who are the most highly rated artists? The least highly rated artists?
What processes might have influenced what data was observed and recorded and what was not?
Some processes that might have influenced what data was observed and recorded for Fantano are the sampling of albums, since he could have not reviewed all the albums he listened to or chose to review certain albums because of personal preference. On the other hand, the Pitchfork dataset’s sampling might have also been influenced by which reviews Pitchfork’s editorial team selected for publication and which were not. Additionally, for both Fantano and Pitchfork, it could be possible that other data was not recorded such as number of listens.
What preprocessing was done, and how did the data come to be in the form that you are using?
For Fantano, we ended up with the fantano_cleaned dataset by cleaning and tidying data from the fantano_raw dataset. We extracted data and converted it to the correct format, converted score to numeric, kept the six most important tags, deleted rows with NAs, merged genres with less than 10 songs with other genres, put the “Other” genre category last since it did not provide useful information, and selected all attributes except the “name” and “n” which were not relevant for our data analysis.
For Pitchfork, we ended up with the pitchfork_cleaned dataset by cleaning and tidying data from the pitchfork_raw dataset. We created pitchfork_raw1 from pitchfork_raw in which we deleted repetitive labels, created pitchfork_raw2 from pitchfork_raw in which we extracted data and converted it to the correct format. We then compared the release and review year in pitchfork_raw2, excluded irrelevant variables in pitchfork_raw2, joined pitchfork_raw1 and pitchfork_raw2 by album to create pitchfork_cleaned, deleted rows with NAs in pitchfork_cleaned, and kept the six most important tags in pitchfork_cleaned.
What are the observations (rows) and the attributes (columns)?
For both the Pitchfork and Fantano datasets each observation represents an album. For the Pitchfork dataset, before being cleaned, there were 20,873 observations and 12 attributes which were “artist”, “album”, “genre”, “score”, “date”, “author”, “role”, “review”, “bnm”, “link”, “label”, and “release year”. After cleaning Pitchfork, we ended up with 15,273 observations and 17 attributes which were “album”, “tag1”, “tag2”, “tag3”, “tag4”, “tag5”, and “tag6”, “artist”, “genre”, “score”, “review_year”, “author”, “role”, “bnm”, “release_year”, “date”, and “is_retrospective”. For the Fantano dataset, before being cleaned, there were 1,272 observations and 8 attributes which were “album”, “artist”, “date”, “genre”, “name”, “score”, “tags”, and “url”. After cleaning Fantano, we ended up with 1267 observations and 11 attributes which were “album”, “artist”, “date”, “genre”, “score”, “tag1”, “tag2”, “tag3”, “tag4”, “tag5”, and “tag6”.
If people are involved, were they aware of the data collection and if so, what purpose did they expect the data to be used for?
There were no people involved in the data collection, other than the artists that released the albums that the data was collected on. We can assume that as music artists, they knew their albums would be reviewed by someone at some point.
Data analysis
Research question 1: Does Fantano generally give higher scores than Pitchfork?
When re-contextualized, this research question can be stated as: is the source of a review a significant factor in determining the review’s score?
To perform this analysis, we will join the data frames we cleaned by album name (leaving only albums both sources have reviewed), as well as cut out every variable that isn’t album name or score. We will then investigate which source tends to rate albums higher overall, and perform hypothesis testing to determine if any difference we find is likely to be explained by chance, or if the source of the review is a driving factor behind the review score.
We will create a data frame with only the data that is relevant to this question: the album’s name, the score Fantano gave it, and the score Pitchfork gave it. There ended up being 632 albums in this data set.
Below are visualizations of the scores of albums reviewed by both sources:
Warning: Removed 1 rows containing missing values (`geom_bar()`).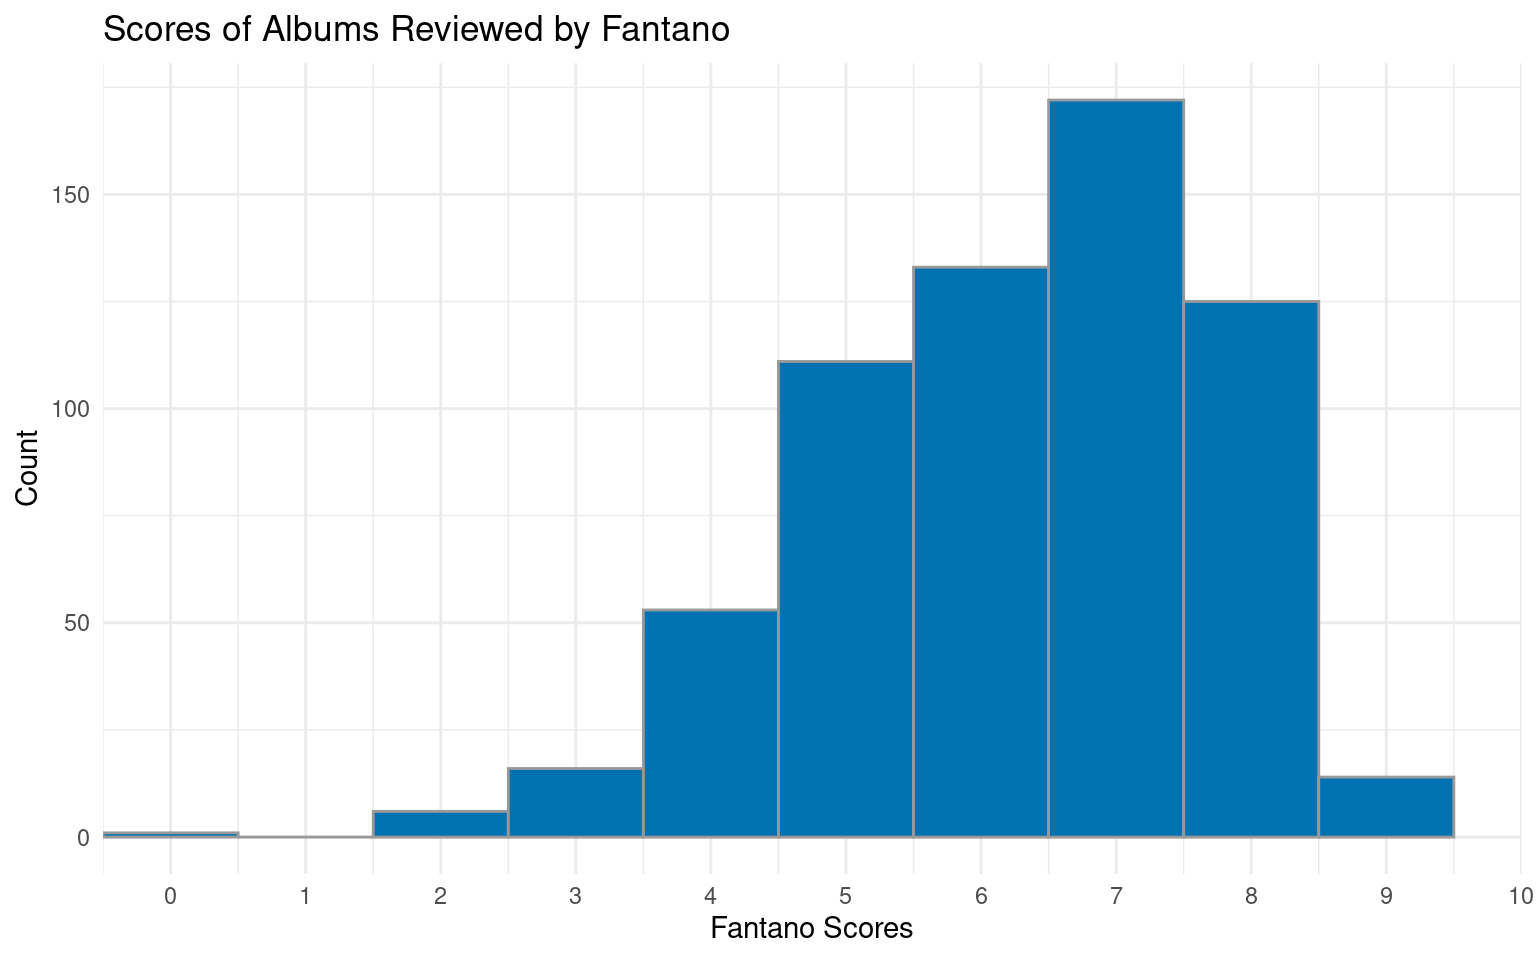
Scale for x is already present.
Adding another scale for x, which will replace the existing scale.
Warning: Removed 1 rows containing missing values (`geom_bar()`).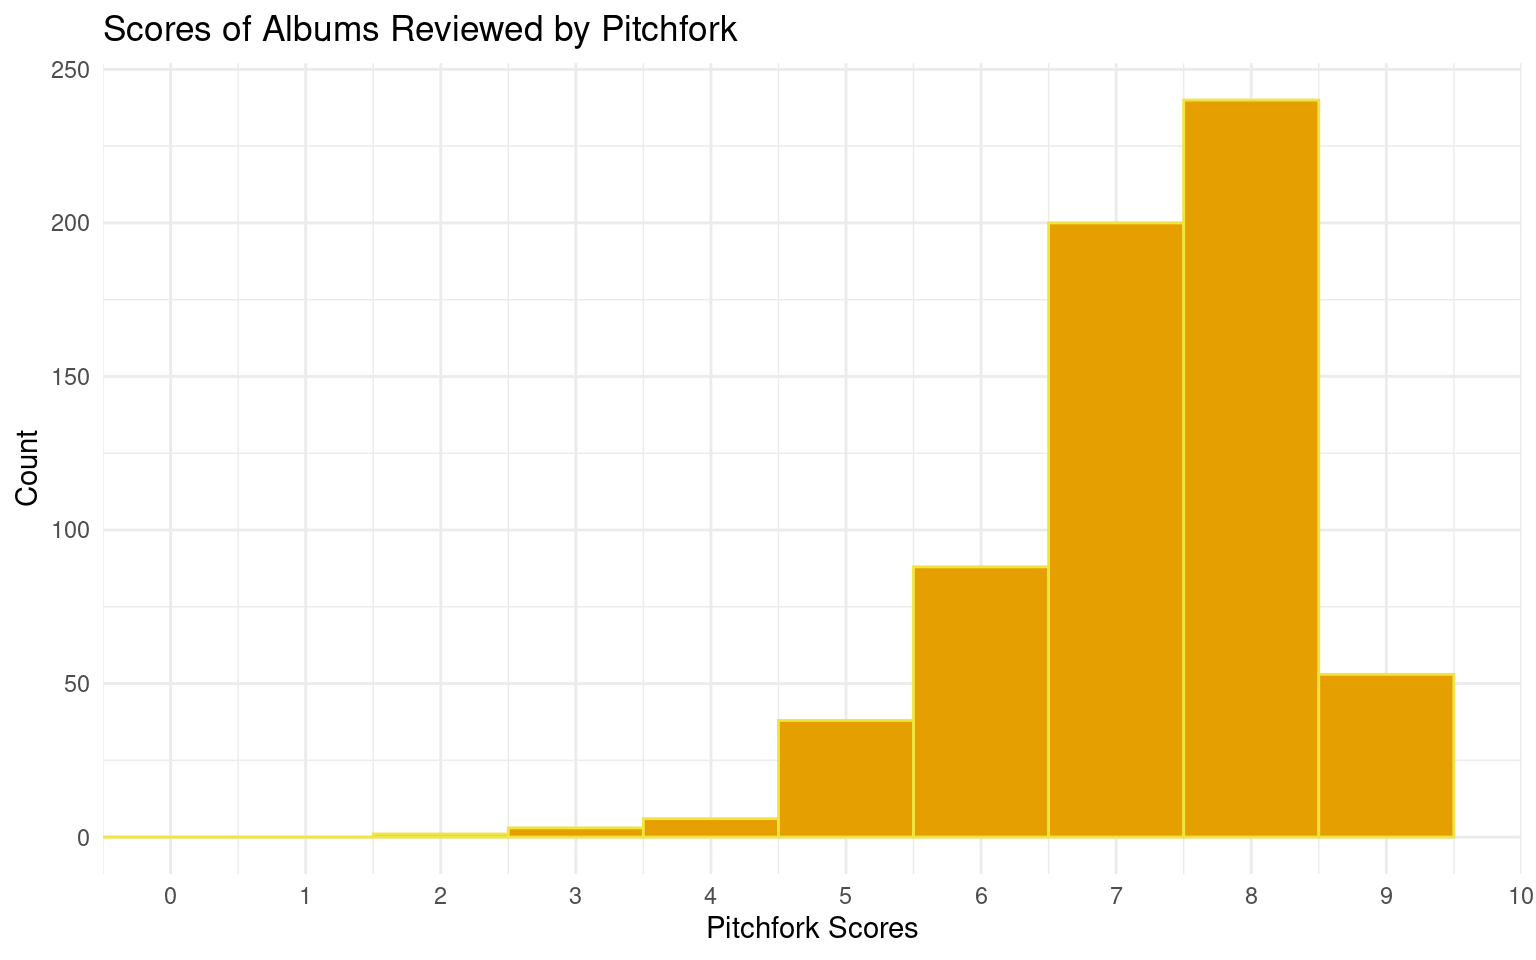
We will also do a cursory look at who has the higher scores on average.
# A tibble: 1 × 3
  mean_fantano mean_pitchfork mean_diff
         <dbl>          <dbl>     <dbl>
1         6.27           7.29     -1.02
It seems that both publications typically post scores above 5, with the average score of Fantano being a 6.27, and the average Pitchfork score being around a 7.29. The mean difference between the scores of an album rated by Pitchfork and by Fantano is -1.017. This could perhaps indicate that an album review being by Pitchfork would increase its probability of being higher, but we will perform a hypothesis test under the Evaluation of Significance section to find out.
Research question 2: Is there an overall difference in Pitchfork scores over time for folk/country music and rock music?
The data frame we will be using for this research question is pitchfork_cleaned. It contains variables such as:
artist <char>: the artist who wrote the album
album <char>: the released album name
genre <char, factor>: genre from which the album belongs to
score <numeric>: score given by audiences on Pitchfork, range from 1 to 10, where 10 represents the highest score.
release_year <numeric>: year that the album was released
Below, we calculated the mean and standard deviation separately for albums of genre “Folk/Country” and “Rock”.
# A tibble: 2 × 4
  genre            n  mean   std
  <chr>        <int> <dbl> <dbl>
1 Folk/Country   553  7.32 0.947
2 Rock          5906  7.05 1.29
As shown above, there are 553 observations, or albums, in the folk/country genre and 5906 observations in the rock genre. Although there is a large discrepancy, 553 is a large enough sample size to conduct an unbiased statistical analysis. The mean score given by audience for the folk/country albums (7.32) is higher than that of rock albums (7.05), which means generally Pitchfork leans more positively towards folk/country music than rock music.
Additionally, the standard deviation for folk/country genre is less than rock, i.e., 0.96 < 1.29, which means Pitchfork’s reviews are more diversified in the rock music genre. On the other hand, folk/country music receives a higher and more unified score from around 1960 until now.
Below is a visualization is general score distribution for the two genres:

To better compare how the trend of people’s tastes goes over the past 60 years, we created a visualization to compare scores along the years for these two genres of interest. We chose to visualize this with a line graph, since line graphs make it easy to reflect the score change with time. We chose to facet the graph to better see any trends in each individual genre while also being able to compare them side by side as well.
`summarise()` has grouped output by 'genre'. You can override using the
`.groups` argument.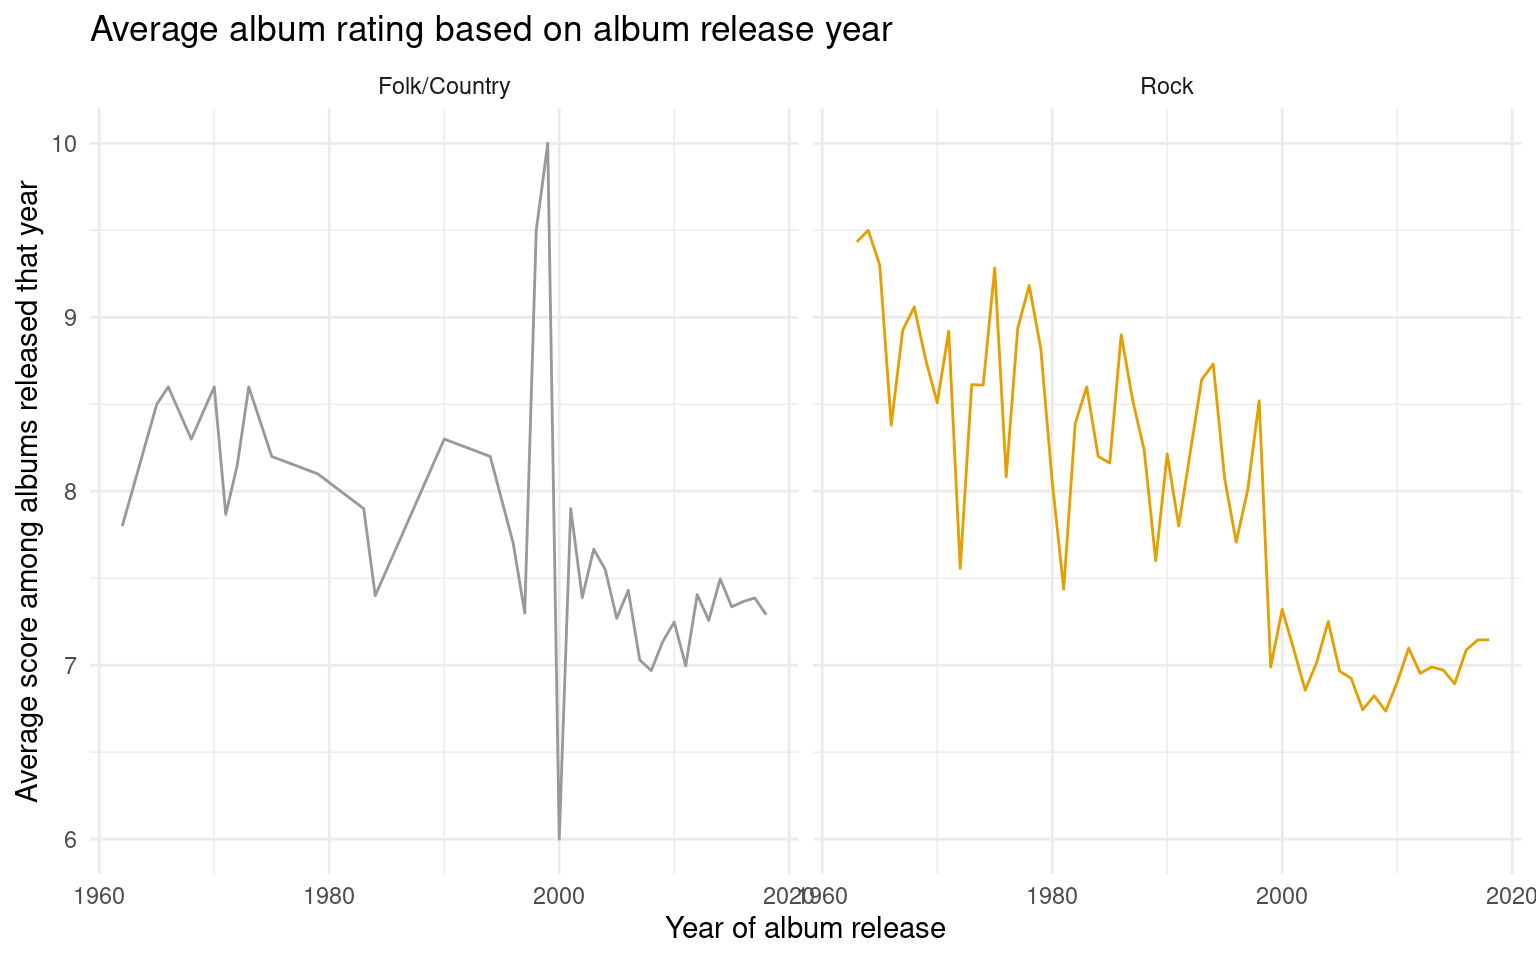
It’s interesting to observe that people’s opinion towards folk/country albums weren’t very high in 1960s, but the stable fluctuation was followed by a peak in the score around 1998, maybe due to some famous folk/country album coming out. After the peak, people’s enthusiasm towards folk/country seemed to calm down and remained around 7~7.5 for the rest of the time until now.
On the other hand, rock albums didn’t seem to have a peak period; instead, they are constantly declining in their ability to satisfy audiences’ tastes, particularly around 1998 - there seemed to be a big drop in score for rock albums at exactly the same time when folk/country received peak reviews. It remained fluctuating around 7.0 for recently years, doing worse than folk/country music.
Overall the trend seems more optimistic for folk/country albums since they had the peak period around 1998, but undeniably both genre’s review scores are in declining trend, gradually being replaced by other, more modern music genres.
To investigate the declining popularity in quantified terms, we fit a linear regression model for the genres to see the trend of people’s taste change with respect to year and genre. We chose an interactive model since the changes in trend seem to make a large difference (for the rock genre graph, the score is declining much faster), and only an interactive model can incorporate the discrepancy.
# A tibble: 4 × 5
  term                   estimate std.error statistic    p.value
  <chr>                     <dbl>     <dbl>     <dbl>      <dbl>
1 (Intercept)             51.2     10.1          5.09 0.00000199
2 release_year            -0.0218   0.00505     -4.32 0.0000408
3 genreRock               45.0     13.3          3.38 0.00108
4 release_year:genreRock  -0.0226   0.00669     -3.38 0.00109
\[ score = 51.2 - 0.0218 \times release~year + 45.02 \times Rock - 0.0226 \times Rock \times release~ year \]
The negative slopes for both genres seem to verify our initial conjecture: the popularity (in terms of score) for both Folk/country and Rock music are declining. For each year that passes, the score for Folk/country is expected to decrease by 0.0218, and the score for Rock is expected to decrease by 0.0444, about twice compared to Folk/country.
As of the intercepts, for release year 0, Folk/Country albums are expected to receive a score of 51.2 and Rock albums are expected to receive a score around 96. This doesn’t give any meaningful interpretation though as both the release year and score don’t make any sense.
Evaluation of significance
Analysis 1:
Null Hypothesis: The score of a review is independent of what source the review originates from.
\[ H_{0} = \mu_p - \mu_f = 0 \]
Alternative Hypothesis: The score of a review is not independent from what source it originates from. Any difference observed is not due to natural variability, but rather due to Fantano or Pitchfork having different standards.
\[ H_A = \mu_p - \mu_f \ne 0 \]
Before conducting our hypothesis test, we will pivot the data frame so that each review is its own row.
After slightly altering the dataframe, we will now conduct our hypothesis test using our point estimate and visualize it below.
Response: Score (numeric)
Explanatory: Author (factor)
# A tibble: 1 × 1
   stat
  <dbl>
1  1.02
# A tibble: 1 × 1
p_value
<dbl>
1 0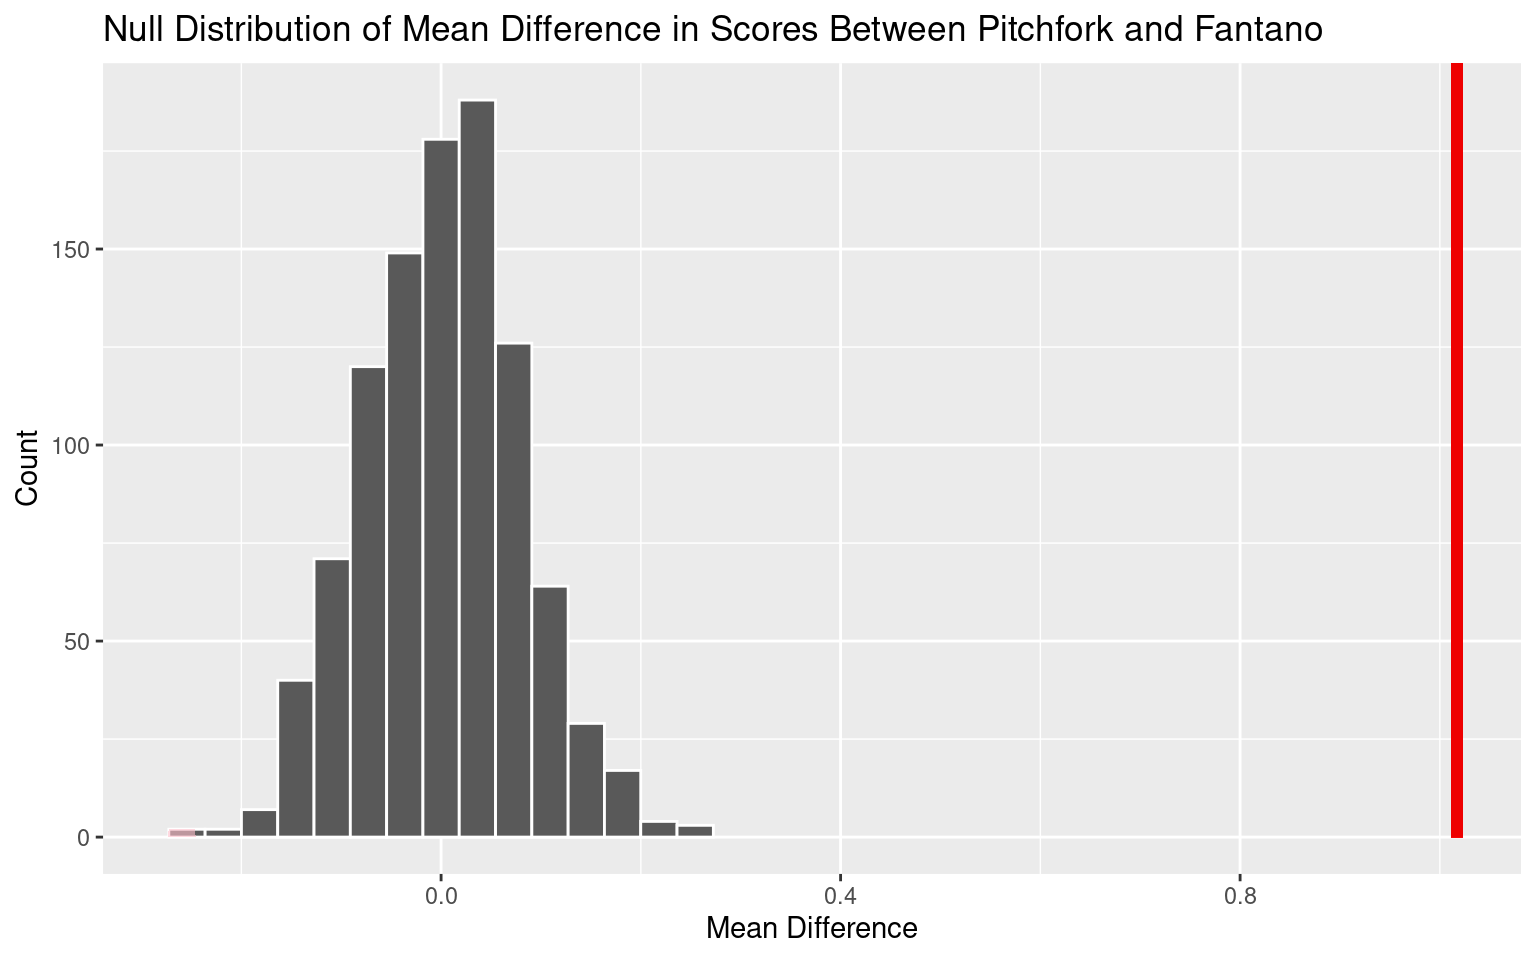
Our p-value is 0. If in fact the score of a review is independent of what source the review originates from, the probability of observing a sample of differences in album scores between reviewers where the average difference in score is 1.02 or higher, or -1.02 or lower, is approximately 0.
Since the p-value is less than the significance level of 0.05, we reject the null hypothesis. The data provide convincing evidence that the score of a review is not independent from what source it originates from.
Analysis 2:
Null hypothesis:
The true difference between the average scores of the Rock and Folk/Country music over the years is insignificant.
\[H_{0}:\mu_1 - \mu_2 = 0\]
Alternative hypothesis:
The true difference between the average scores of the Rock and Folk/Country music over the years is significant.
\[H_{A}:\mu_1 - \mu_2 \neq 0\]
Before conducting our hypothesis test for this research question, we will alter our Pitchfork dataset by selecting the three most important columns: genre, release_year, and mean_score and creating a column for the difference in mean scores between rock and folk/country albums.
After doing so, we will now conduct our hypothesis test.
Response: diff_score (numeric)
Explanatory: after1990 (factor)
# A tibble: 1 × 1
   stat
  <dbl>
1 0.743
# A tibble: 1 × 1
p_value
<dbl>
1 0.002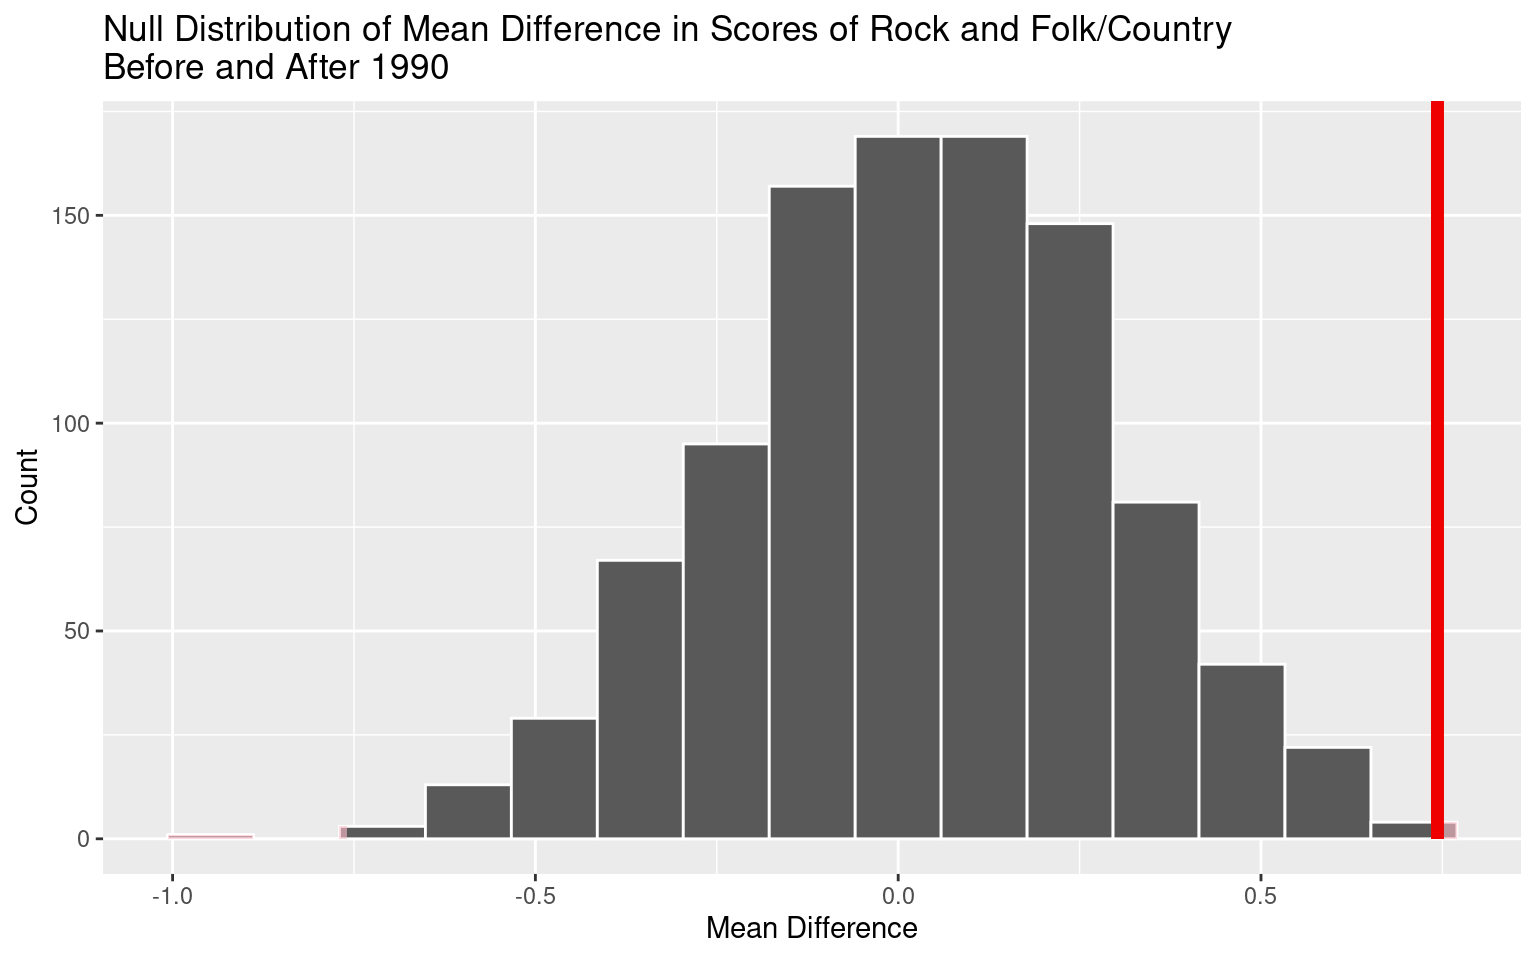
If in fact the true difference in the mean average score of the two genre before and after 1990 is 0, the probability of observing a sample of 36 years of difference in scores where the average difference in score is 0.743 or higher, or -0.743 or lower, is approximately .002.
Since the p-value is less than the significance level of 0.05, we reject the null hypothesis. The data provide convincing evidence that the difference between the mean scores of the Rock and Folk/Country albums before and after 1990 is significant.
Interpretation and conclusions
In our Evaluation of Significance section, we found at the conclusion of our hypothesis tests that we were able to reject both of our null hypotheses. Using the data, we can conclude that the score of an album is not independent from the source that reviewed it. In other words, whether an album was reviewed by Pitchfork or Fantano affected its score. We can also conclude that the difference between the mean scores of the Rock and Folk/Country albums before and after 1990 is significant, which our graphs and model from our exploratory data analysis also support. We are confident in these conclusions because we had data sets with large sample sizes to work with and the datasets came from well-known sources. However, we still acknowledge that our conclusions may not be one hundred percent true due to the potential limitations of our data listed below.
Limitations
There were some significant limitations in our data. The Fantano dataset only contains data from 2013 to 2021, so it is missing both the beginning of his career and his most recent work. For the Pitchfork dataset, it contains all reviews from 1971 to 2019, so it is 4 years behind. This mismatch also means that the two datasets only overlap for 6 years, making the pool of albums to compare limited.
Joining also has some concerns due to the fact that we joined by album name, which may be spelled somewhat differently across the two datasets. Differences like including/excluding dashes, apostrophes, or text in parentheses would be easy for a human to ignore, but R is joining by exact text matches. String variables are also generally difficult to analyze even outside of this specific join. This definitely influenced our study, as we heavily focused on numeric and categorical variables.
Genres are also a problem, as any song and especially any album can be classified as any number of genres or genre mixes. In our analysis of genres in analysis 2, there may be people who disagree with the classifications of certain albums in those genres, and if those people had tagged the reviews our results would be different. This means that subjectivity has influenced our results somewhat.
These reviews also came from a blogger and a publication, both relatively small sources of opinion compared to the public at large. While it may have been more interesting and impactful to study something like billboard numbers, any algorithm that tracks public popularity will be biased in some respect due to what it does and doesn’t factor into its totals.
Acknowledgments
We want to acknowledge the sources for our two data sets—Pitchfork and Anthony Fantano. The datasets were obtained from: https://www.kaggle.com/datasets/apat0saur/theneedledrop-reviews?resource=download and https://www.reddit.com/r/datasets/comments/apdpzz/20783_pitchfork_reviews_jan_5_1999_jan_11_2019/. Without them, our entire report and analyses that we conducted wouldn’t be possible. We would also like to acknowledge and thank Team Elegant Raichu and Team Elegant Evee for all of their helpful feedback on our project, especially Elegant Raichu for helping us think about work relevant to our topic that we could carry out in the future.
We also want to thank INFO 2950 course staff for suggesting useful statistical methods and modifications. The tools we used for data analysis were learned through the helpful course material at: https://info2950.infosci.cornell.edu/.