Research question(s). State your research question(s) clearly.
What effects do positive and negative sentiments in written tweets, as well as the use of buzzwords/hot button issues within those tweets have on the total engagement rate of online users (both in the aggregate and proportional to existing follower counts) for members of Congress? Are Republicans or Democrats more likely to tweet positively?
Data collection and cleaning
Have an initial draft of your data cleaning appendix. Document every step that takes your raw data file(s) and turns it into the analysis-ready data set that you would submit with your final project. Include text narrative describing your data collection (downloading, scraping, surveys, etc) and any additional data curation/cleaning (merging data frames, filtering, transformations of variables, etc). Include code for data curation/cleaning, but not collection.
Data Collection: First, we decided to collect out data from twitter. However, they stopped offering free API recently, so we had to use an external tool. Using R to scrape twitter posts is very complicated, so we found an tool called Apify, which allowed us to collect the data for our dataset. We also found a list of all members of the house of representatives and their twitter handles using the website: https://pressgallery.house.gov/member-data/members-official-twitter-handles. We input their twitter handles into Apify to scrape the first 50 tweets off everyone’s page. When the scraping was complete, however, we realized that it did not include their political affiliation - something that we were planning to build are research around so we had to merge the two datasets (the one with political affiliations and the one with tweets) by their twitter handles using a join function. After we had all their tweets, we wanted to identify their sentiment, so we decided to use an R function called “sentimentr.” It can analyze a sentence and provide a numeric value for sentiment. The tweets, however, consisted of multiple sentences, so we decided to keep the average sentiment rating of all sentences in a tweet as the tweet sentiment rating. After doing this, we found another dataset that included over 8,000 politically-charged buzzwords and their bias ratings. Below, please find the code for iterating over the tweets and identifying the number of buzzwords used in them, as well as the average buzzword bias rating for each tweet. After removing some unnecessary columns and cleaning up the data, we got the resulting dataset titled reps_tweets_buzzwords which is a merge of 3 datasets, one of which we produced on our own by scraping twitter data.
Data Curation/Cleaning: Using our original data file, we select only 18 columns from the original 169 that we feel can be used effectively in our analysis. From there, we use a supplemental dataset (BuzzWords.csv) that assigns bias scores to key buzzwords that are likely to show up in tweets to aggregate the bias score of a tweet based on any buzzwords found in the text.
library(stringr)#import data and reduce columns to 18 identified columns of interest:#these include time created, times favorited, the full tweet, hashtags, reply#count, retweet count, url, user description, total user favorites, follower#count, user friends count, user location, representative name, view count,#political affiliation (r or d), and tweet sentimentreps_tweets <-read_csv("data/reps_tweets.csv")
New names:
Rows: 20352 Columns: 169
── Column specification
──────────────────────────────────────────────────────── Delimiter: "," chr
(87): full_text, hashtags_0, hashtags_1, hashtags_2, media_0_media_url,... dbl
(48): ...1, conversation_id, favorite_count, id, quoted_tweet_number_so... lgl
(30): is_quote_tweet, quoted_tweet_is_quote_tweet, quoted_tweet_user_co... dttm
(4): created_at, quoted_tweet_created_at, quoted_tweet_user_created_at...
ℹ Use `spec()` to retrieve the full column specification for this data. ℹ
Specify the column types or set `show_col_types = FALSE` to quiet this message.
• `` -> `...1`
Rows: 7973 Columns: 7
── Column specification ────────────────────────────────────────────────────────
Delimiter: ","
chr (1): phrase
dbl (6): total_occurrences, bias_score, p_dem, p_rep, n_dem, n_rep

ℹ Use `spec()` to retrieve the full column specification for this data.
ℹ Specify the column types or set `show_col_types = FALSE` to quiet this message.
# Define a function to calculate the buzzword count and average bias for a single tweetcalc_buzzword_stats <-function(tweet_text) {# Split the tweet text into words tweet_words <-strsplit(tweet_text, "\\W+")[[1]]# Find the matching buzzwords in the buzzwords dataset matched_buzzwords <- buzzwords |>filter(str_to_lower(phrase) %in%str_to_lower(tweet_words))# Calculate the total number of buzzwords in the tweet num_buzzwords <-nrow(matched_buzzwords)# Calculate the average bias of the matched buzzwords avg_buzzword_bias <-mean(matched_buzzwords$bias_score)# Return the results as a tibblereturn(tibble(num_buzzwords = num_buzzwords, avg_buzzword_bias = avg_buzzword_bias))}#aggregate buzzword statistics per observation to get a tweet's bias scorereps_tweets_buzzwords <- tweets |>rowwise() |>mutate(buzzword_stats =calc_buzzword_stats(full_text),num_buzzwords = buzzword_stats$num_buzzwords,avg_buzzword_bias_score = buzzword_stats$avg_buzzword_bias) |>select(-buzzword_stats)#save data as final csv file ready for usereps_tweets_buzzwords |>filter(!is.na(affiliation))
There are 20,061 rows and 18 columns in the data set.
This data set, created via our web scraper, was creating to produce the most up to date data on Twitter posts by US politicians.
Most of the column names are self-explanatory. The few complicated columns are explained above.
There was no funding towards this data set as it was created by our team.
As we scraped as over 20,000 tweets, our goal was to collect as many observations as possible. It is possible that a particular politician may have deleted tweets. This could possible have an effect but that would be impossible to measure.
For preprocessing our data set, as mentioned before we targeted specific buzzwords with assigned bias scores from a supplemental data set.
The politicians were not aware of the data collection as data was collected from public sources.
Data limitations
Our data set is consisted of every tweet posted by a group of representatives, and we are using those tweets to analyze the effects of using buzzwords and positive/negative sentiments have on the total engagement rate. However, our buzzwords analysis only involve analysis on word level, not sentence level, so it might be hard to judge the intention in the tweet just by the words without connecting them. Any representative can include buzzwords in their tweets, but the judgement they express over these buzzwords could be ambiguous and cannot be picked up by our model throughout the whole tweets. In other words, we are only estimating the tweets on words level only.
Exploratory data analysis
Perform an (initial) exploratory data analysis.
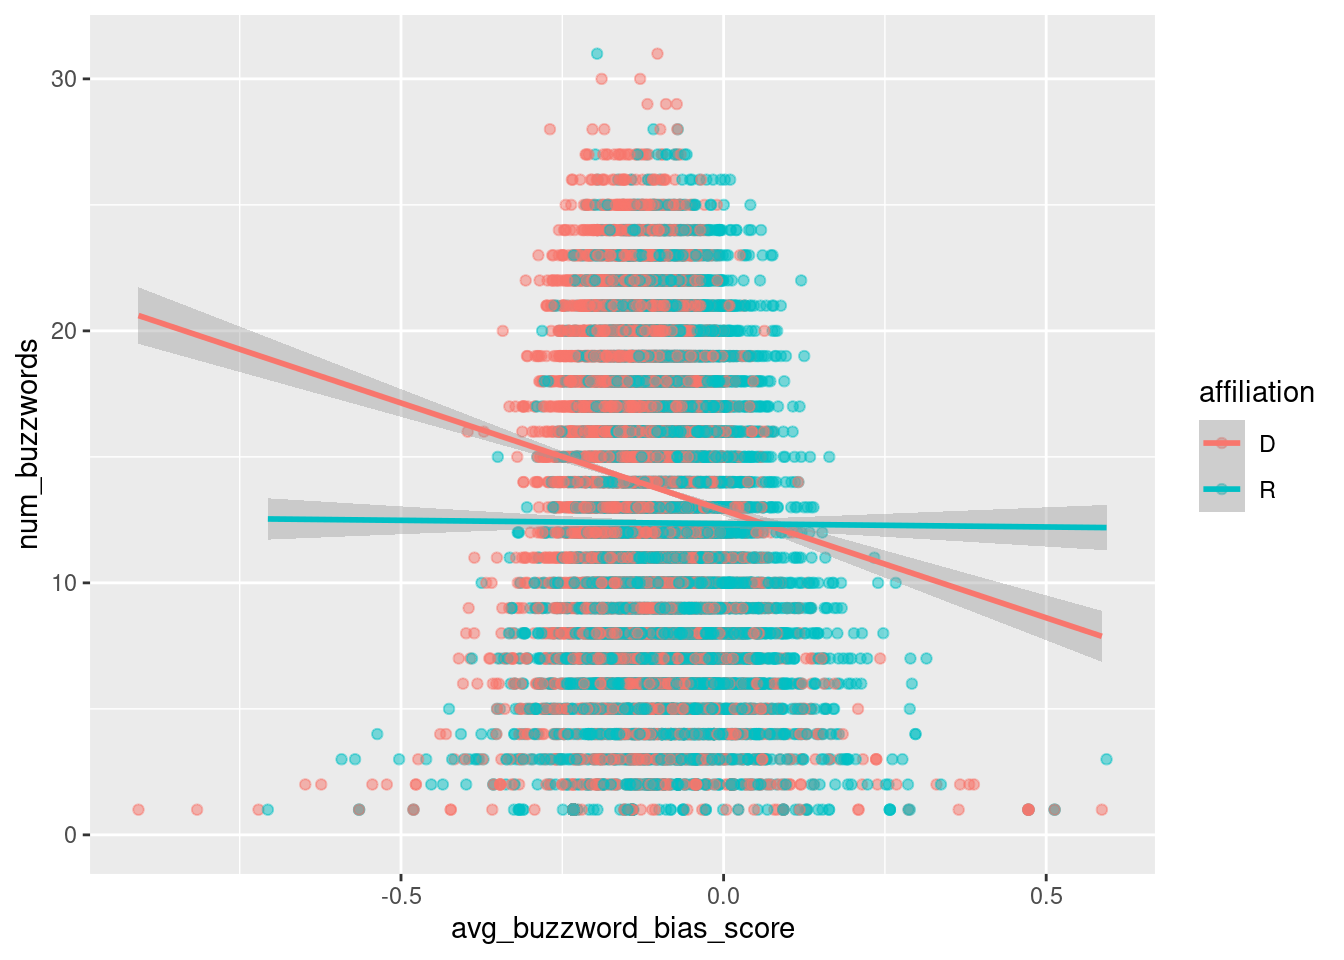
reps_tweets_buzzwords |>ggplot(aes(x = avg_buzzword_bias_score, y = num_buzzwords, color = affiliation)) +geom_point(alpha =0.5) +geom_smooth(method ="lm")
# Mean value of sentiment for R/Dreps_tweets_buzzwords |>group_by(affiliation) |>summarize(mean =mean(sentiment))
# A tibble: 2 × 2
  affiliation   mean
  <chr>        <dbl>
1 D           0.135
2 R           0.0689
# Mean value of buzzword bias for R/Dreps_tweets_buzzwords |>group_by(affiliation) |>summarize(mean =mean(avg_buzzword_bias_score, na.rm =TRUE))
# A tibble: 2 × 2
  affiliation    mean
  <chr>         <dbl>
1 D           -0.121
2 R           -0.0871
# Mean number of favorite count for R/Dreps_tweets_buzzwords |>group_by(affiliation) |>summarize(mean =mean(favorite_count, na.rm =TRUE))
# A tibble: 2 × 2
  affiliation  mean
  <chr>       <dbl>
1 D            396.
2 R            213.
# Mean number of view count for R/Dreps_tweets_buzzwords |>group_by(affiliation) |>summarize(mean =mean(view_count, na.rm =TRUE))
# A tibble: 2 × 2
  affiliation   mean
  <chr>        <dbl>
1 D           25851.
2 R           19790.
# Mean number of buzz words for R/Dreps_tweets_buzzwords |>group_by(affiliation) |>summarize(mean =mean(num_buzzwords, na.rm =TRUE))
# A tibble: 2 × 2
  affiliation  mean
  <chr>       <dbl>
1 D            13.8
2 R            12.3
Questions for reviewers
List specific questions for your peer reviewers and project mentor to answer in giving you feedback on this phase.
We are unsure if there are any other variables that we can use to explore our data. Please give us any idea that come to your mind when you are reading this.
As for the limitations that are described, we are unsure how much bias will our method of analysis include. If there are bias, are those bias normal distributed?