Project Strength
Report
Introduction
Powerlifting continues to grow in popularity around the world, and as in any other sport, analyzing statistics and trends across variables plays a crucial role in understanding and maximizing performance.
This report’s analysis utilized data from https://www.openpowerlifting.org/, a website that aggregates data from professional powerlifting competitions around the world, in order to begin answering the following research questions:
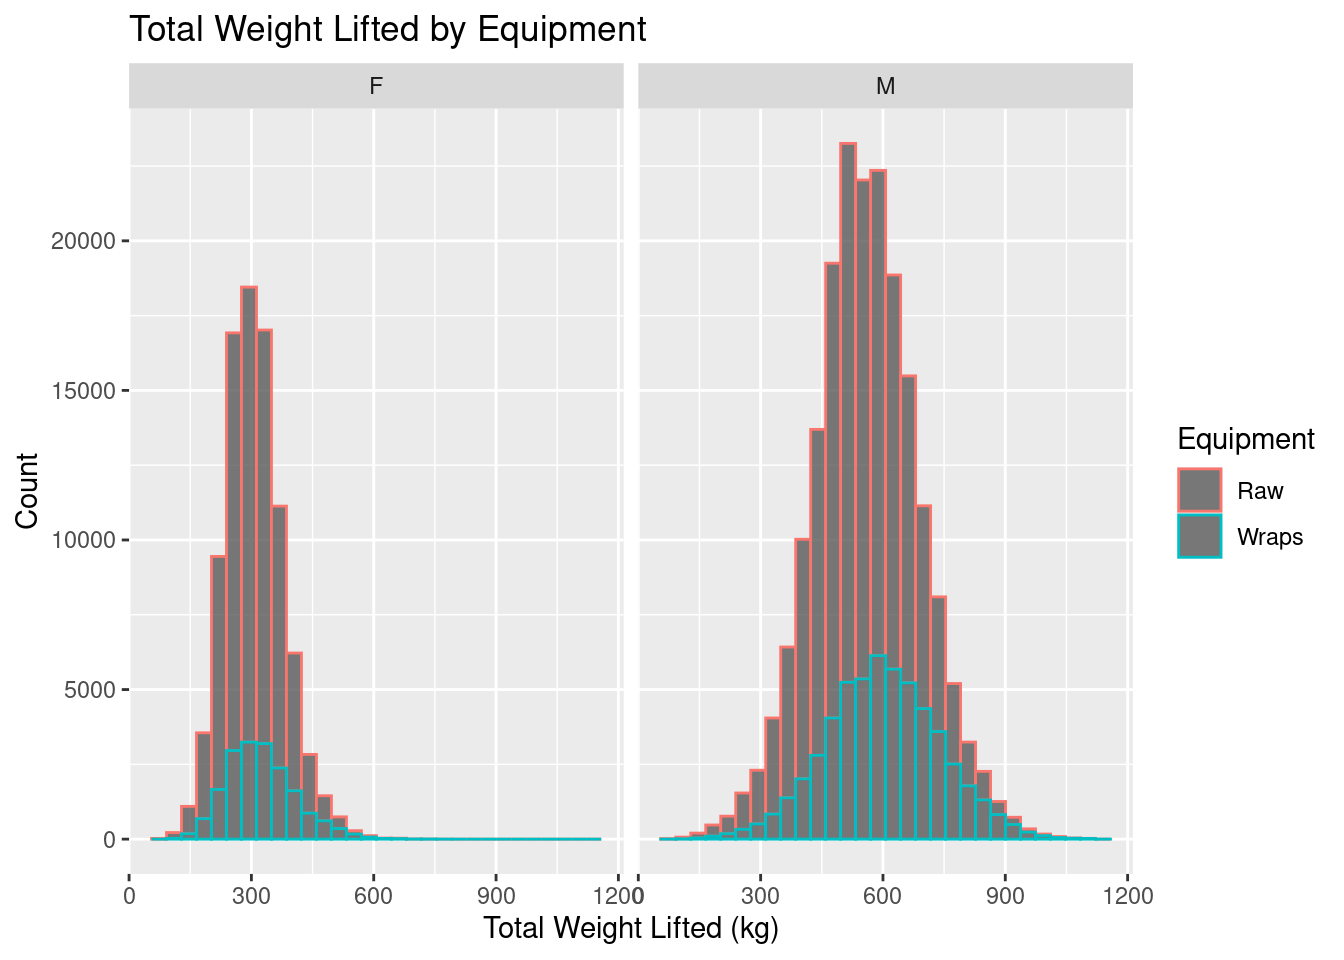
Does the (non)-use of certain equipment (wraps vs. no wraps) have an impact on total weight lifted in powerlifting competitions?
How does age affect total weight lifted in powerlifting competitions?
Does federation have an impact on total weight lifted in powerlifting competitions?
By tidying the data, creating visualizations, generating confidence intervals, performing ANOVA tests, and carrying out comprehensive descriptive and statistical analyses, trends supporting or refuting predictions regarding the research questions were discovered and analyzed.
A brief summary of the results:
- Descriptive analysis gave no indication of a difference between performance upon using equipment (wraps vs no wraps). However, a 95% confidence interval test revealed a 95% confidence rate that the mean total weight lifted by those who use wraps is, on average, 68.5 to 71.2 kg higher than the mean total weight lifted by those who don’t use wraps. Further analysis is likely required.
- Descriptive analysis showed a negative relationship between total weight lifted and age, indicating that an increase in age is associated with a decrease in total weight lifted. A 95% confidence interval corroborated this result, with the mean total weight lifted for young powerlifters (20-30 age group and below) being, on average, 8.1 to 10.6 kg higher than the mean total weight lifted for old powerlifters (30-40 age group and above).
- The use of an ANOVA test and the subsequent generation of a summary model revealed that significant differences in means (for total weight lifted) exist across federations. This seems to indicate that factors may exist across federations that lead to statistically significant differences in lifting performance.
Data description
The data was sourced from https://www.openpowerlifting.org/, a website that aggregates competitive powerlifting data.
The original data set consisted of 1,423,354 observations (rows)-where each represented a single instance of a powerlifting record-and 37 attributes (columns)-where each represented a descriptive characteristic of the record.
The data was already in a relatively intuitive format and was simply cleaned using base or dplyr functions such as:
select() - to select only variables:
Age - the age of the powerlifter who the record belongs to
BodyweightKg - the bodyweight of the powerlifter, in Kg
TotalKg - the total weight, in Kg, lifted by the powerlifter,
Equipment - the type of equipment the powerlifter used
Event - the type of powerlifting event
Federation - the powerlifter’s chosen federation
Sex - the powerlifter’s sex
mutate() - to create a new variable:
- age_group - groups ages by 10 from 10-80
filter() - to select only “wraps” and “raw” for the Equipment variable & only “SBD” for the Event variable
na.omit() to remove rows with missing values
Thus, the clean and analysis-ready data set contained 283,018 observations (rows) and the eight attributes (columns) Age, BodyweightKg, TotalKg, Equipment, Event, and Federation, Sex, and age_group.
It should be noted that BodyweightKg and TotalKg are both measured in Kilograms because nearly every powerlifting competition even in the United States uses Kilograms as the measurement. Also, for further clarification, TotalKg represents the total kilograms each powerlifter lifted in only squat, bench, and deadlift (SBD) events, and Equipment represents whether or not the powerlifter used wraps or nothing at all when competing.
The creation and maintenance of this (constantly updating) data set is carried out by a team of around eight avid powerlifters who recognized a lack of a unified results aggregation system for powerlifting competition data. The site is fully-funded by donations, and the creators continue to turn down advertisers to maximize user experience. Self-identifying as powerlifting data librarians, they’ve pledged to keep the site free and release all data into the public domain.
The creators source the data from publicly-available federation sites, but they admit that a key limitation exists in the outdated and bad technology used by the vast majority of federations. That is, most federations use PDF files instead of databases to store their data, meaning that entering this data often needs to be done painstakingly by hand and requires manual review. Even with programs that simplify the conversion process, the current data aggregation system is extremely error-prone; this may leave room for erroneous and/or missing data.
Data analysis
Summary Statistics & Data Visualizations:
  age_mean   age_sd totalkg_mean totalkg_sd
1 29.78512 11.71622     480.2499   164.3158
Research Question 1: Does the use of equipment (wraps vs. no wraps) have an impact on lifting performance in powerlifting competitions?
Research Question 2: How does age affect total weight lifted in powerlifting competitions?
Research Question 3: Does the type of federation (lifting organization) have an impact on lifting performance in powerlifting competitions?
Evaluation of significance
Research Question 1: Does the use of equipment (wraps vs. no wraps) have an impact on lifting performance in powerlifting competitions?
We use bootstrapping to estimate the difference between the mean total weights lifted for individuals who use wraps vs. no wraps. We then calculate the 95% confidence interval.
# A tibble: 1 × 2
  lower_ci upper_ci
     <dbl>    <dbl>
1     68.5     71.2
Research question 2: How does age affect total weight lifted in powerlifting competitions?
We use bootstrapping to estimate the difference between the mean total weights lifted for individuals who are young (those who fall in the 20-30 age bracket or lower) versus old (older than 20-30 age bracket). We then calculate the 95% confidence interval.
# A tibble: 1 × 2
  lower_ci upper_ci
     <dbl>    <dbl>
1     8.06     10.6
Research Question 3: Does the type of federation (lifting organization) have an impact on lifting performance in powerlifting competitions?
We use an ANOVA test to estimate the difference in means for several federations. We then print a table of the results.
                Df    Sum Sq Mean Sq F value Pr(>F)
Federation     179 3.283e+08 1834007   70.93 <2e-16 ***
Residuals   282838 7.313e+09   25856
---
Signif. codes:  0 '***' 0.001 '**' 0.01 '*' 0.05 '.' 0.1 ' ' 1
Interpretation and conclusions
Research Question 1:
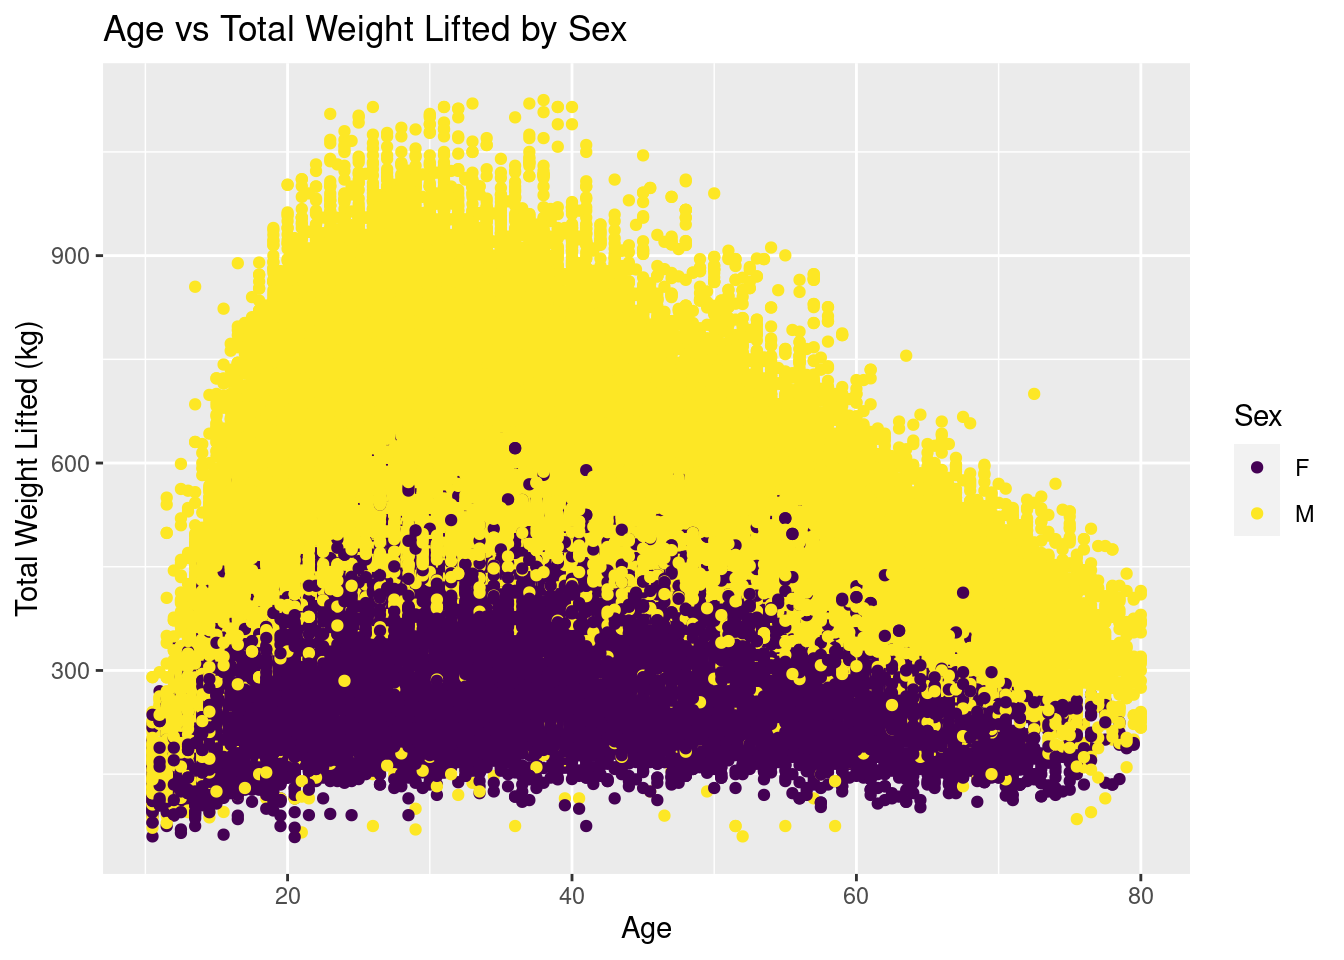
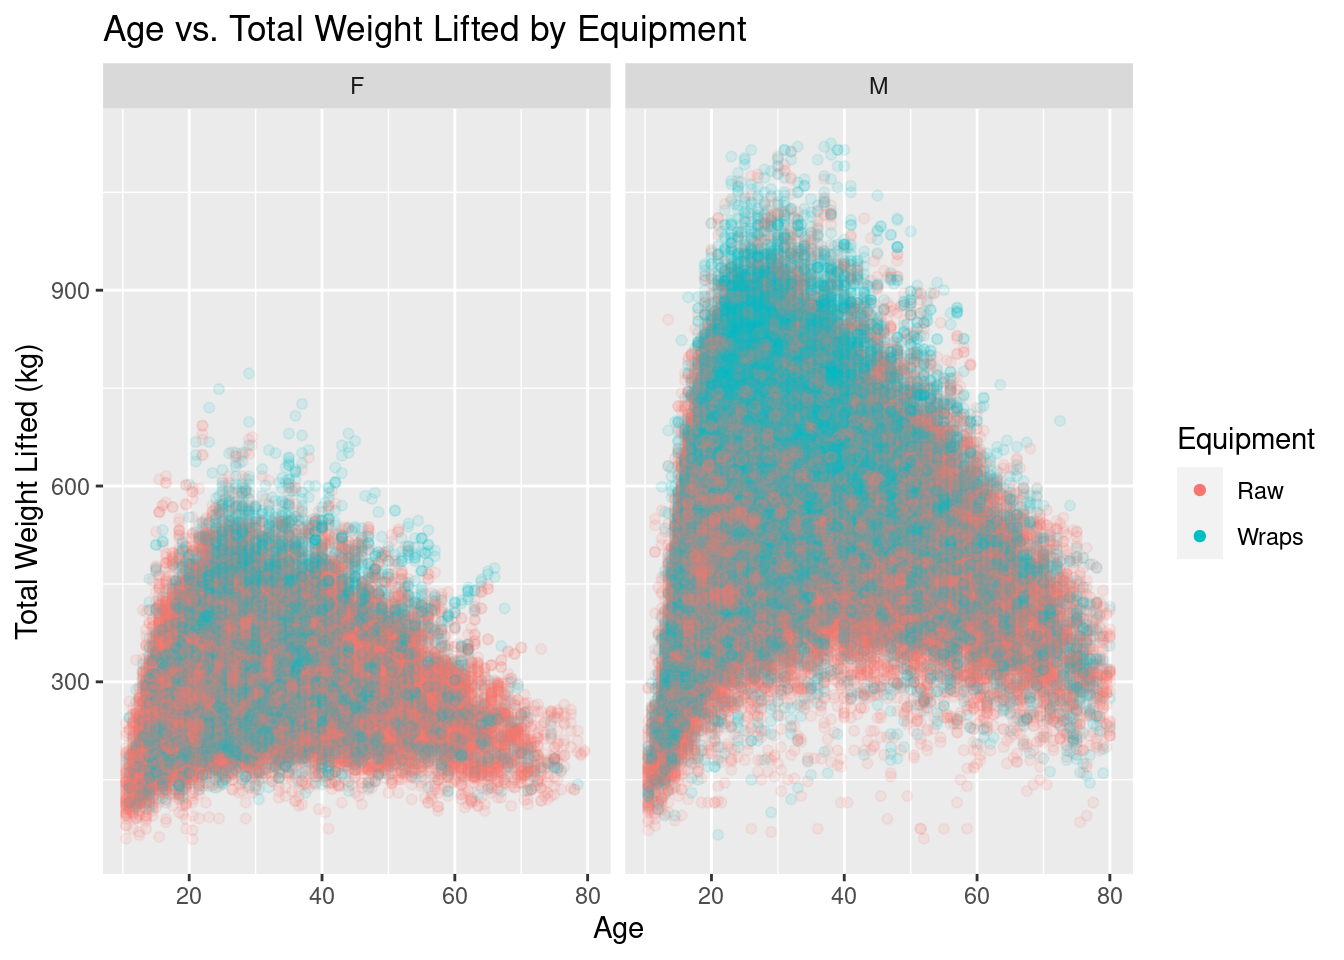
The side-by-side scatter plots (faceted by sex) graphing age versus total weight lifted colored by equipment (wraps vs. no wraps) indicated that male and female lifters showcase similar right-skewed bell curves regarding age versus total weight lifted, male lifters generally lift heavier amounts, and most notably, that lifters of either gender that achieve higher lift amounts aren’t using wraps significantly more than they aren’t using them.
The side-by-side histograms (faceted by sex) showcasing the number of individuals lifting various amounts of total weight by equipment corroborated the results from the scatter plots. More people of either sex use no wraps more than they use wraps, but both parties (no wraps vs. wraps users) tend to have the same distribution of total weight lifted. However, the center for males who use wraps does seem to be a little more to the right (higher total weight) compared to males who don’t use wraps.
Bootstrapping and generating a 95% confidence interval revealed that we are 95% confident that the mean total weight lifted by those who use wraps is 68.5 to 71.2 kg higher than the mean total weight lifted by those who don’t use wraps.
These results don’t fully corroborate each other, and further analysis may be needed.
Research Question 2:
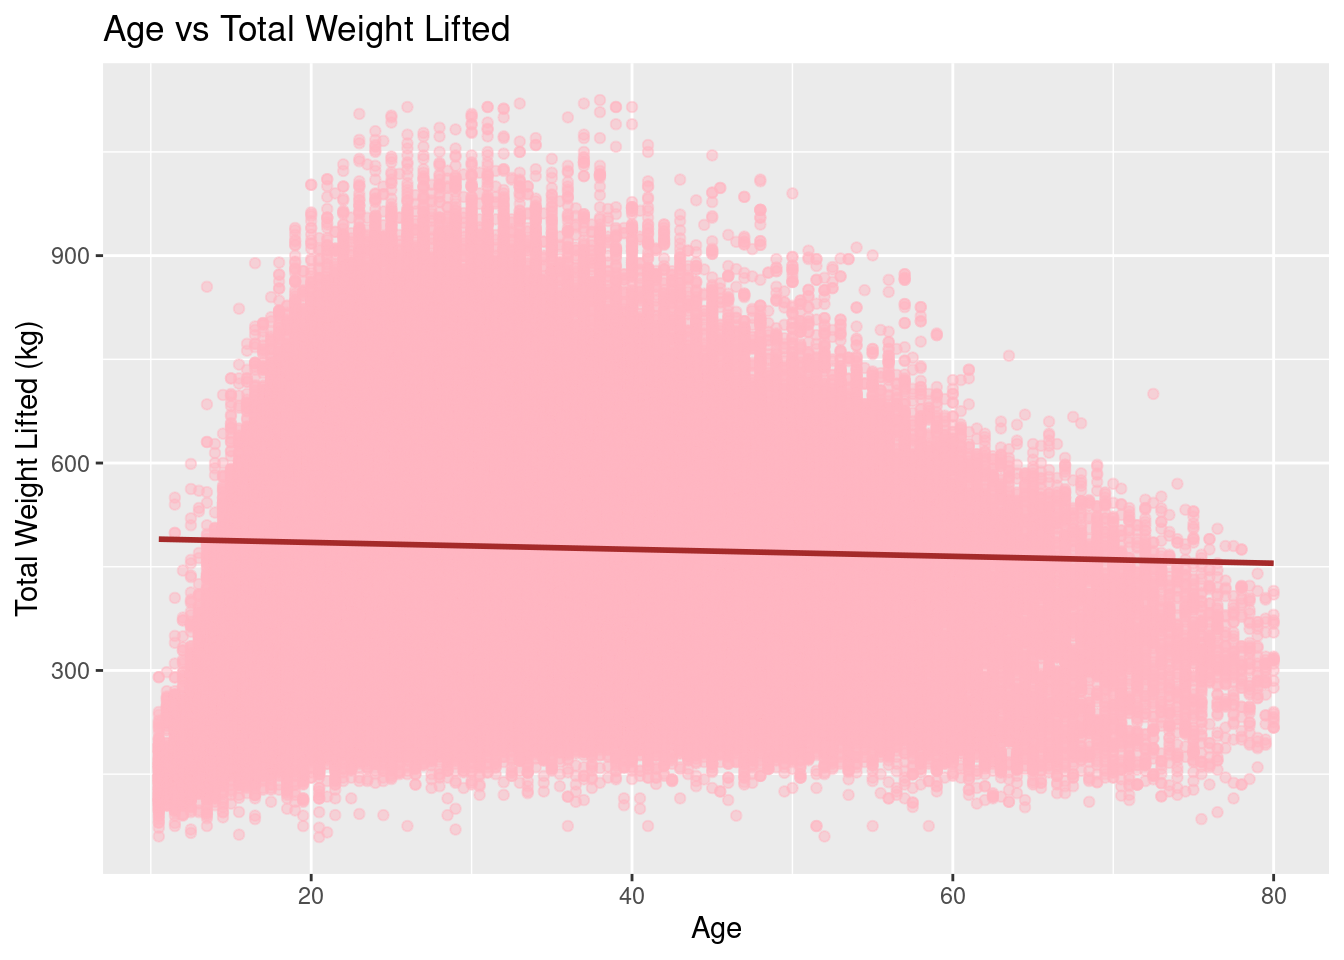
The scatter plot graphing age versus total weight lifted featured a line of best fit with a negative slope, indicating that an increase in age is associated with a decrease in total weight lifted.
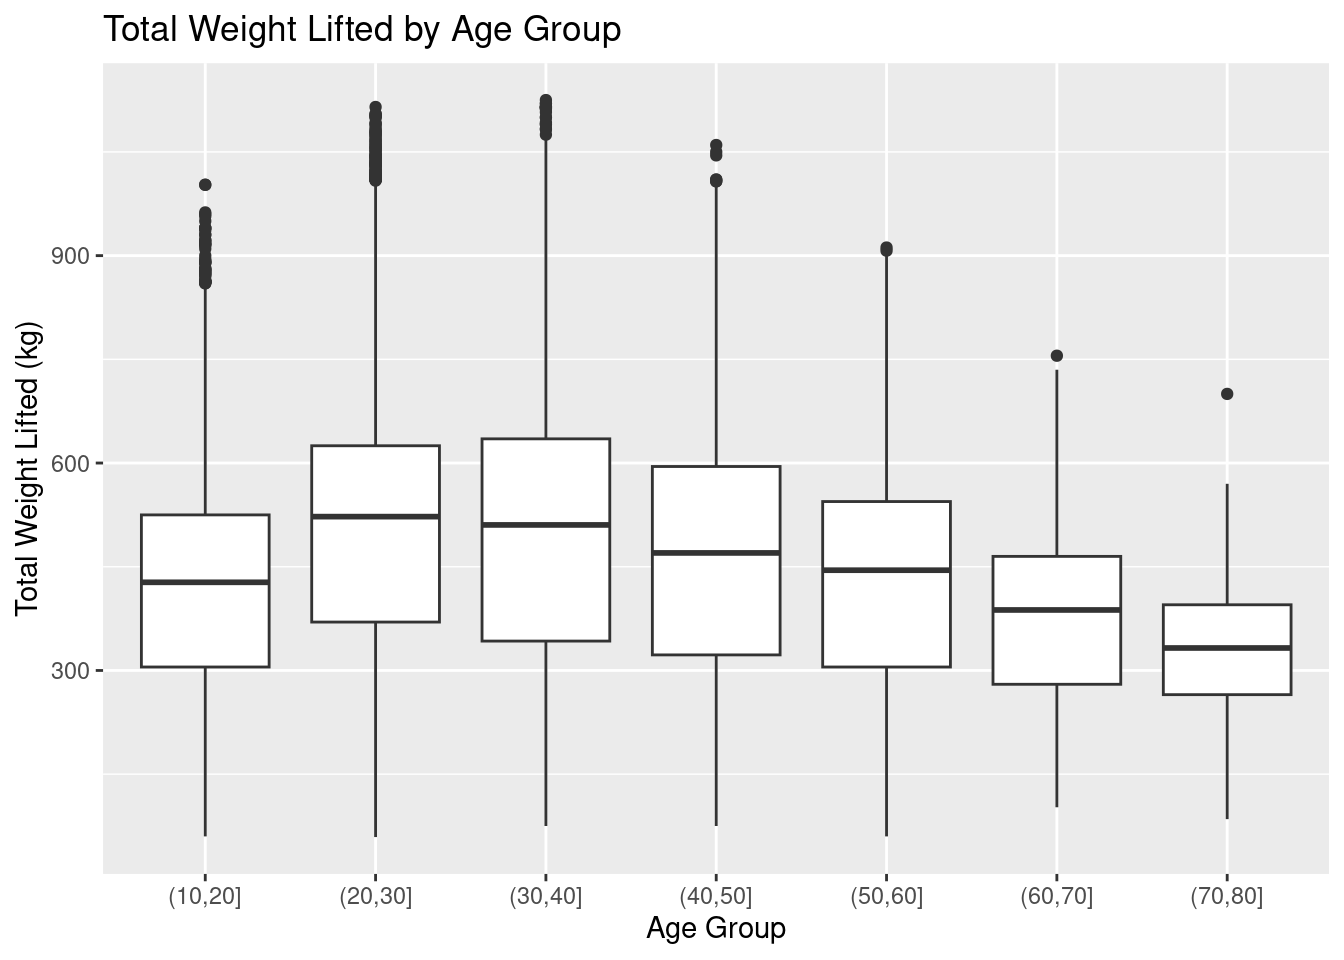
The side-by-side box plots graphing age groups versus total weight lifted reveal a similar trend. Total weight lifted peaks between the ages of 20-40 and noticeably dips in each subsequent age group.
Bootstrapping and generating a 95% confidence interval corroborated the results shown in the aforementioned graphs, and we are 95% confident that the mean total weight lifted for young powerlifters (20-30 age group and under) is 8.1 to 10.6 kg higher than the mean total weight lifted for old powerlifters (30-40 age group and over).
These results support the idea that younger lifters generally lift more weight than older lifters; this in turn supports our hypothesis.
Research Question 3:
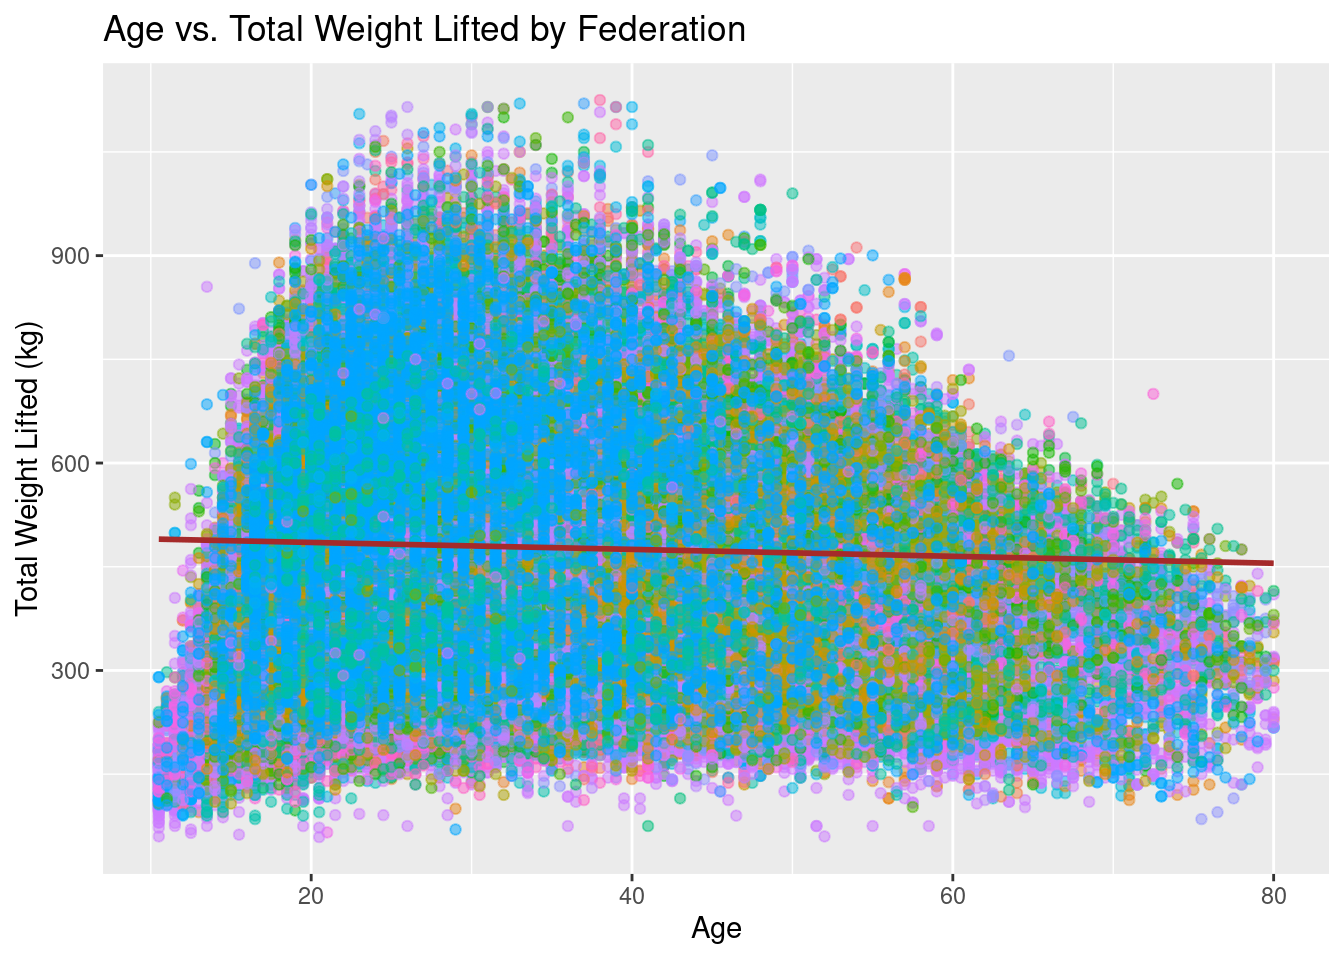
The scatter plot graphing age versus total weight lifted colored by federation indicated a negative correlation.
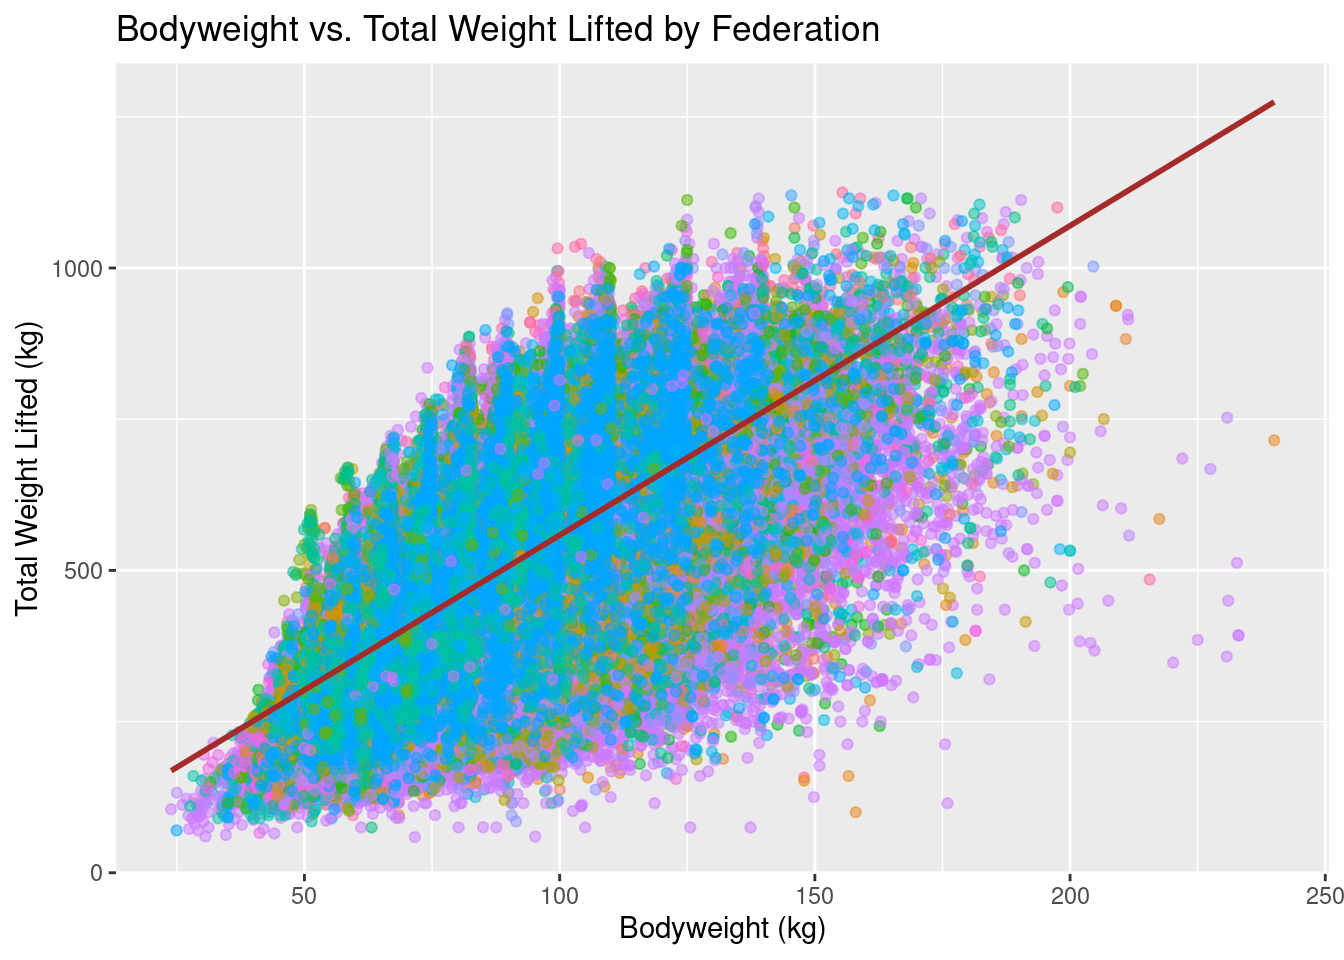
The scatter plot graphing body weight versus total weight lifted colored by federation indicated a positive correlation.
The ANOVA test allows us to compare the means of the total weight lifted across the different federations to see if there are any significant differences. The test results indicated that there were significant differences in the means of total weight lifted across the different federations, suggesting that the type of federation does have an impact on lifting performance.
Limitations
Limited Information on Participants: The data set does not include detailed information on participants, such as their training regimen, nutrition, or injury history, which may limit the ability to draw meaningful conclusions from the data. There are still many factors this data set does not account for who’s influences may impact the power lifter’s abilities and their results
Selection Bias: The data set may be biased towards individuals who compete in power lifting meets, and may not accurately represent the overall population of individuals who engage in power lifting. This data is collected by voluntary participation, contestants send in their results. What about all other power lifters who do not share results?
Incomplete Data: There are missing data points for some variables in the data set, we can find many *NA* values in the quantitative variables. This may make certain analyses difficult or impossible.
Acknowledgments
Shoutout to Tidyverse, Rdocumentation, and StackOverflow for being good resources.