Project FeederWatch

Revealing Bird’s Secret

Author

Prepared by Gold Emu
Andrew H., Sabrina L., Jerry J., Michelle Z.

Published

March 1, 2024

Introduction to Data

Project FeederWatch: Survey of birds that visit backyards, nature centers, community areas, and other locales in North America from November to April.

  • Operated by the Cornell Lab of Ornithology and Birds Canada.

  • Contributions of individual FeederWatchers: Thousands of voluntary FeederWatchers in communities across North America count birds and send their tallies to the FeederWatch database.

  • Subset of 2021 Data: From November 2020 to April 2021, but data available through 1988 is available on the Project FeederWatch Official Website.

Research Questions

Topic question: What kind of environmental factors affect birds being more or less active?

  • Analysis 1 Research Question: Are birds, by bird species, more likely to be observed when there’s a lot of snow, there’s less snow, or doesn’t matter? What influence will the snow amount will have on the average flock size of the birds?

  • Analysis 2 Research Question: Do feeder types attract different species of birds?

Let’s Dive into Data Set!

── Attaching core tidyverse packages ──────────────────────── tidyverse 2.0.0 ──
✔ dplyr     1.1.4     ✔ readr     2.1.5
✔ forcats   1.0.0     ✔ stringr   1.5.1
<<<<<<< HEAD
✔ ggplot2   3.4.4     ✔ tibble    3.2.1
=======
✔ ggplot2   3.5.0     ✔ tibble    3.2.1
>>>>>>> ab75a1865bc252f18ae2094cdccdd86c78b5ec2a
✔ lubridate 1.9.3     ✔ tidyr     1.3.0
✔ purrr     1.0.2     
── Conflicts ────────────────────────────────────────── tidyverse_conflicts() ──
✖ dplyr::filter() masks stats::filter()
✖ dplyr::lag()    masks stats::lag()
ℹ Use the conflicted package (<http://conflicted.r-lib.org/>) to force all conflicts to become errors

Attaching package: 'maps'


The following object is masked from 'package:purrr':

    map


Attaching package: 'scales'


The following object is masked from 'package:purrr':

    discard


The following object is masked from 'package:readr':

    col_factor


Rows: 49999 Columns: 62
── Column specification ────────────────────────────────────────────────────────
Delimiter: ","
chr  (2): loc_id, proj_period_id
dbl (60): yard_type_pavement, yard_type_garden, yard_type_landsca, yard_type...

ℹ Use `spec()` to retrieve the full column specification for this data.
ℹ Specify the column types or set `show_col_types = FALSE` to quiet this message.
Rows: 100000 Columns: 22
── Column specification ────────────────────────────────────────────────────────
Delimiter: ","
chr  (8): loc_id, subnational1_code, entry_technique, sub_id, obs_id, proj_p...
dbl (14): latitude, longitude, month, day, year, how_many, valid, reviewed, ...

ℹ Use `spec()` to retrieve the full column specification for this data.
ℹ Specify the column types or set `show_col_types = FALSE` to quiet this message.
Rows: 15966 Columns: 15
── Column specification ────────────────────────────────────────────────────────
Delimiter: ","
chr (11): species_code, sci_name, primary_com_name, pri_com_name_indxd, auth...
dbl  (4): authority_ver, taxon_order, extinct, extinct_year

ℹ Use `spec()` to retrieve the full column specification for this data.
ℹ Specify the column types or set `show_col_types = FALSE` to quiet this message.
Rows: 100,000
Columns: 22
$ loc_id             <chr> "L12719505", "L2417980", "L228087", "L2501057", "L1…
$ latitude           <dbl> 45.03098, 44.60179, 33.87772, 47.79452, 40.48549, 3…
$ longitude          <dbl> -93.49726, -123.26413, -117.63187, -122.25087, -79.…
$ subnational1_code  <chr> "US-MN", "US-OR", "US-CA", "US-WA", "US-PA", "US-OH…
$ entry_technique    <chr> "/GOOGLE_MAP/ZOOM:15", "/GOOGLE_MAP/ZOOM:15", "Poin…
$ sub_id             <chr> "S83874024", "S80777498", "S85241604", "S89807956",…
$ obs_id             <chr> "OBS1100622328", "OBS1069883041", "OBS1117389926", …
$ month              <dbl> 3, 2, 4, 3, 1, 12, 12, 3, 1, 3, 12, 1, 3, 1, 1, 4, …
$ day                <dbl> 22, 6, 10, 20, 26, 29, 6, 12, 16, 6, 19, 12, 19, 30…
$ year               <dbl> 2021, 2021, 2021, 2021, 2021, 2020, 2020, 2021, 202…
$ proj_period_id     <chr> "PFW_2021", "PFW_2021", "PFW_2021", "PFW_2021", "PF…
$ species_code       <chr> "comgra", "wiltur", "bewwre", "bewwre", "whtspa", "…
$ how_many           <dbl> 4, 8, 1, 1, 3, 3, 2, 2, 3, 7, 1, 6, 4, 2, 1, 1, 3, …
$ valid              <dbl> 1, 1, 1, 1, 1, 1, 1, 1, 1, 1, 1, 1, 1, 1, 1, 1, 1, …
$ reviewed           <dbl> 0, 0, 0, 0, 0, 0, 0, 0, 0, 0, 0, 0, 0, 0, 0, 0, 0, …
$ day1_am            <dbl> 1, 1, 1, 1, 1, 0, 1, 1, 1, 1, 1, 0, 1, 1, 1, 1, 1, …
$ day1_pm            <dbl> 0, 1, 1, 1, 1, 1, 0, 1, 1, 1, 1, 1, 0, 1, 1, 1, 1, …
$ day2_am            <dbl> 1, 1, 1, 1, 1, 0, 0, 1, 1, 1, 1, 1, 1, 0, 1, 1, 1, …
$ day2_pm            <dbl> 0, 1, 0, 1, 1, 1, 0, 1, 0, 1, 1, 0, 1, 1, 1, 1, 1, …
$ effort_hrs_atleast <dbl> 1.001, 8.001, 1.001, 4.001, 1.001, 1.001, 0.001, 1.…
$ snow_dep_atleast   <dbl> 0.000, 0.000, 0.000, 0.000, 0.000, 0.000, 0.000, 0.…
$ data_entry_method  <chr> "PFW Mobile App v1.1.17", "PFW Web 4.1.4", "PFW Mob…

observation_data

Each row represents each unique observation occurrence.

  • loc_id: Unique identifier for each survey site.

  • species_code: Bird species observed, stored as 6-letter species codes.

  • how_many: Maximum number of individuals seen at one time during observation period.

  • snow_dep_atleast: Participant estimate of minimum snow depth during a checklist.

Let’s Dive into Data Set!

Rows: 49,999
Columns: 62
$ loc_id                       <chr> "L32349", "L72034", "L33529", "L37441", "…
$ proj_period_id               <chr> "PFW_1998", "PFW_2009", "PFW_1999", "PFW_…
$ yard_type_pavement           <dbl> NA, 0, NA, NA, 0, 0, 0, NA, 0, 0, 0, 0, 0…
$ yard_type_garden             <dbl> NA, 0, NA, NA, 0, 0, 0, NA, 0, 0, 0, 0, 1…
$ yard_type_landsca            <dbl> NA, 1, NA, NA, 1, 1, 1, NA, 1, 1, 1, 1, 0…
$ yard_type_woods              <dbl> NA, 1, NA, NA, 1, 0, 1, NA, 1, 0, 0, 1, 0…
$ yard_type_desert             <dbl> NA, 0, NA, NA, 0, 0, 0, NA, 0, 0, 0, 0, 0…
$ hab_dcid_woods               <dbl> NA, 0, NA, 0, 1, 0, 1, 1, 0, NA, 0, 1, 0,…
$ hab_evgr_woods               <dbl> NA, 0, NA, 0, 0, 0, 0, 1, 0, NA, 0, NA, 0…
$ hab_mixed_woods              <dbl> NA, 1, NA, 1, 1, 0, 0, 1, 0, NA, 0, 1, 0,…
$ hab_orchard                  <dbl> NA, 0, NA, NA, 0, 0, 0, 0, 0, NA, 0, 1, 0…
$ hab_park                     <dbl> NA, 0, NA, NA, 0, 0, 1, NA, NA, 1, NA, 1,…
$ hab_water_fresh              <dbl> NA, 0, NA, 1, 1, 1, 1, 0, 0, NA, 0, 1, 0,…
$ hab_water_salt               <dbl> NA, 0, NA, NA, 0, 0, 0, 0, 0, NA, 0, NA, …
$ hab_residential              <dbl> NA, 0, NA, 1, 0, 1, 1, 0, 1, 1, 1, 1, 1, …
$ hab_industrial               <dbl> NA, 0, NA, 0, 0, 0, 0, 0, 1, NA, 0, NA, 0…
$ hab_agricultural             <dbl> NA, 0, NA, NA, 1, 0, 0, NA, 0, NA, 1, 1, …
$ hab_desert_scrub             <dbl> NA, 0, NA, NA, 0, 1, 0, 1, 0, NA, 0, NA, …
$ hab_young_woods              <dbl> NA, 0, NA, NA, 1, 0, 1, NA, 0, NA, 1, 1, …
$ hab_swamp                    <dbl> NA, 0, NA, NA, 1, 0, 1, NA, NA, NA, NA, 1…
$ hab_marsh                    <dbl> NA, 0, NA, NA, 0, 0, 0, NA, 0, NA, 0, 1, …
$ evgr_trees_atleast           <dbl> NA, 4, NA, 3, 11, 4, 0, 3, 11, 11, 1, 4, …
$ evgr_shrbs_atleast           <dbl> NA, 1, NA, 3, 4, 0, 1, NA, 1, 11, 4, 1, 4…
$ dcid_trees_atleast           <dbl> NA, 4, NA, 3, 4, 4, 11, 3, 11, 4, 4, 4, 4…
$ dcid_shrbs_atleast           <dbl> NA, 0, NA, 3, 11, 11, 11, 3, 4, 4, 4, 1, …
$ fru_trees_atleast            <dbl> NA, 0, NA, NA, 1, 4, 1, NA, 1, 4, 0, 1, 4…
$ cacti_atleast                <dbl> NA, 0, NA, 0, 0, 0, 0, NA, 0, NA, 0, 0, 1…
$ brsh_piles_atleast           <dbl> NA, 1, NA, NA, 1, 0, 1, NA, 1, 1, 0, 0, 1…
$ water_srcs_atleast           <dbl> NA, 1, NA, NA, 1, 0, 1, NA, 0, 1, 0, 1, 0…
$ bird_baths_atleast           <dbl> NA, 0, NA, NA, 1, 0, 0, NA, 1, 1, 1, 1, 1…
$ nearby_feeders               <dbl> 1, 0, 1, 0, 1, 1, 0, 0, 1, 1, 1, 1, 1, NA…
$ squirrels                    <dbl> 1, 1, 1, 1, 0, NA, 0, 1, 1, 1, 0, NA, 0, …
$ cats                         <dbl> 1, 0, NA, 0, 1, 1, 1, 1, 1, 1, 0, 1, 1, N…
$ dogs                         <dbl> NA, 0, NA, 0, 1, NA, 1, 1, 0, NA, 1, NA, …
$ humans                       <dbl> NA, 0, 1, 1, 1, NA, 1, 1, 1, 1, 1, NA, 1,…
$ housing_density              <dbl> NA, 1, NA, 3, 1, 2, 3, 1, 3, 3, 2, 3, 3, …
$ fed_yr_round                 <dbl> NA, NA, NA, NA, NA, NA, 0, 1, NA, 1, NA, …
$ fed_in_jan                   <dbl> NA, 1, 1, NA, 1, 1, 1, 0, 1, 1, 1, 1, 1, …
$ fed_in_feb                   <dbl> NA, 1, 1, NA, 1, 1, 1, 0, 1, 1, 1, 1, 1, …
$ fed_in_mar                   <dbl> NA, 1, 1, NA, 1, 1, 1, 0, 1, 1, 1, 1, 1, …
$ fed_in_apr                   <dbl> NA, 1, 1, NA, 1, 1, 1, 0, 1, 1, 1, 1, 1, …
$ fed_in_may                   <dbl> NA, 1, 1, NA, NA, 0, 1, 0, 1, 1, 1, 1, 1,…
$ fed_in_jun                   <dbl> NA, 1, 0, NA, NA, 0, 0, 0, 1, 1, 1, 1, 1,…
$ fed_in_jul                   <dbl> NA, 1, 0, NA, NA, 0, 0, 0, 1, 1, 1, 1, 1,…
$ fed_in_aug                   <dbl> NA, 1, 0, NA, NA, 0, 0, 0, 1, 1, 1, 1, 1,…
$ fed_in_sep                   <dbl> NA, 1, 0, NA, NA, 0, 0, 0, 1, 1, 1, 1, 1,…
$ fed_in_oct                   <dbl> NA, 1, 1, NA, NA, 1, 0, 0, 1, 1, 1, 1, 1,…
$ fed_in_nov                   <dbl> NA, 1, 1, NA, 1, 1, 1, 0, 1, 1, 1, 1, 1, …
$ fed_in_dec                   <dbl> NA, 1, 1, NA, 1, 1, 1, 0, 1, 1, 0, 1, 1, …
$ numfeeders_suet              <dbl> 1, 1, 3, 1, 2, 1, 0, 1, 2, 1, 0, 3, 1, 2,…
$ numfeeders_ground            <dbl> 0, 1, 3, 1, 1, 0, 0, 1, 2, NA, 0, 2, 1, 2…
$ numfeeders_hanging           <dbl> 1, NA, 2, 1, NA, 1, NA, 1, NA, 1, NA, 8, …
$ numfeeders_platfrm           <dbl> 1, 1, 3, 1, 0, 1, 1, 0, 0, NA, 1, 1, 0, 0…
$ numfeeders_humming           <dbl> 0, NA, 0, 0, 0, 0, 0, 0, 0, NA, 0, 2, 0, …
$ numfeeders_water             <dbl> 0, NA, 1, 0, NA, 0, NA, 1, NA, 1, NA, 3, …
$ numfeeders_thistle           <dbl> 2, NA, 1, NA, NA, 0, NA, NA, NA, 1, NA, 2…
$ numfeeders_fruit             <dbl> 0, NA, 0, NA, 0, 0, 0, NA, 0, NA, 0, 1, 1…
$ numfeeders_hopper            <dbl> NA, NA, NA, NA, 1, NA, 0, NA, 2, NA, 0, N…
$ numfeeders_tube              <dbl> NA, 3, NA, NA, 5, NA, 0, NA, 2, NA, 3, NA…
$ numfeeders_other             <dbl> NA, NA, NA, NA, 0, NA, 0, NA, 0, NA, 0, N…
$ population_atleast           <dbl> NA, 1, NA, 100001, 1, 5001, 100001, 1, 25…
$ count_area_size_sq_m_atleast <dbl> NA, 100.01, NA, 100.01, 375.01, 1.01, 100…

site_data

Each row represents each unique observation location.

  • loc_id: Unique identifier for each survey site.

  • proj_period_id: Calendar year of end of FeederWatch season. site_data has many different project period id’s, over the years.

  • numfeeders_*: Numbers of feeder types present at each location. Feeder types are suet, ground, hanging, platform, humming, water, thistle, fruit, hopper, tube, and other feeders.

Question 1: How does the snow affect the birds’ activity or flock size?

Initial Hypothesis

  1. Snow will have negative impact on birds activity:
    • Birds would be less likely to come out if it’s snowing heavily.
    • But there may be certain bird species that actually come out more in the snow as it helps them capture more prey.
  2. However, it might actually have positive impact on flock size:
    • To increase the survival rate, the flock of birds sighted at the location with more snow will have bigger flock size.

Higher Snow Level Leads to Lower Bird Activity

  • Most of the sightings were reported from no-snow region, and the proportion tends to decrease with more snow.

  • All of the birds tend to become less active as they have more snow in their environment.

  • However, this might be caused by different reasons as well, such as less human observers in the snowy regions.

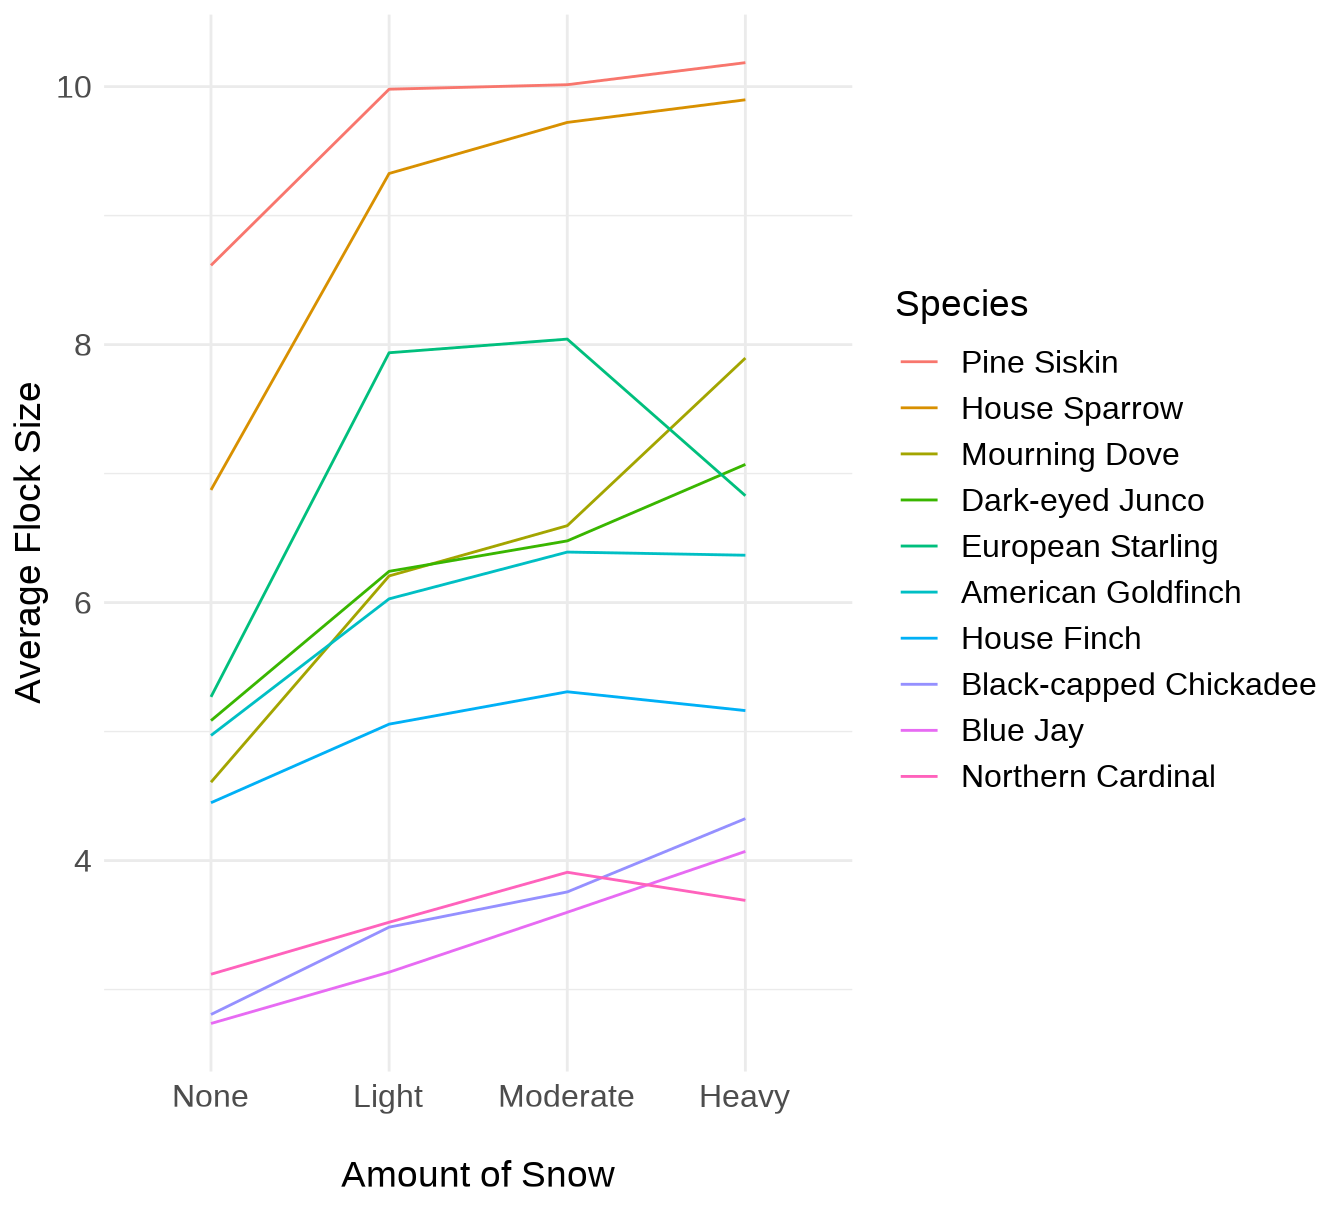
However, Average Flock Size Tends to Increase with Higher Snow Level

  • As opposed to bird activity, higher snow level had positive correlation with average flock size.

  • Such phenomenon might be a result of their effort to increase the survival rate.

Question 2: Do different feeder types attract different species of birds?

Initial Hypothesis

  1. Different feeder types would attract different species of birds:
    • Different species of birds would have various foraging habits and needs, so each type of feeder would attract different bird species.
    • Especially, certain feeder types will attract more of the species whose needs the feeder best fulfill.
  2. However, a bird species might have many feeder types that they favor:
    • Birds might require nutrition provided by multiple feeder types, depending on what’s available to them.

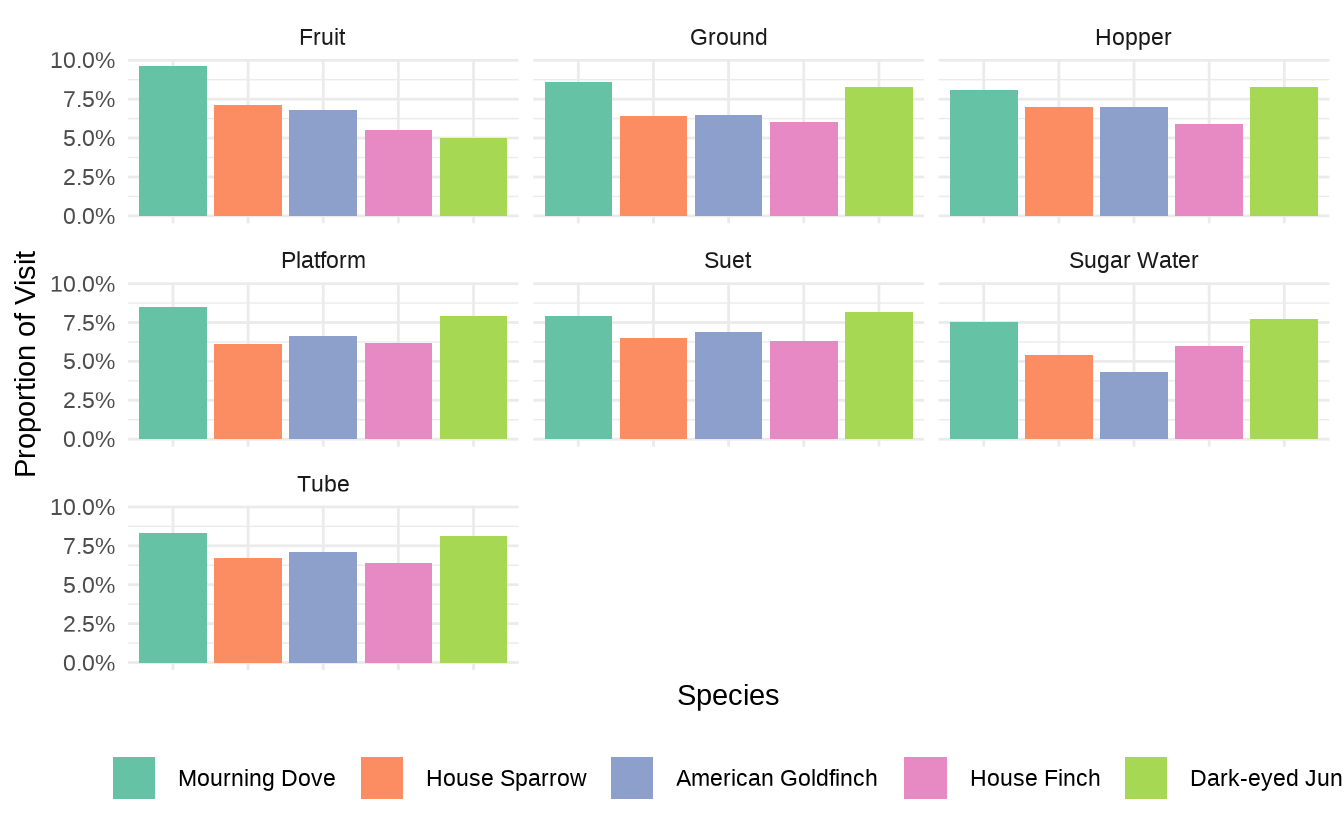
Mourning Dove Ranked as the #1 Visitor for Most of the Feeder Types

#Select relevant columns in both datasets.
feeder <- site_data |>
  select(loc_id, proj_period_id, starts_with("numfeeders"))

top_5_lists <- observation_data |>
  filter(valid == 1) |>
  left_join(select(
    species_dictionary, 
    species_code, species_name = primary_com_name
  )) |>
  group_by(species_code, species_name) |>
  summarize(total_sightings = sum(how_many), .groups = 'drop') |>
  filter(total_sightings > 20000) |>
  select(species_code, species = species_name) |>
  pull(species)

species <- observation_data |>
  #Filter out invalid observations
  filter(valid == 1) |>
  select(loc_id, proj_period_id, species_code, how_many) |>
  
  #Melt observation_data to have species codes as columns and the sum of sightings as values for each location and project period. The goal is to keep each loc_id as one row.
  pivot_wider(
    names_from = species_code,
    values_from = how_many,
    values_fn = list(how_many = sum)
  )

#Join the feeder and species data by loc_id and project period. Merging by project period id is important because many locations in site_data have outdated feeder information from previous project period. For accuracy, we only take into consideration locations that are updated in 2021 and have sightings in 2021.
species_feeder <- left_join(species, feeder, by = c("loc_id", "proj_period_id")) |>
  mutate_all(~replace(., is.na(.), 0))
  
#Create a list of feeder type column names
feeder_columns <- grep("^numfeeders_", names(species_feeder), value = TRUE)

totals_list <- list()

#Loop through each column name to filter loc_id's where the feeder type is present (num >= 1), select all species sum columns, and calculate the sum of the species counts
for (feeder_col in feeder_columns) {
  totals <- species_feeder |>
    filter( !! sym(feeder_col) >= 1) |>
    select(-c(1, 2, (ncol(species_feeder) - 10):ncol(species_feeder))) |>
    colSums()
  totals_list[[feeder_col]] <- totals
}

totals_df <- as.data.frame(totals_list) |>
  #Moved species from row names to a column.
   rownames_to_column("species_code")

#Calculate the percentages for each feeder type by dividing each species count of the feeder type by the total bird count for that feeder type
for (feeder_col in feeder_columns) {
 totals_df <- totals_df |>
 mutate(!!paste0(feeder_col, "_perc") := round(.data[[feeder_col]] / sum(.data[[feeder_col]]) * 100, 1))
 }

#Modify feeder type column names
colnames(totals_df) <- sub("^numfeeders_", "", colnames(totals_df))

#Translated species codes to their common names
totals_df <- left_join(totals_df, species_dictionary[, c("species_code", "primary_com_name")], by = "species_code")

totals_df$species_code = totals_df$primary_com_name

totals_df <- subset(totals_df, select = -primary_com_name) |>
  rename(species = species_code)

top5_perc <- totals_df |>
  select(ends_with("perc"), species) |>
  select(-other_perc)|>
  pivot_longer(cols = ends_with("perc"), names_to = "feeder_type") |>
  
  filter(species %in% top_5_lists) |>
  group_by(feeder_type) |>
  na.omit()

top5_perc |>
  mutate(
    species = fct_reorder(species, value, mean, n=1, .desc = T),
    feeder_type = case_when(
      feeder_type == "fruit_perc" ~"Fruit", feeder_type == "ground_perc" ~"Ground",
      feeder_type == "humming_perc" ~"Sugar Water", feeder_type =="hopper_perc" ~"Hopper",
      feeder_type == "platfrm_perc" ~"Platform", feeder_type == "suet_perc" ~"Suet",
      feeder_type == "tube_perc" ~"Tube"
    )
  ) |>
  ggplot(aes(x = species, y = value, fill = species)) +
  geom_bar(stat = "identity", position = "dodge") +
  facet_wrap(~ feeder_type) +
  theme_minimal() +
  scale_y_continuous(labels = scales::percent_format(scale = 1))+
   theme(axis.text.x = element_blank(),
          legend.position = "bottom",
    legend.direction = "horizontal")+
  guides(fill = guide_legend(title = NULL)) +
  labs(
    x = "Species",
    y = "Proportion of Visit"
  )+ 
  scale_fill_brewer(palette = "Set2") + 
  theme(
    legend.title = element_text(size = 16),
  )

  • The distribution of species visits remains similar across various feeder types.

  • The prevalence of these species in general can contribute to the consistency.

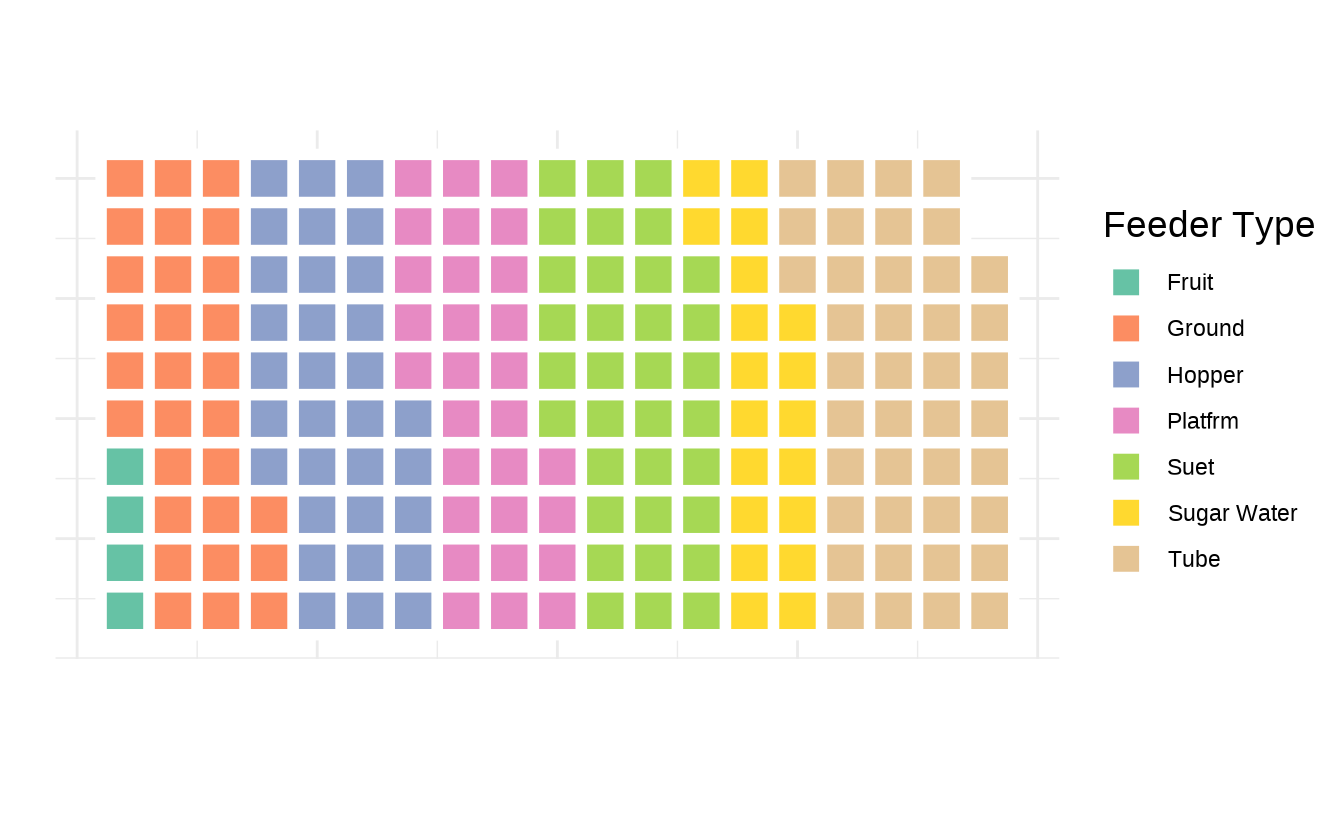
Mourning Dove Actually Has Different Magnitude of Preference for Each Feeder Type

mourning_dove <- totals_df |>
  filter(species == "Mourning Dove") |>
  select(cols = -species, -ends_with("perc")) |>
  pivot_longer(cols = everything(), names_to = "feeder_type", values_to = "count")|>
  filter(count != 0)

t <- mourning_dove |>
  pull(count)

set.seed(123)
mourning_dove |>
  mutate(
    feeder_type = case_when(
      feeder_type == "fruit" ~"Fruit", feeder_type == "ground" ~"Ground",
      feeder_type == "humming" ~"Sugar Water", feeder_type == "hopper" ~"Hopper",
      feeder_type == "platfrm" ~"Platfrm", feeder_type == "suet" ~"Suet",
      feeder_type == "tube" ~"Tube"
    )
  ) |>
  slice(rep(1:n(), times = t)) |>
  slice_sample(n = 200) |>
  waffle_iron(mapping = aes_d(group = feeder_type), rows = 10) |>
  ggplot(mapping = aes(x = x, y = y, fill = group)) +
  geom_waffle() +
  coord_equal() +
  labs(
    x = "",
    y = "",
    fill = "Feeder Type"
  ) +
  theme_minimal() +
  theme(
    axis.text = element_blank(),
    legend.title = element_text(size = 14)
  ) +
  scale_fill_discrete() + 
  scale_fill_brewer(palette = "Set2") 

  • Despite being #1 position for most of the feeder types, Mourning Dove has high variance in its visit to different feeder types.

  • The variability can be attributed to disparities in the utilization of various feeder types across locations.

Thank You!