Introduction
The principal objective of our project is to comprehensively analyze and forecast student performances within high schools. Our aim is to investigate the intricate interconnections between students’ academic grades, their inclination toward pursuing higher education, and various pertinent variables present within the dataset. Additionally, our project seeks to develop predictive models leveraging machine learning techniques to anticipate students’ grades based on the variables within the dataset. Ultimately, our overarching ambition is to extract valuable estimations and profound insights from the dataset, illuminating the factors influencing student performance and facilitating a deeper understanding of educational outcomes.
Main Conclusion
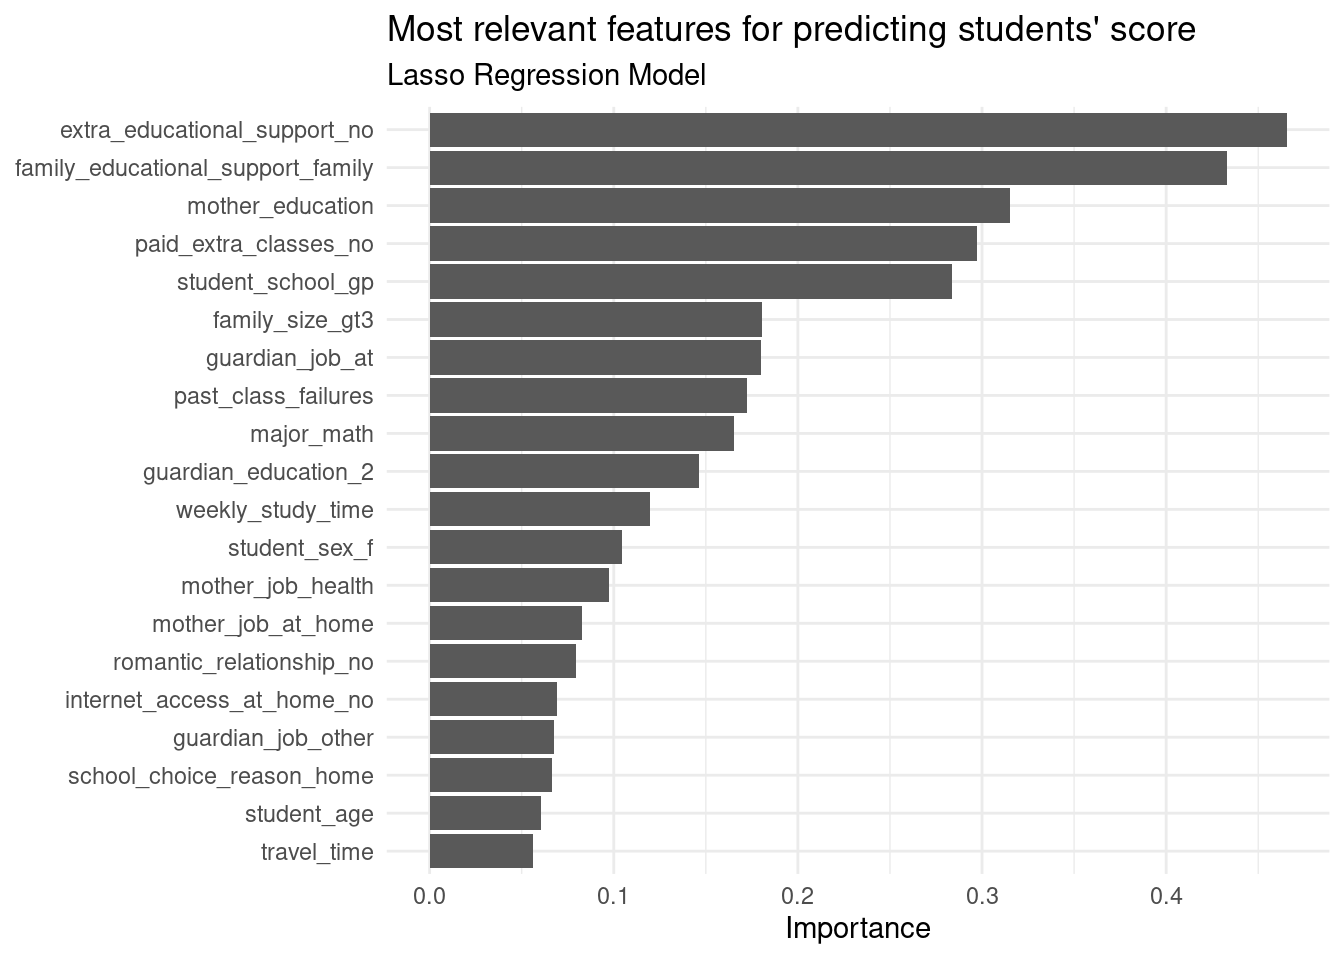
After constructing models including a null model, random forest, support vector machine, and lasso regression to predict student scores, the root mean square error respectively are 3.09, 1.99, 2.07, and 1.43. Base on these findings, we choose our lasso regression model to make our score predict function. From this model, we identified strong predictors for predicting students’ grades. The top five most important features are no extra educational support, have family educational support, mother education, do not pay for extra classes, and have past class failures. These are the essential predictors for our lasso model to make predictions on students’ grades.
Justification of approach
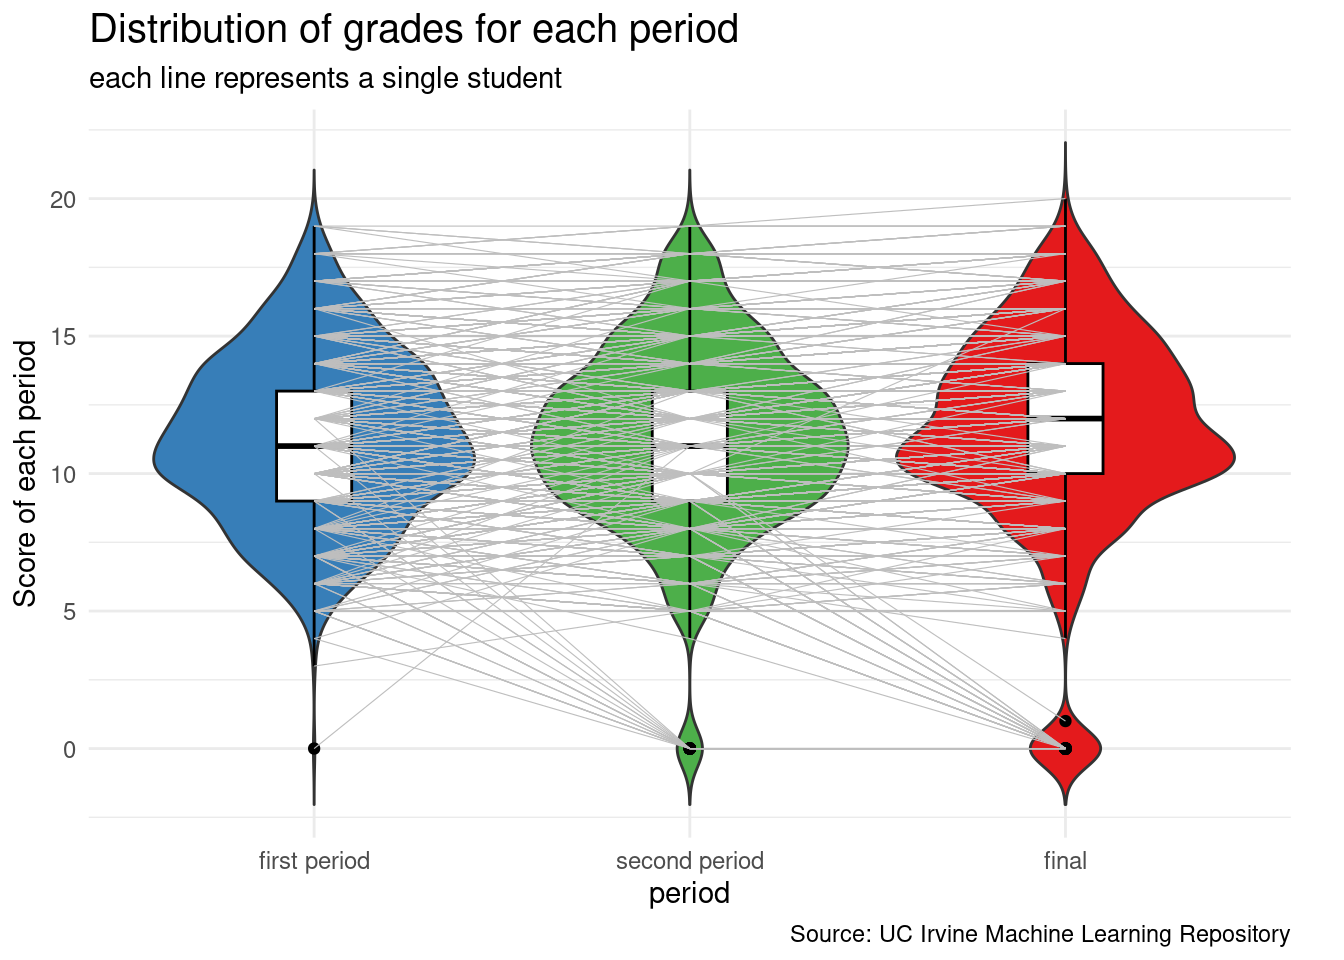
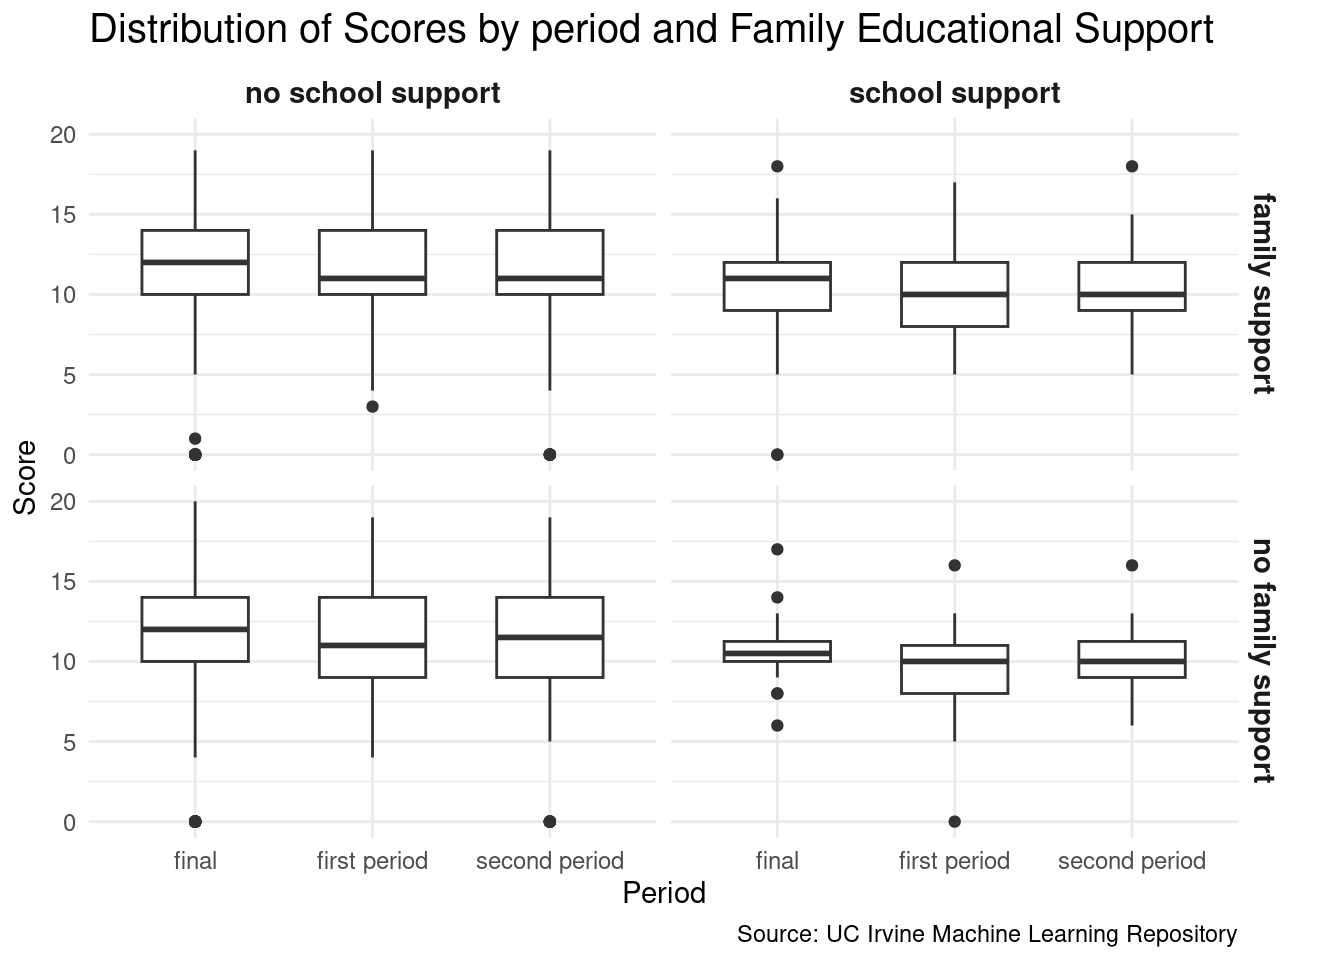
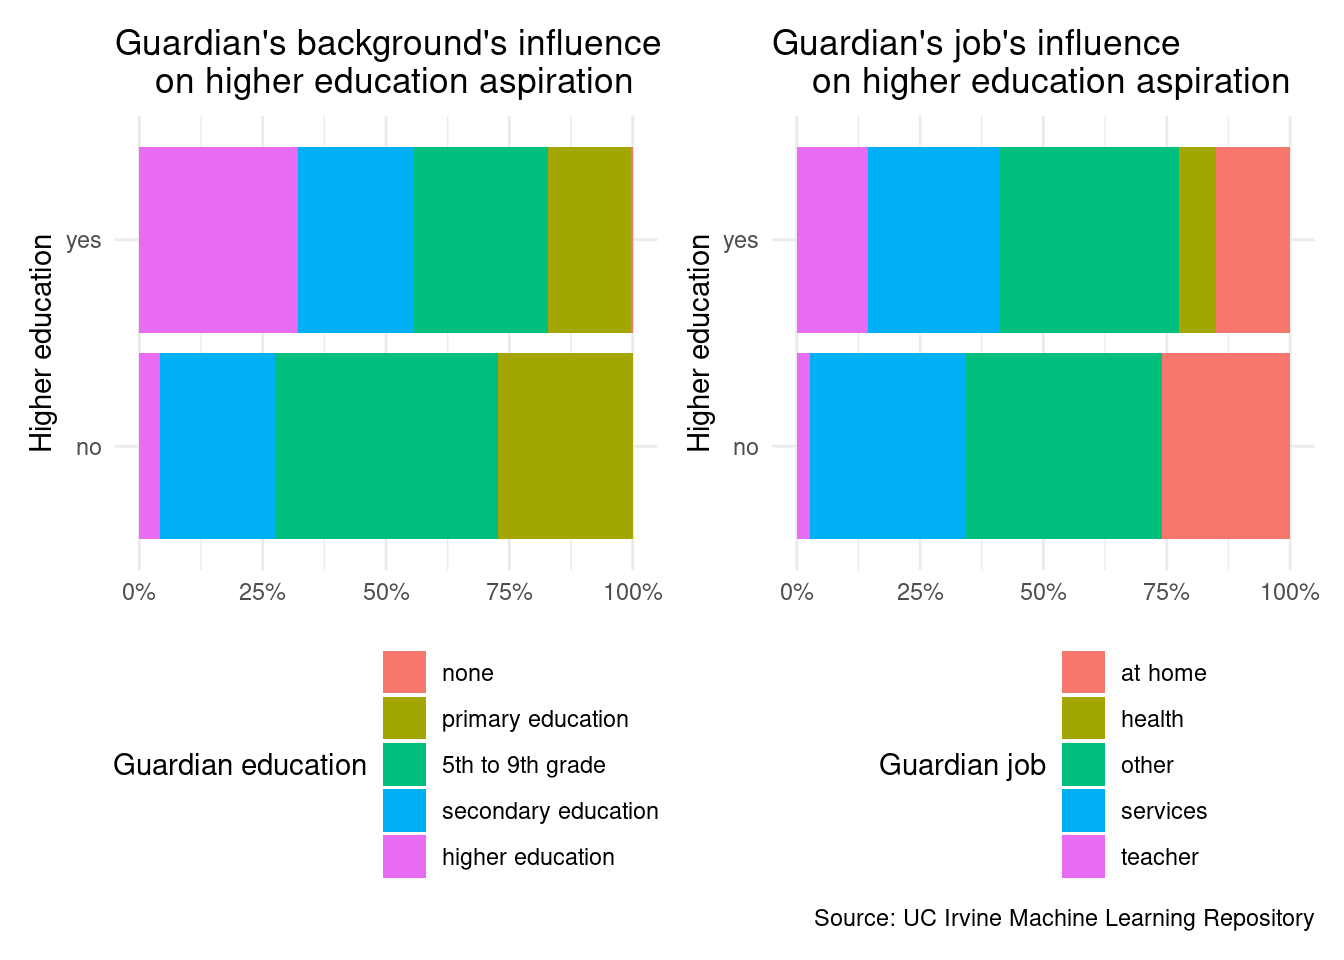
The first section delves into an exploration of factors that potentially impact the final grade and the willingness toward higher education. In this phase, various elements contributing to these two factors are analyzed using ggplot to create informative plots.
Moving to the second part, our research utilizes null, linear regression, random forest regression, and lasso models to predict the final grade based on the identified factors. This predictive modeling aims to provide insights into forecasting student performance.
As for the intended audience, we believe the students and parents can all be benifitted from our research. Students and parents always want to know how their academic performace would be before a class start. Based on our project, they can input their information into our lasso model, and the model would predict their future grade. By understanding the factors affecting grades, parents can support their children better academically, while students may gain insights into areas of focus for improving their academic performance.
Data description
This project utilizes datasets obtained from the UC Irvine machine learning repository, containing information about student achievements in secondary education from two Portuguese schools, covering the subjects of Math and Portuguese.
For data cleaning, we merge the data set of Math students and the data set of Portuguese students, arrange the data by descending order of their final grades, and rename all the variables to names with clearer description under snake case format. More information in appendix.
What are the observations (rows) and the attributes (columns)?
The observations (rows) are instances or individual entries in the student dataset, representing specific cases or data points. The attributes (columns) refer to the various characteristics, features, or variables associated with the students. These columns encompass diverse information such as grades, travel time, and other student-related details. Each column holds specific information about the students being observed in the dataset.
Why was this dataset created?
This Student Performance dataset was created by Paulo Cortez for studying student achievement in two Portuguese secondary schools. This data collection aimed to examine student grades, demographics, social factors, and school-related features. This attribute selection aligns with research goals.
We use skimr::skim() function to generate summary statistics and an overview of the dataset. The basic characteristics of the dataset, including the number of missing values, mean, standard deviation, swiftly grasp the structure, distribution, and potential issues within the data, providing a foundation for further data exploration and analysis.
Who funded the creation of the dataset?
UC Irvine University.
Data source: https://archive.ics.uci.edu/dataset/320/student+performance
What processes might have influenced what data was observed and recorded and what was not?
The data observed and recorded in this dataset were influenced by several factors:
Research Objectives: The data collection aligned with the research goal of studying student achievement in secondary education, leading to the inclusion of relevant data like student grades, demographics, social factors, and school-related features.
Educational Context: The dataset’s focus on two Portuguese schools considered the unique characteristics of these schools, potentially including region-specific factors relevant to the research.
Data Collection Methods: Data was gathered through school reports and questionnaires, impacting the type of data collected. Questionnaires may have limited the data to survey-appropriate information.
Academic Subjects: The dataset is divided into separate datasets for Mathematics (“mat”) and Portuguese language (“por”), reflecting the emphasis on these subjects and affecting the choice of recorded data.
What preprocessing was done, and how did the data come to be in the form that you are using?
The data observed and recorded in this dataset were influenced by several factors:
Research Objectives: The data collection aligned with the research goal of studying student achievement in secondary education, leading to the inclusion of relevant data like student grades, demographics, social factors, and school-related features.
Educational Context: The dataset’s focus on two Portuguese schools considered the unique characteristics of these schools, potentially including region-specific factors relevant to the research.
Data Collection Methods: Data was gathered through school reports and questionnaires, impacting the type of data collected. Questionnaires may have limited the data to survey-appropriate information.
Academic Subjects: The dataset is divided into separate datasets for Mathematics (“mat”) and Portuguese language (“por”), reflecting the emphasis on these subjects and affecting the choice of recorded data.
If people are involved, were they aware of the data collection and if so, what purpose did they expect the data to be used for?
Those involved in data collection, including researchers, teachers, and administrators, were likely aware of the study’s objectives. The data was used for classification and regression tasks related to predicting student performance in Math and Portuguese. Researchers likely intended to gain insights into factors affecting achievement and test machine learning models for educational research.
Data summary
| Name |
student_data |
| Number of rows |
2913 |
| Number of columns |
36 |
| _______________________ |
|
| Column type frequency: |
|
| character |
21 |
| numeric |
15 |
| ________________________ |
|
| Group variables |
None |
Variable type: character
| student_school |
0 |
1 |
2 |
2 |
0 |
2 |
0 |
| student_sex |
0 |
1 |
1 |
1 |
0 |
2 |
0 |
| home_address_type |
0 |
1 |
1 |
1 |
0 |
2 |
0 |
| family_size |
0 |
1 |
3 |
3 |
0 |
2 |
0 |
| parent_cohabitation_status |
0 |
1 |
1 |
1 |
0 |
2 |
0 |
| mother_job |
0 |
1 |
5 |
8 |
0 |
5 |
0 |
| father_job |
0 |
1 |
5 |
8 |
0 |
5 |
0 |
| school_choice_reason |
0 |
1 |
4 |
10 |
0 |
4 |
0 |
| student_guardian |
0 |
1 |
6 |
6 |
0 |
2 |
0 |
| extra_educational_support |
0 |
1 |
14 |
17 |
0 |
2 |
0 |
| family_educational_support |
0 |
1 |
14 |
17 |
0 |
2 |
0 |
| paid_extra_classes |
0 |
1 |
2 |
3 |
0 |
2 |
0 |
| extra_curricular_activities |
0 |
1 |
2 |
3 |
0 |
2 |
0 |
| attended_nursery_school |
0 |
1 |
2 |
3 |
0 |
2 |
0 |
| higher_education_aspiration |
0 |
1 |
2 |
3 |
0 |
2 |
0 |
| internet_access_at_home |
0 |
1 |
2 |
3 |
0 |
2 |
0 |
| romantic_relationship |
0 |
1 |
2 |
3 |
0 |
2 |
0 |
| major |
0 |
1 |
4 |
10 |
0 |
2 |
0 |
| period |
0 |
1 |
5 |
13 |
0 |
3 |
0 |
| guardian_education |
0 |
1 |
6 |
21 |
0 |
5 |
0 |
| guardian_job |
0 |
1 |
5 |
8 |
0 |
5 |
0 |
Variable type: numeric
| student_age |
0 |
1 |
16.60 |
1.13 |
15 |
16 |
17 |
17 |
22 |
▇▅▃▁▁ |
| mother_education |
0 |
1 |
2.64 |
1.12 |
0 |
2 |
3 |
4 |
4 |
▁▅▇▆▇ |
| father_education |
0 |
1 |
2.41 |
1.10 |
0 |
2 |
2 |
3 |
4 |
▁▆▇▆▆ |
| travel_time |
0 |
1 |
1.51 |
0.73 |
1 |
1 |
1 |
2 |
4 |
▇▃▁▁▁ |
| weekly_study_time |
0 |
1 |
1.97 |
0.83 |
1 |
1 |
2 |
2 |
4 |
▅▇▁▂▁ |
| past_class_failures |
0 |
1 |
0.22 |
0.60 |
0 |
0 |
0 |
0 |
3 |
▇▁▁▁▁ |
| family_relationship_quality |
0 |
1 |
3.94 |
0.93 |
1 |
4 |
4 |
5 |
5 |
▁▁▃▇▅ |
| free_time_after_school |
0 |
1 |
3.19 |
1.03 |
1 |
3 |
3 |
4 |
5 |
▁▃▇▆▂ |
| going_out_with_friends |
0 |
1 |
3.15 |
1.16 |
1 |
2 |
3 |
4 |
5 |
▂▆▇▅▅ |
| workday_alcohol_consumption |
0 |
1 |
1.47 |
0.89 |
1 |
1 |
1 |
2 |
5 |
▇▂▁▁▁ |
| weekend_alcohol_consumption |
0 |
1 |
2.29 |
1.29 |
1 |
1 |
2 |
3 |
5 |
▇▅▃▃▂ |
| current_health_status |
0 |
1 |
3.55 |
1.43 |
1 |
3 |
4 |
5 |
5 |
▃▂▅▃▇ |
| school_absences |
0 |
1 |
4.18 |
5.95 |
0 |
0 |
2 |
6 |
75 |
▇▁▁▁▁ |
| id |
0 |
1 |
513.64 |
302.14 |
1 |
251 |
510 |
773 |
1044 |
▇▇▇▇▇ |
| score |
0 |
1 |
11.35 |
3.40 |
0 |
9 |
11 |
14 |
20 |
▁▂▇▅▁ |
Design process
Firstly we planned to use visualizations to different variables versus grade or willingness for higher education. However due to data limitation, there are not a lot of continuous data for visualization, and our guess on which variable is effective goes wrong from time to time. So after learning about machine learning, we think that is a good topic to include in our study, to see estimation possibilities without getting to know and making assumptions on the data.
Exploration for Grades Estimation
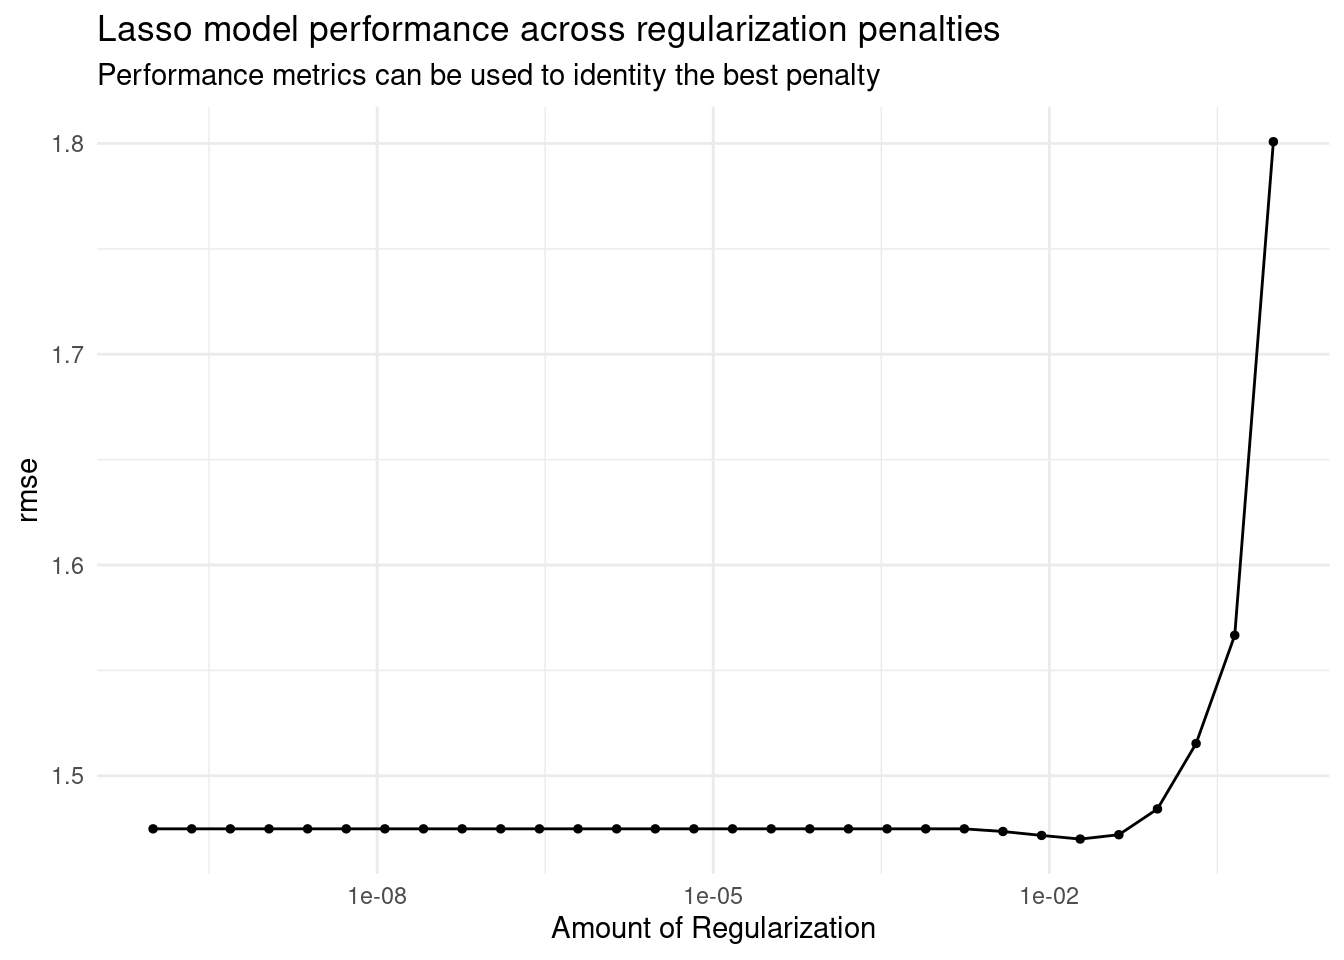
Since the variables related to grades are not the same as what we estimate, and this may happen from time to time, so we should also prepare a way where we don’t have to decide which variables by ourselves. And this is why we turn to machine learning. We tried Penalized logistic regression model, Random Forest Model, and Support Vector Machine and see which one produces lower root mean square error in this dataset. After constructing our feature engineering and hyper-parameter tuning, we concluded that our lasso model has the best performance in predicting students’ grades.
After constructing models including a null model, random forest, support vector machine, and lasso regression to predict student scores, the root mean square error respectively are 3.09, 1.99, 2.07, and 1.43. Base on these findings, we choose our lasso regression model to make our score predict function. More in the appendix.
Lasso Model
# A tibble: 5 × 7
       penalty .metric .estimator  mean     n std_err .config
         <dbl> <chr>   <chr>      <dbl> <int>   <dbl> <chr>
1 0.0189       rmse    standard    1.47    10  0.0522 Preprocessor1_Model25
2 0.00853      rmse    standard    1.47    10  0.0520 Preprocessor1_Model24
3 0.0418       rmse    standard    1.47    10  0.0529 Preprocessor1_Model26
4 0.00386      rmse    standard    1.47    10  0.0515 Preprocessor1_Model23
5 0.0000000001 rmse    standard    1.47    10  0.0513 Preprocessor1_Model01
As shown in this bar chart, we can see that there are multiple features with strong impact on the model prediction. The top 1 influential feature is a student without extra educational support. From our understanding, the academic support from a single class is very limit. Extra support like additional office hour to answer students’ questions, mental counselors to maintain students’ mental health, and parents to provide guidance for students’ academic and life path are important. Students who are not able to access those additional resource can have a very difficult study experience. We also noticed that the least influential feature is there is no internet at home. We think it’s because the internet is very prevalent now that students can access to it from many locations, like schools, cafes, and libraries. The home without internet access can barely limit students’ academic performance.
Limitations
First limitation is about data count. Although we combined the two datasets, there are only 1000 data points to train and test. It is enough to be a dryrun but more data is needed for machine learning to train a more accurate model.
Second limitation is about subjects. This dataset includes only two subjects, and we have joined the dataset so there is not a lot of research about it. In the real world situation, the number of subject is much larger, and may have a larger effect than other variables to grades. So our model selected may not be the best way to train and estimate the grades for a larger scale of classes.
Lastly, there are not a lot of continuous variables in our dataset. As a result, we can hardly make visualizations using scatter plots for seeing the relationship between grades and other variables. If more continuous variables are given, we can definitely see some related variables just by graphing.
Acknowledgments
Great thanks to UC Irvine machine learning repository for the dataset as it is well documented and easy to use.
Great thanks to TAs and Instructor for the help and consultations along the way.