Lab 2
Objective:
The purpose of this lab was to add analog circuits to our robot. This included a microphone circuit, which is able to distinguish a 950 Hz tone using filters, FFT analysis, and amplifier circuits.
Materials:
- 1 Arduino Uno
- 1 USB A/B cable
- Electret Microphone
- 1 μF and 100 nF capacitors
- 3.3 kΩ, 330 kΩ, 10 kΩ, and 150 kΩ resistors
- LM358 Op Amp
Basic Microphone Circuit and Intial FFT Analysis:
We started the lab off by assembling the basic circuit for the electret microphone as displayed in Figure 1 below. We used a capacitor value of 1 μF and a resistor value of 3.3 kΩ to set up the circuit.

Figure 1: Electret Microphone Circuit
To recognize the starting tone, we must perform a Fourier transform on the audio input signal. A Fourier transform converts a signal from the time domain to the frequency domain by essentially “averaging” the signal at each of the frequency components to find its prevalence in the original signal. The result is that rather than viewing the signal as a sum of all the frequency components in a single waveform over time, we can decompose the signal into the component frequencies and visualize the relative intensities of each frequency on a histogram-like plot.
A continuous-time signal, however, cannot directly be recognized by a digital device. We have to sample the signal at fixed time intervals to assemble a “skeleton” of the original signal. In order to unambiguously decipher the original signal from the sampled data, the sampling frequency must be at least the Nyquist rate, which is twice the frequency of the original periodic signal. In the case of the lab, we use the Fast Fourier Transform (FFT) to transform the audio signal. The FFT is an algorithm that performs a discrete Fourier transform (DFT) on data sampled from a continuous-time signal. We use the Arduino’s built in ADC to sample the audio signal, which can collect data at a rate of 125,000 Hz, more than enough for the FFT algorithm to recognize a 950 Hz signal.
To perform a FFT analysis of the inital signal, we started with the sample sketch called fft_adc_serial provided with the Open Music Lab FFT library that repeatedly collects data from an analog input, performs an FFT of the data, then outputs the transformed data to the serial monitor. The sample sketch represented the frequency range using 256 bins. We looked up the sampling rate of the Arduino's internal ADC and saw that it was set to 16 MHz. We also saw that the fft_adc_serial has the following line of code: "ADCSRA = 0xe5;". 0xe5 is 11100101 in binary which corresponds to a prescalar value of 32 as shown in the datasheet snippet below.
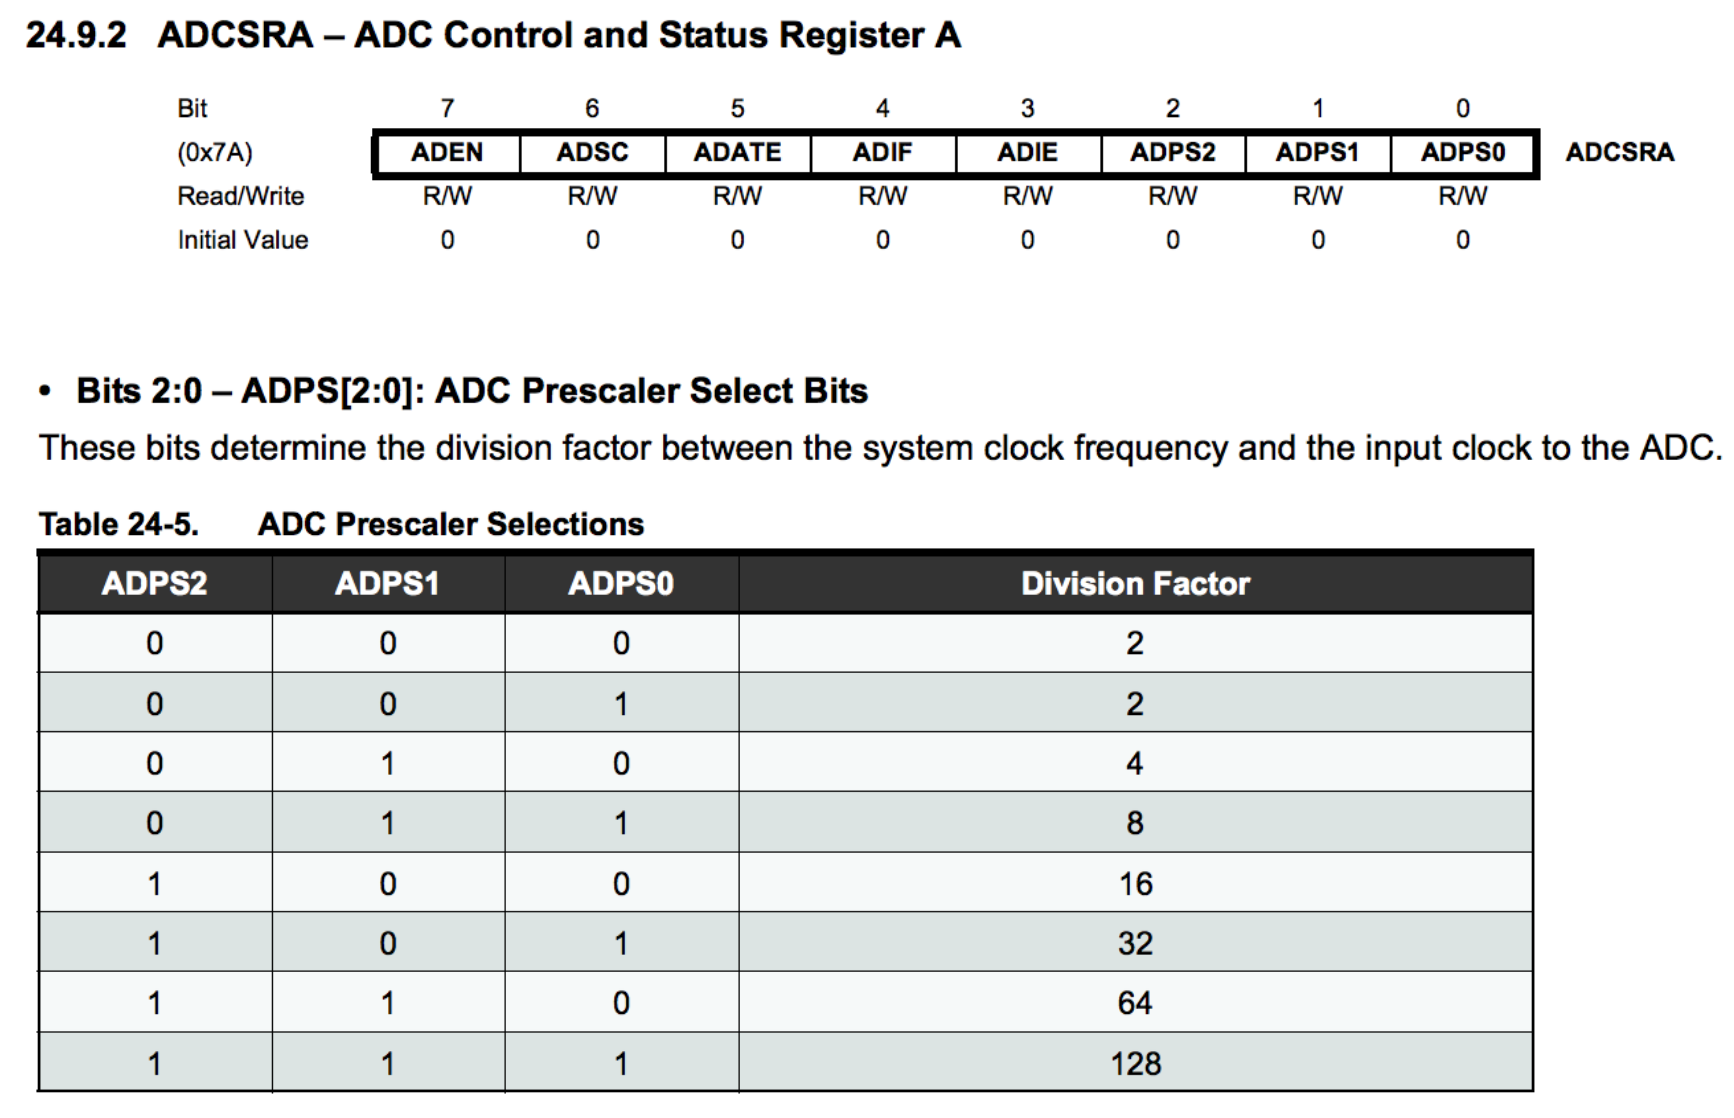
From the datasheet, we also learned that a single conversion takes 13 ADC clock cycles. As a result, the width of each bin is (16 MHz / 32 prescalar / 13 clock cycles / 256 bins) approximately 150 Hz. This means that a 950 Hz tone should fall into bin 7. When we collected the data from the serial monitor while playing a 950 Hz tone into the microphone, we saw a peak around bin 7 as shown in Figure 2 below.
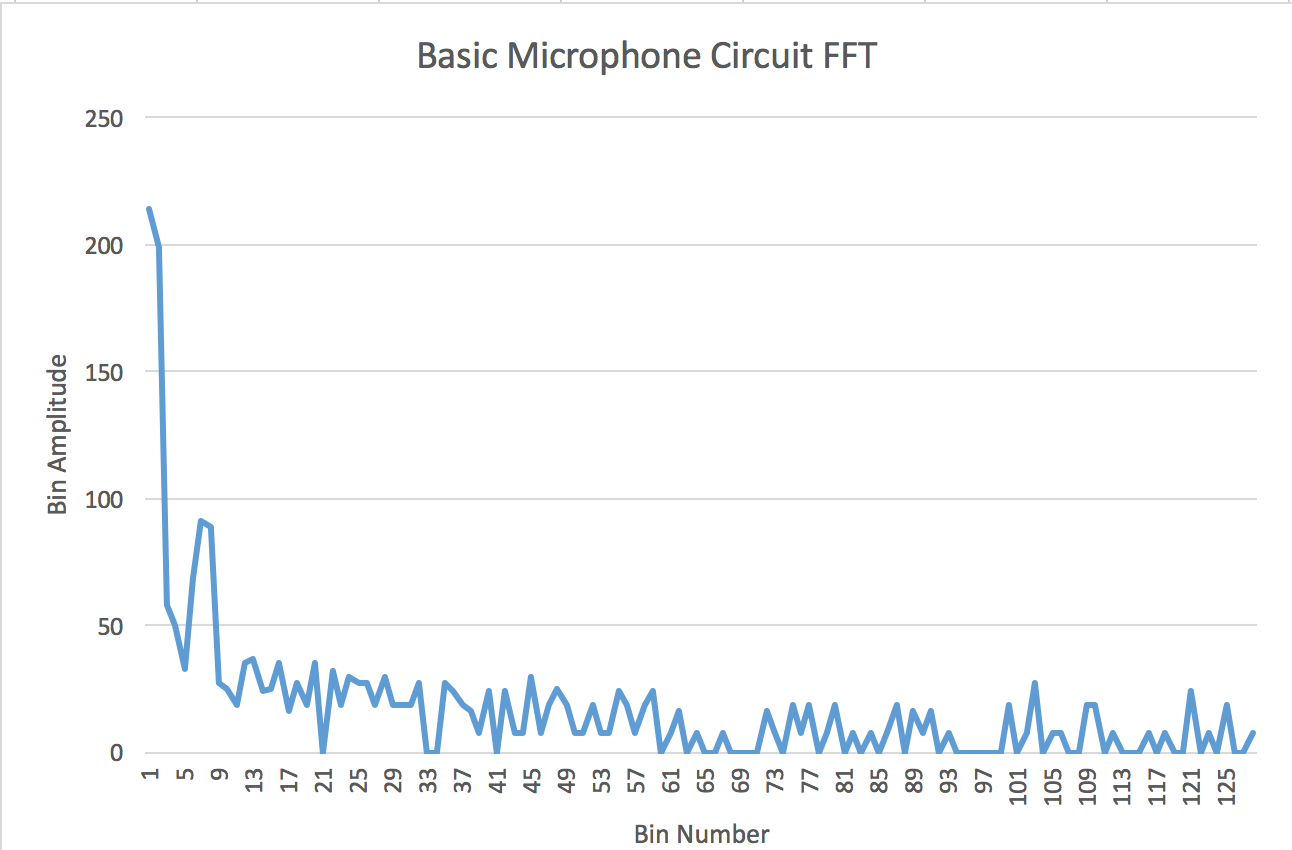
Figure 2: Elecret Microphone FFT
The sampling rate of the free-running ADC on the Arduino is actually quite high and technically to detect a 950 Hz signal we do not need to be sampling at 16MHz. We could have also used analogRead to detect the 950 Hz signal while using a lower sampling rate to help save energy and free up the Arduino free-running ADC for other uses. At the moment we didn't need to use the free-running ADC for any other task so we decided to use it for the tone detection. However, in the future we are considering updating the code to use analogRead in order to save energy.
Amplifier and Filter Circuit:
After building the microphone circuit, we realized that when we played a 950 Hz tone farther away from the microphone and displayed the FFT on the oscilloscope, the peak frequency was hardly noticeable amongst the noise. One way we were able to create a distinct peak was by creating an amplifier circuit on the output of the microphone circuit. For this circuit, we used the LM358 op-amp because it didn’t require a negative supply voltage. After several failed attempts at creating an amplifier circuit, we decided to use Team Alpha’s circuit shown below. The circuit topology is an inverting op-amp with R4 and R5 influencing the gain. Using a 330KΩ for R5 and a 3.3KΩ resistor for R4, our expected gain was 100. We included the R1 and R2 resistors to bias the op-amp, preventing any clipping that was occuring in the output of the op-amp. By choosing a 10KΩ resistor value for R1 anf R2, we were effectively biasing the op-amp to 2.5 volts, the halfway point between the ground and 5V rails of the amplifier. The op-amp topology can be seen in Figure 4 below.
To test the op-amp part of our circuit, we used the function generator to generate a sine wave with a 10mV peak to peak voltage with a frequency of 950 Hz. We were able to see a distinct peak at 950 Hz shown in Figure 3 below with a gain of 100. The harmonics are handled by the filtering discussed in the next paragraph.
Figure 3: Oscilloscope Output of Amplifier
A filtering circuit was also necessary for a couple reasons. First, while the FFT analysis provided by the Arduino library could identify the 950 Hz tone as the largest frequency peak, it still displayed significant peaks at other frequencies, especially the harmonics. Second, extraneous noises like human speech often contain multiple frequencies and can affect the microphone output, especially before amplification of the microphone’s electrical signal.
To reduce the influence of these extra frequencies, we decided to implement a passive low-pass RC filter based on the observation that the 950 Hz signal was one of the leftmost (lowest frequency) bins. We set the cutoff frequency at around 1060 Hz to make sure that the stop band does not interfere with the 950 Hz bin yet will filter out most of the harmonics.
To calculate the values needed for the resistor and capacitor, we used the formula w = 1/RC and converted to units of Hertz. We used a 150-ohm resistor and a 1 μF capacitor to achieve the cutoff frequency desired. The low-pass filter can be seen towards the left-hand side of Figure 4. Hooking up a sinusoidal signal from the function generator, we verified using an oscilloscope that the circuit indeed suppresses the higher-frequency peaks.
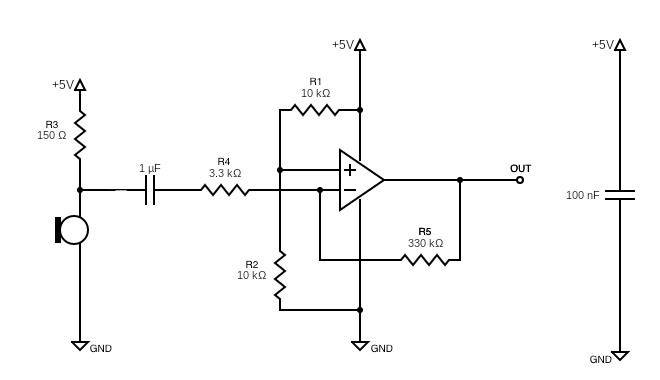
Figure 4: Amplifier + Filter Topology
Upon testing the filter+amplifier with the 950 Hz tone, the FFT output was able to show a distinguishable peak. Figure 5 below shows the FFT on the 950 Hz tone when it was played from more than a foot away from the microphone. The results show that even from a farther distance our design shows a plot similar to the FFT for the basic microphone circuit when the signal was played close to the microphone.
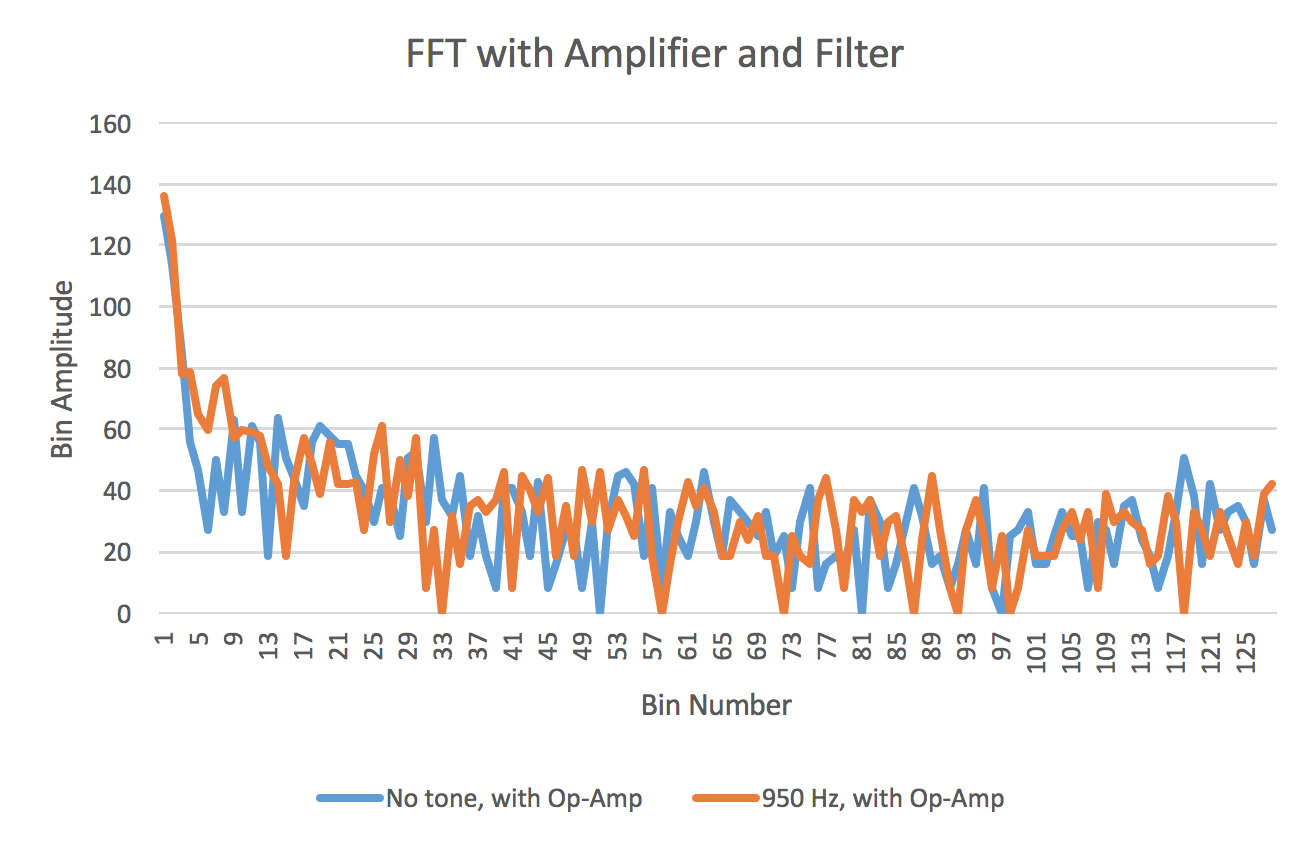
Figure 5: Amplifier + Filter FFT
Digital Filtering:
Since we were able to figure out which bin the 950 Hz signal lied in and we knew the approximate height that the bin needed to be in order to been distinguished from noise, we added further digital filtering. The fft_adc_serial code stores the magnitude of each bin in the fft_log_out array. Since the index of the array starts at 0, bin 7 corresponds to array entry 6. We noticed this bin maintains values around 50 when the 950Hz tone is not being played and values around 80 when the tone is played from really far away. Assuming that the tone would be played reasonably close to the robot, we decided on a threshold value of 90 for bin 6 in the code. We modified the sample code, replacing the for loop outputting bin values to the serial monitor with a conditional that turns on an LED if the bin exceeds a threshold value. These changes can be seen in Code Snippet 1 below.
/*
lab2.ino

Adapted from example sketch provided with fft library
from openmusiclabs.com

it takes in data on ADC0 (Analog0) and lights an LED
connected to GPIO 13 while a 950Hz frequency is playing.
*/

#define LOG_OUT 1 // use the log output function
#define FFT_N 256 // set to 256 point fft

#include <Servo.h> // include the library

void setup() {
  pinMode(13, OUTPUT);
  TIMSK0 = 0; // turn off timer0 for lower jitter
  ADCSRA = 0xe5; // set the adc to free running mode
  ADMUX = 0x40; // use adc0
  DIDR0 = 0x01; // turn off the digital input for adc0
}

void loop() {
  while(1) { // reduces jitter
    // Provided Code
    cli();  // UDRE interrupt slows this way down on arduino1.0
    for (int i = 0 ; i < 512 ; i += 2) { // save 256 samples
      while(!(ADCSRA & 0x10)); // wait for adc to be ready
      ADCSRA = 0xf5; // restart adc
      byte m = ADCL; // fetch adc data
      byte j = ADCH;
      int k = (j << 8) | m; // form into an int
      k -= 0x0200; // form into a signed int
      k <<= 6; // form into a 16b signed int
      fft_input[i] = k; // put real data into even bins
      fft_input[i+1] = 0; // set odd bins to 0
    }
    fft_window(); // window the data for better frequency response
    fft_reorder(); // reorder the data before doing the fft
    fft_run(); // process the data in the fft
    fft_mag_log(); // take the output of the fft
    sei();

    // Original Code
    // Lights up LED if bin 6 (950Hz) has a value above 90.
    if(fft_log_out[6] > 90) {
      digitalWrite(13, HIGH);
    }
    else {
      digitalWrite(13, LOW);
    }
  }
}
Code Snippet 1: LED Recognizing 950 Hz Signal
This results in the Arduino signaling with the LED whenever the 950Hz tone is being played and turning it off whenever the tone is not being played. The three videos below show the LED recognizing the 950 Hz and the LED correctly not recognizing higher and lower frequencies.
Video 1: 950 Hz Tone Recognition
Video 2: Low Frequency Tone Blocking
Video 3: High Frequency Tone Blocking
Additional Circuit (Schmitt Trigger):
For our supplemental circuit, we opted to implement an Analog-to-Digital Converter, namely a Schmitt trigger. We chose to make an ADC so that we may conserve analog pins on the arduino, since it has so few analog pins and our sensors provide analog readings by default. Our circuit is meant to serve the purpose of the conditional statements in our line following program that determine “if _lineSensorReading {logical operator} _thresholdValue”.
Our circuit works as a comparator using an op amp. The topology for the circuit can be seen below in Figure 6. We tie the inverting input to a constant voltage of our choosing (in the video, we chose 2.5, the midpoint of the range of possible outputs delivered by the line sensor), and the non inverting input to the output of a sensor (a line sensor in this case). If the voltage of the non inverting input is higher than that of the inverting input, the Op Amp’s output is the same value as its Vcc+. If the opposite is true, it outputs Vcc-. In this case, Vcc+ is 5V and Vcc- is ground.
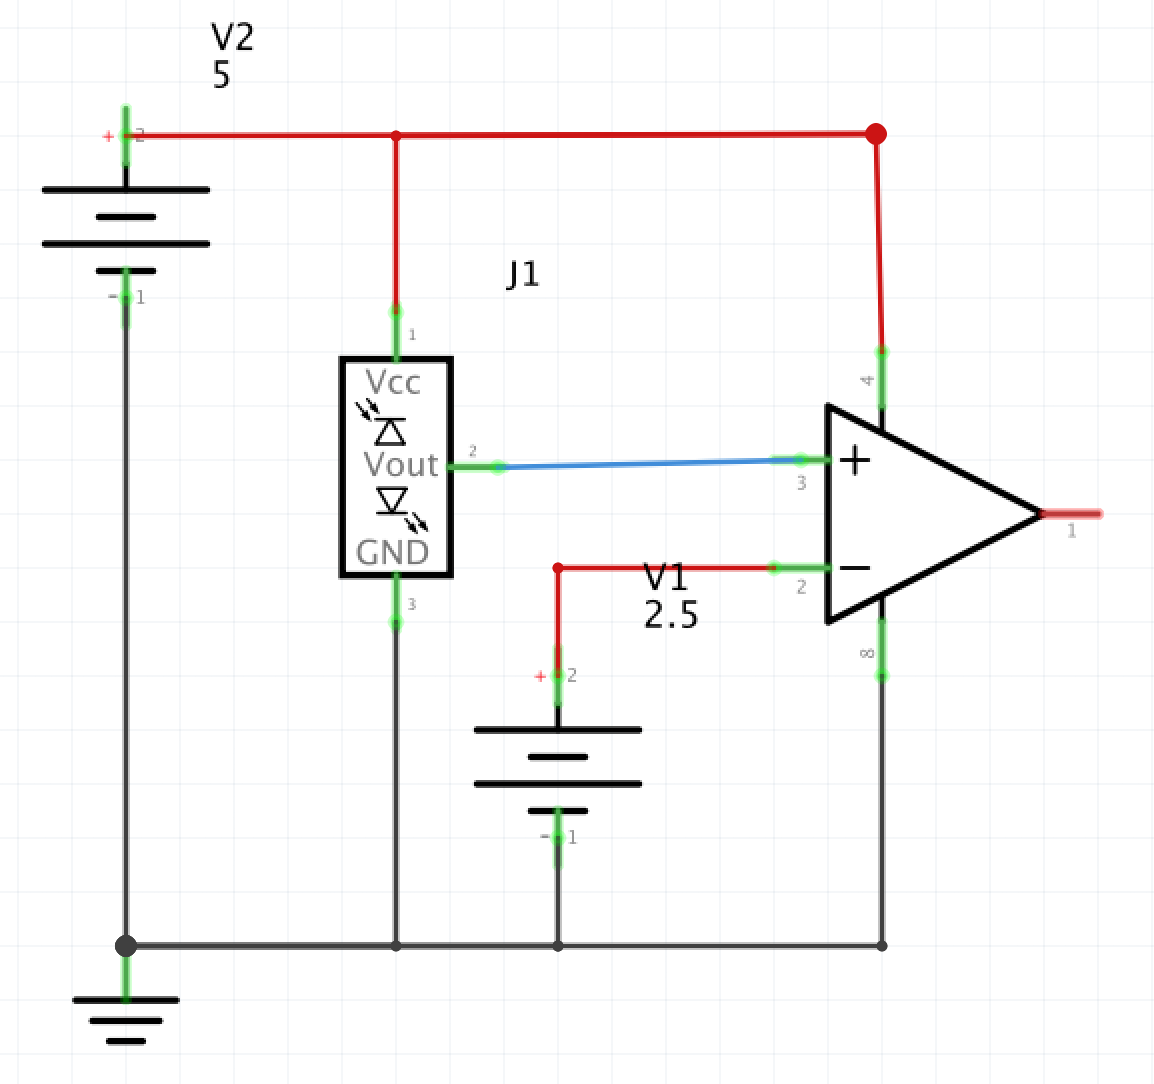
Figure 6: Schmitt Trigger Topology
This circuit is easy to modify to fit our needs in terms of moving the line sensors from analog pins to digital pins. For the purpose of our video demonstration (Video 4 and 5), we tied the inverting input to 2.5V using the DC power supply. However, we could choose almost threshold value between 0 and 5V by putting a simple voltage divider between the Arduino’s 5V power supply and the inverting input of the op amp.
Video 3: Schmitt Trigger Demo 1
Video 4: Schmitt Trigger Demo 2