Lab 3 Sensors
In this lab, we equipped the robot with sensors and drew trustworthy useable readings which will later be used to drive the robot. As a part of the prelab and in-class activities, I read through the data sheets of the sensors to decide the electrical connections to be made.
Electrical Connections
The Inertial Measurement Unit and the Time Of Flight sensors communicate using I2C protocol; The QWIIC connector from the Artemis board is used to access the SDA and SCL lines (for I2C) and power the sensors with 3.3V and GND. Considering the placement of the sensors in the robot (IMU lies flat close to Artemis, TOF sensor in front and left side), the following electrical connection was used.
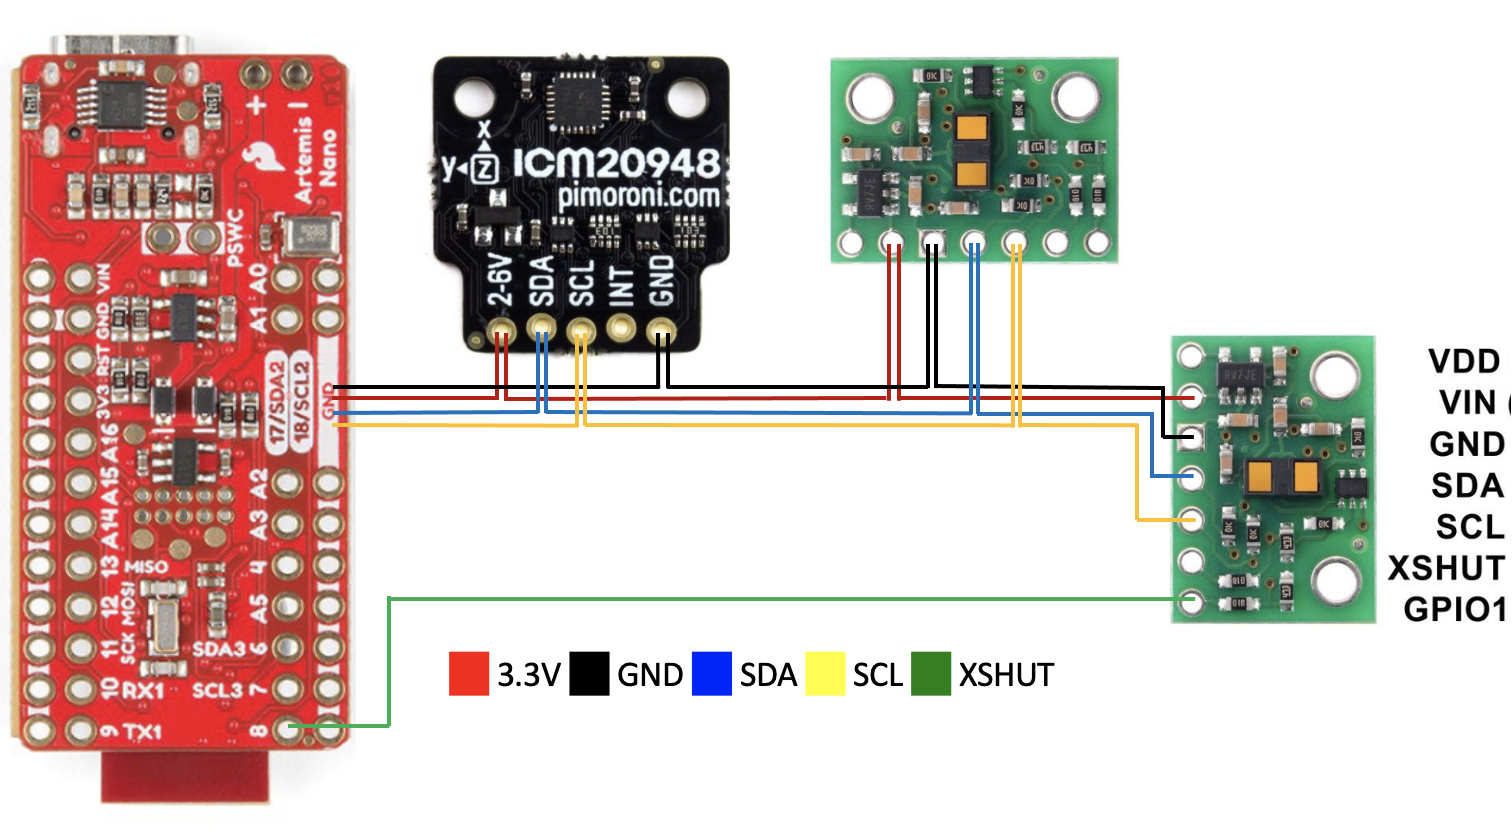
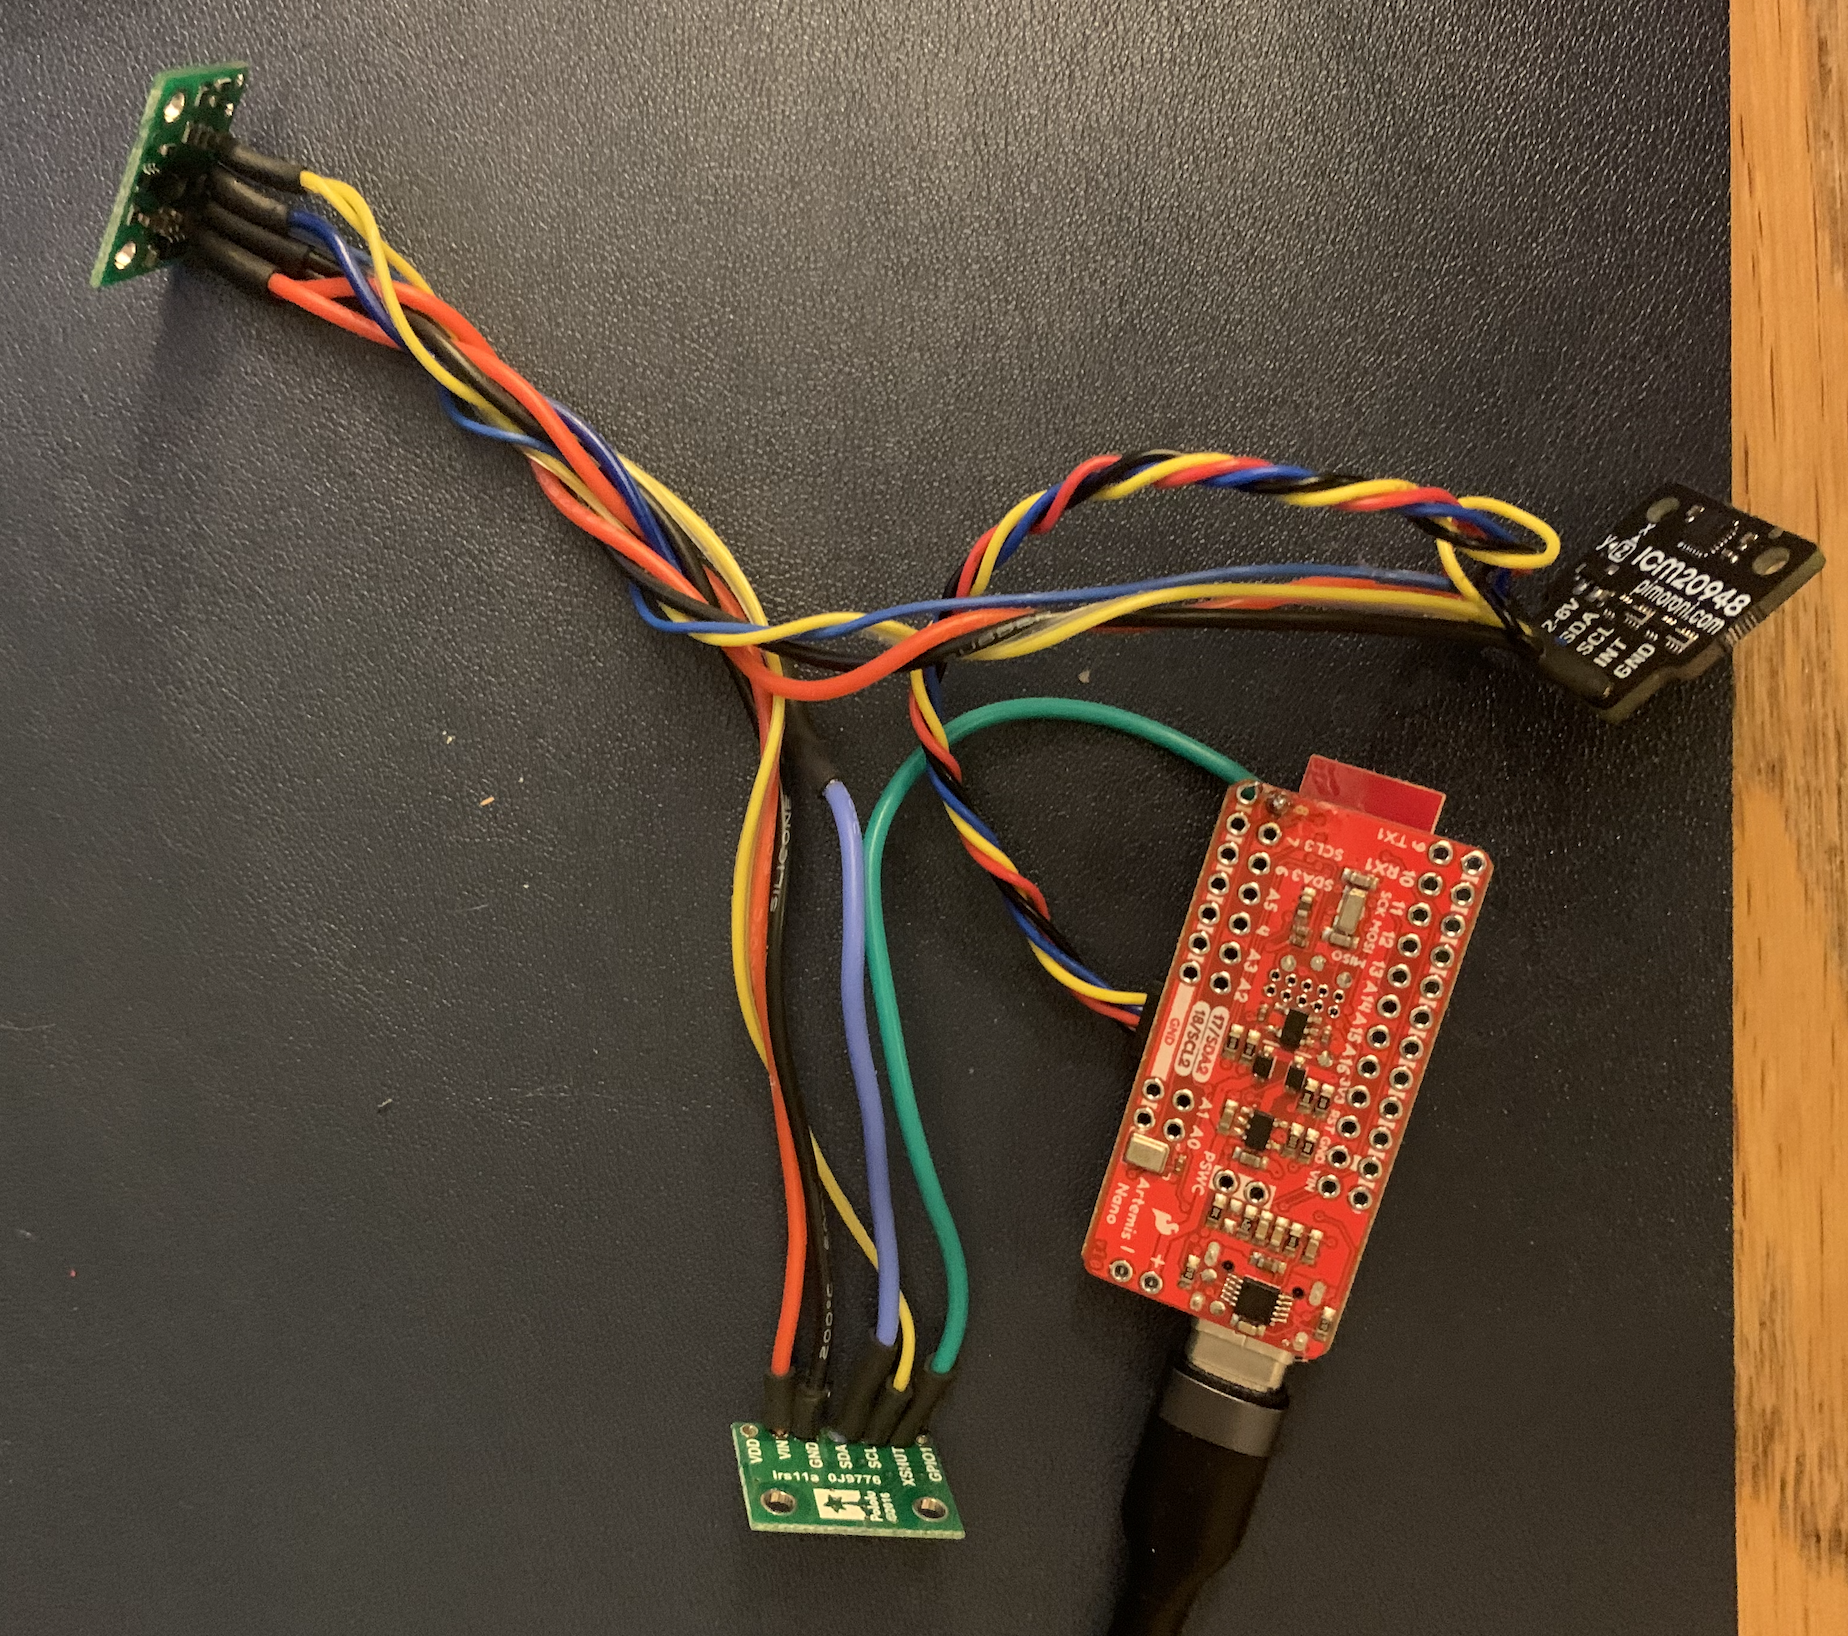
As we would like all the sensors to operate on the same I2C line, we had to daisy chain them. During the lab hours, I spent my time soldering the sensors. I did not have much experience splicing wires and spent a considerable amount of time. As we had run out of multicore wires, I used jumpers instead; I twisted the wires together to avoid current loops; I used the flat side of the sensors to mount the wires.
Time of Flight Sensors
Time of Flight Sensors will used to measure distance by the robot. Scanning the I2C channel gives the address of the Time-of-Flight sensor as 0x29. This was as expected as the datasheet mentions that the 7-bit I2C address defaults to 0101001b on power up. The sensor has three modes with the following specifications:

Our robot needs to sense short distances with a high sampling rate to avoid obstacles. The Lab space is small and has bright overhead lighting, but also dark spaces when the robot can travels under the tables. Considering this environment, the Short Distance mode would work best for the robot as it has a higher sampling rate and is unaffected to ambient light.
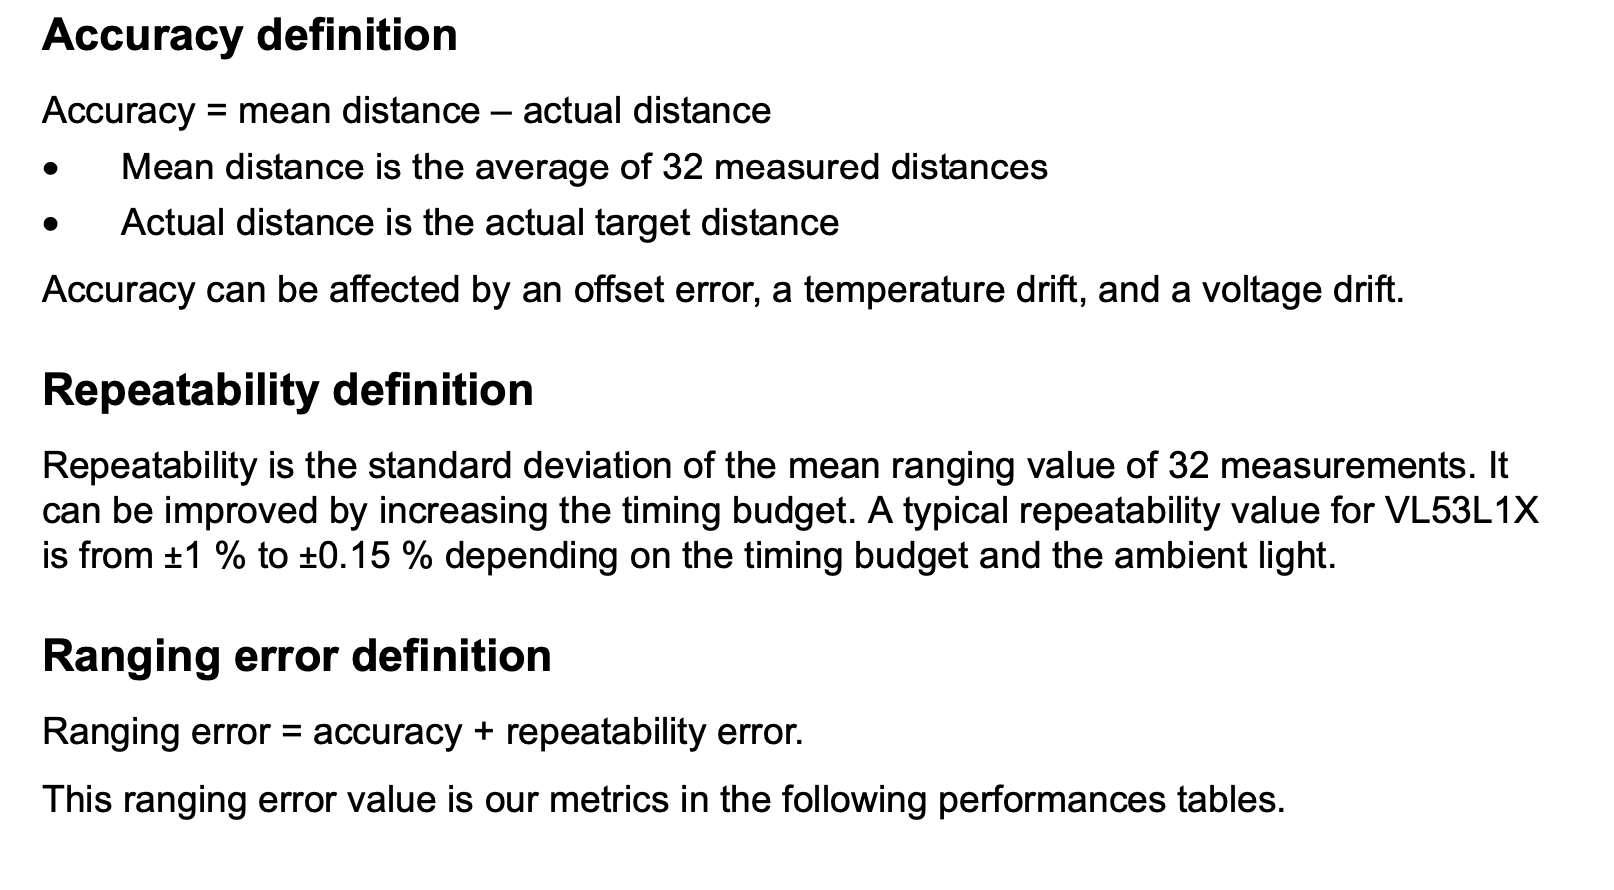
I performed environment-based as well as timing budget based analysis on the TOF sensor. Folowing measures as defined in the datasheet were calculated for the analysis.
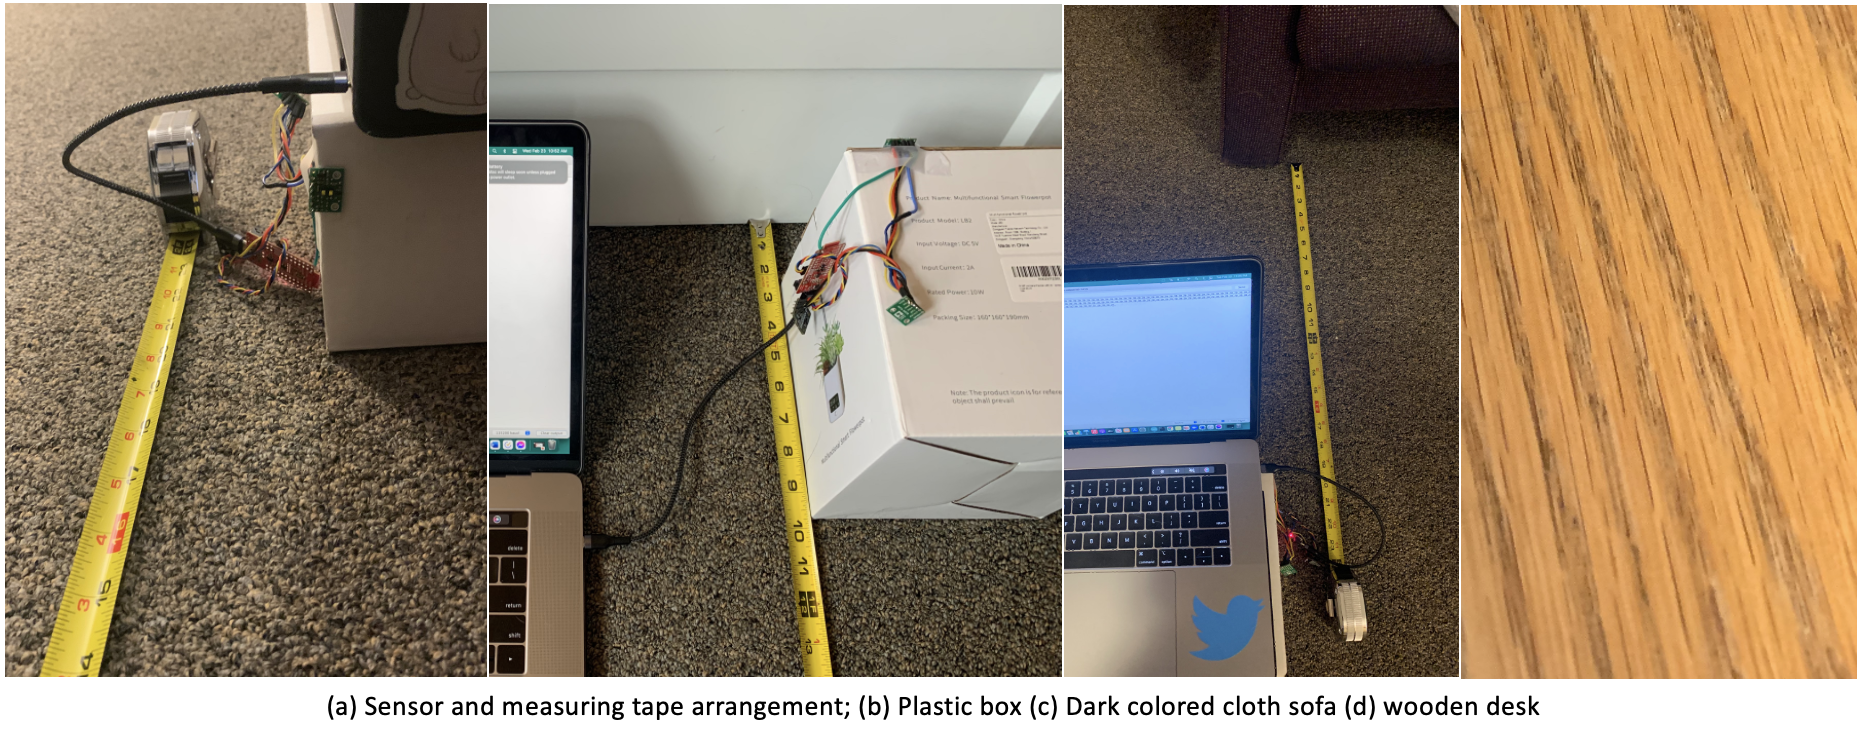
First, I tested my sensor using the Short Distance Mode with three materials varying in texture, color, and lighting. The environments - (1) light colored wooden surface with moderate lighting, (2) white matte plastic box in bright light, (3) dark colored cloth in low lighting. Timing budget was set to 20ms (lowest possible), 32 measurements were recorded for each distance. The sensor works best with the wooden surface, it is not suitable for cloth surfaces.
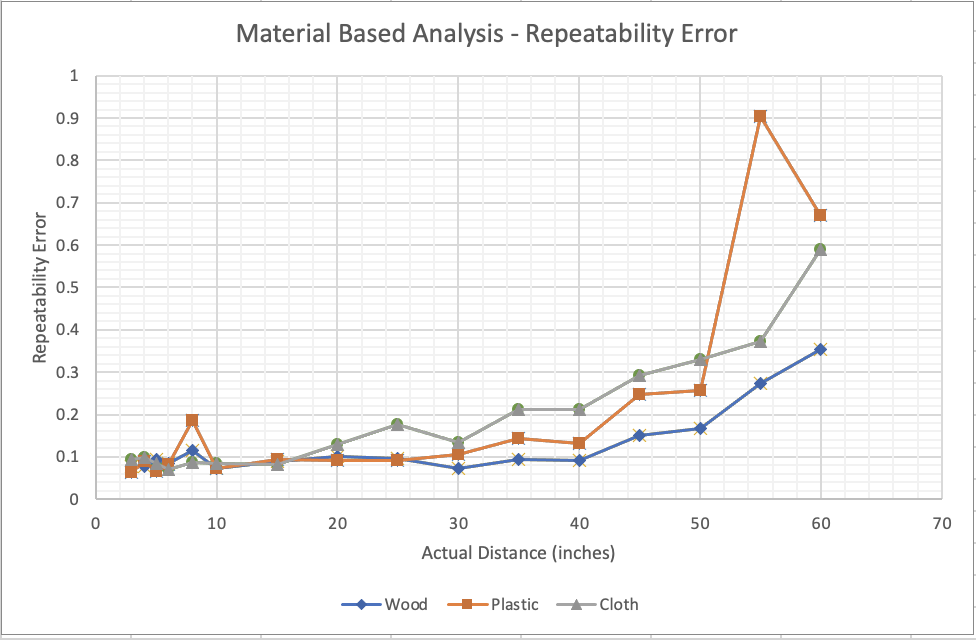
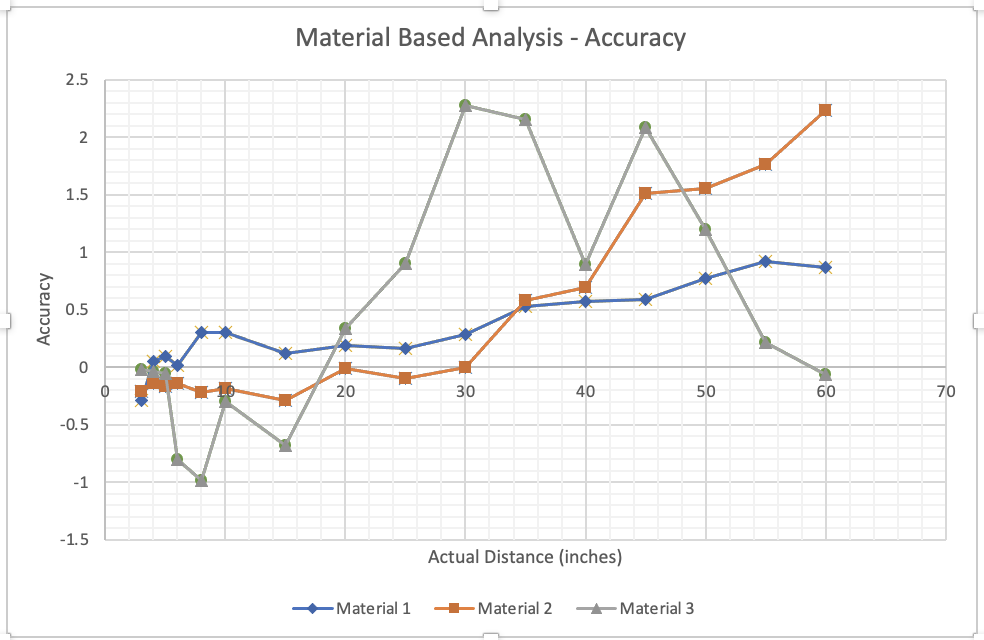

I repeated the experiment on the wooden surface with timing budgets set to 20 ms, 130 ms and just reading the values. Clearly, the readability error decreases with higher timing budget, but accuracy is best with the 20ms TB.
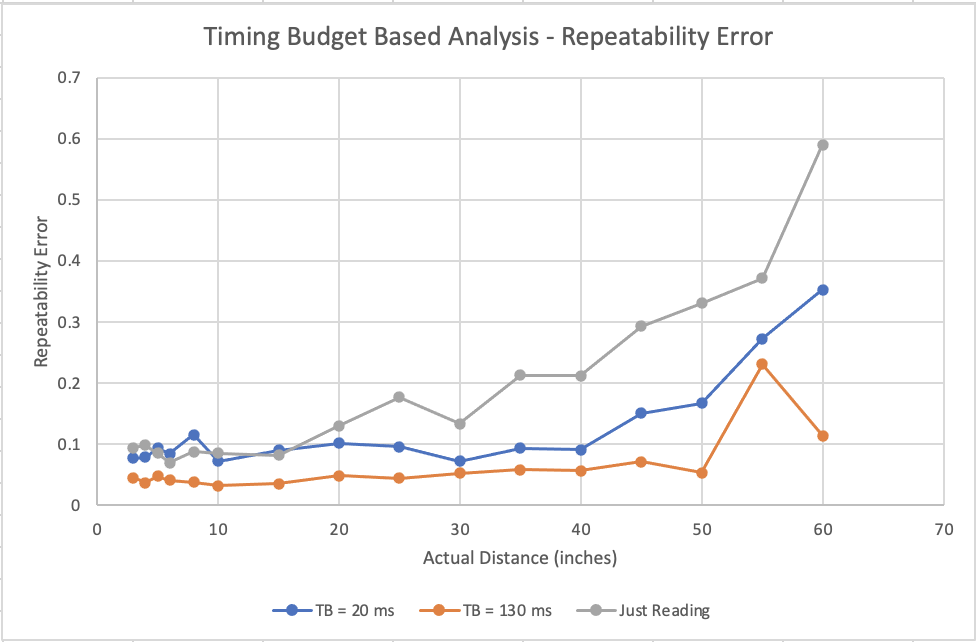
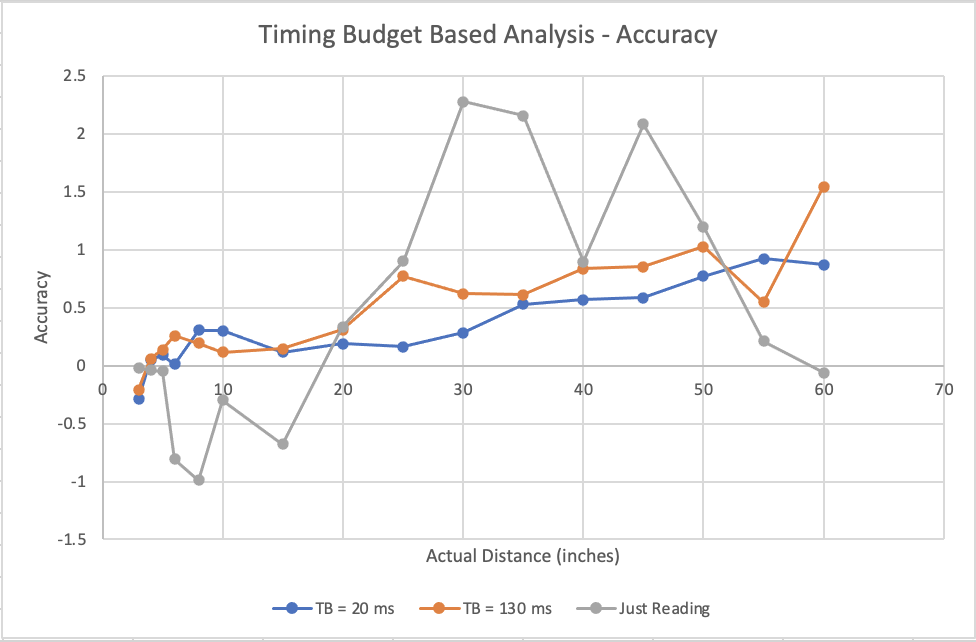

Please take a look at the [Data Sets Recorded] for more other comparative analysis. An interesting observation, the ranging time is higher for smaller distances, especially when there is no set timing budget. The overall range of the sensor for accurate readings is 3inches to 75 inches.
Using Two TOF Sensors
Both the TOF sensors have the same I2C address as manufactured, so it is not possible to communicate with both simultaneously. One option is to drive the XSHUT pins to turn one sensor on at a time and record the distance reading. I implemented the other option and changed the address of sensor 1. To do so, I connected Sensor 2’s XSHUT pin to Artemis GPIO pin 8 (GPIO pin that does not support PWM, so will not be used by the motor drivers) and drove the pin low to shutdown the sensor. I used library functions to change Sensor 1’s I2C address and then turned Sensor 2 back on. The address change logic is placed in setup function as the sensor addresses are reset on power up.
Inertial Measurement Unit
I connected to the IMU using the I2C wiring, it has address of 0x68 and was able to record measurements using the example code. Initially the IMU did not produce valid data as the AD0_VAL was set to 1. This value represents the AD0 input provided to the IMU sensor by the breakout board; this input sets the I2C address of the sensor. Based on the datasheet and the I2C address of the IMU, I inferred that AD0 was set to low and changed the AD0_VAL to 0. The breakout board documentation also confirmed this.

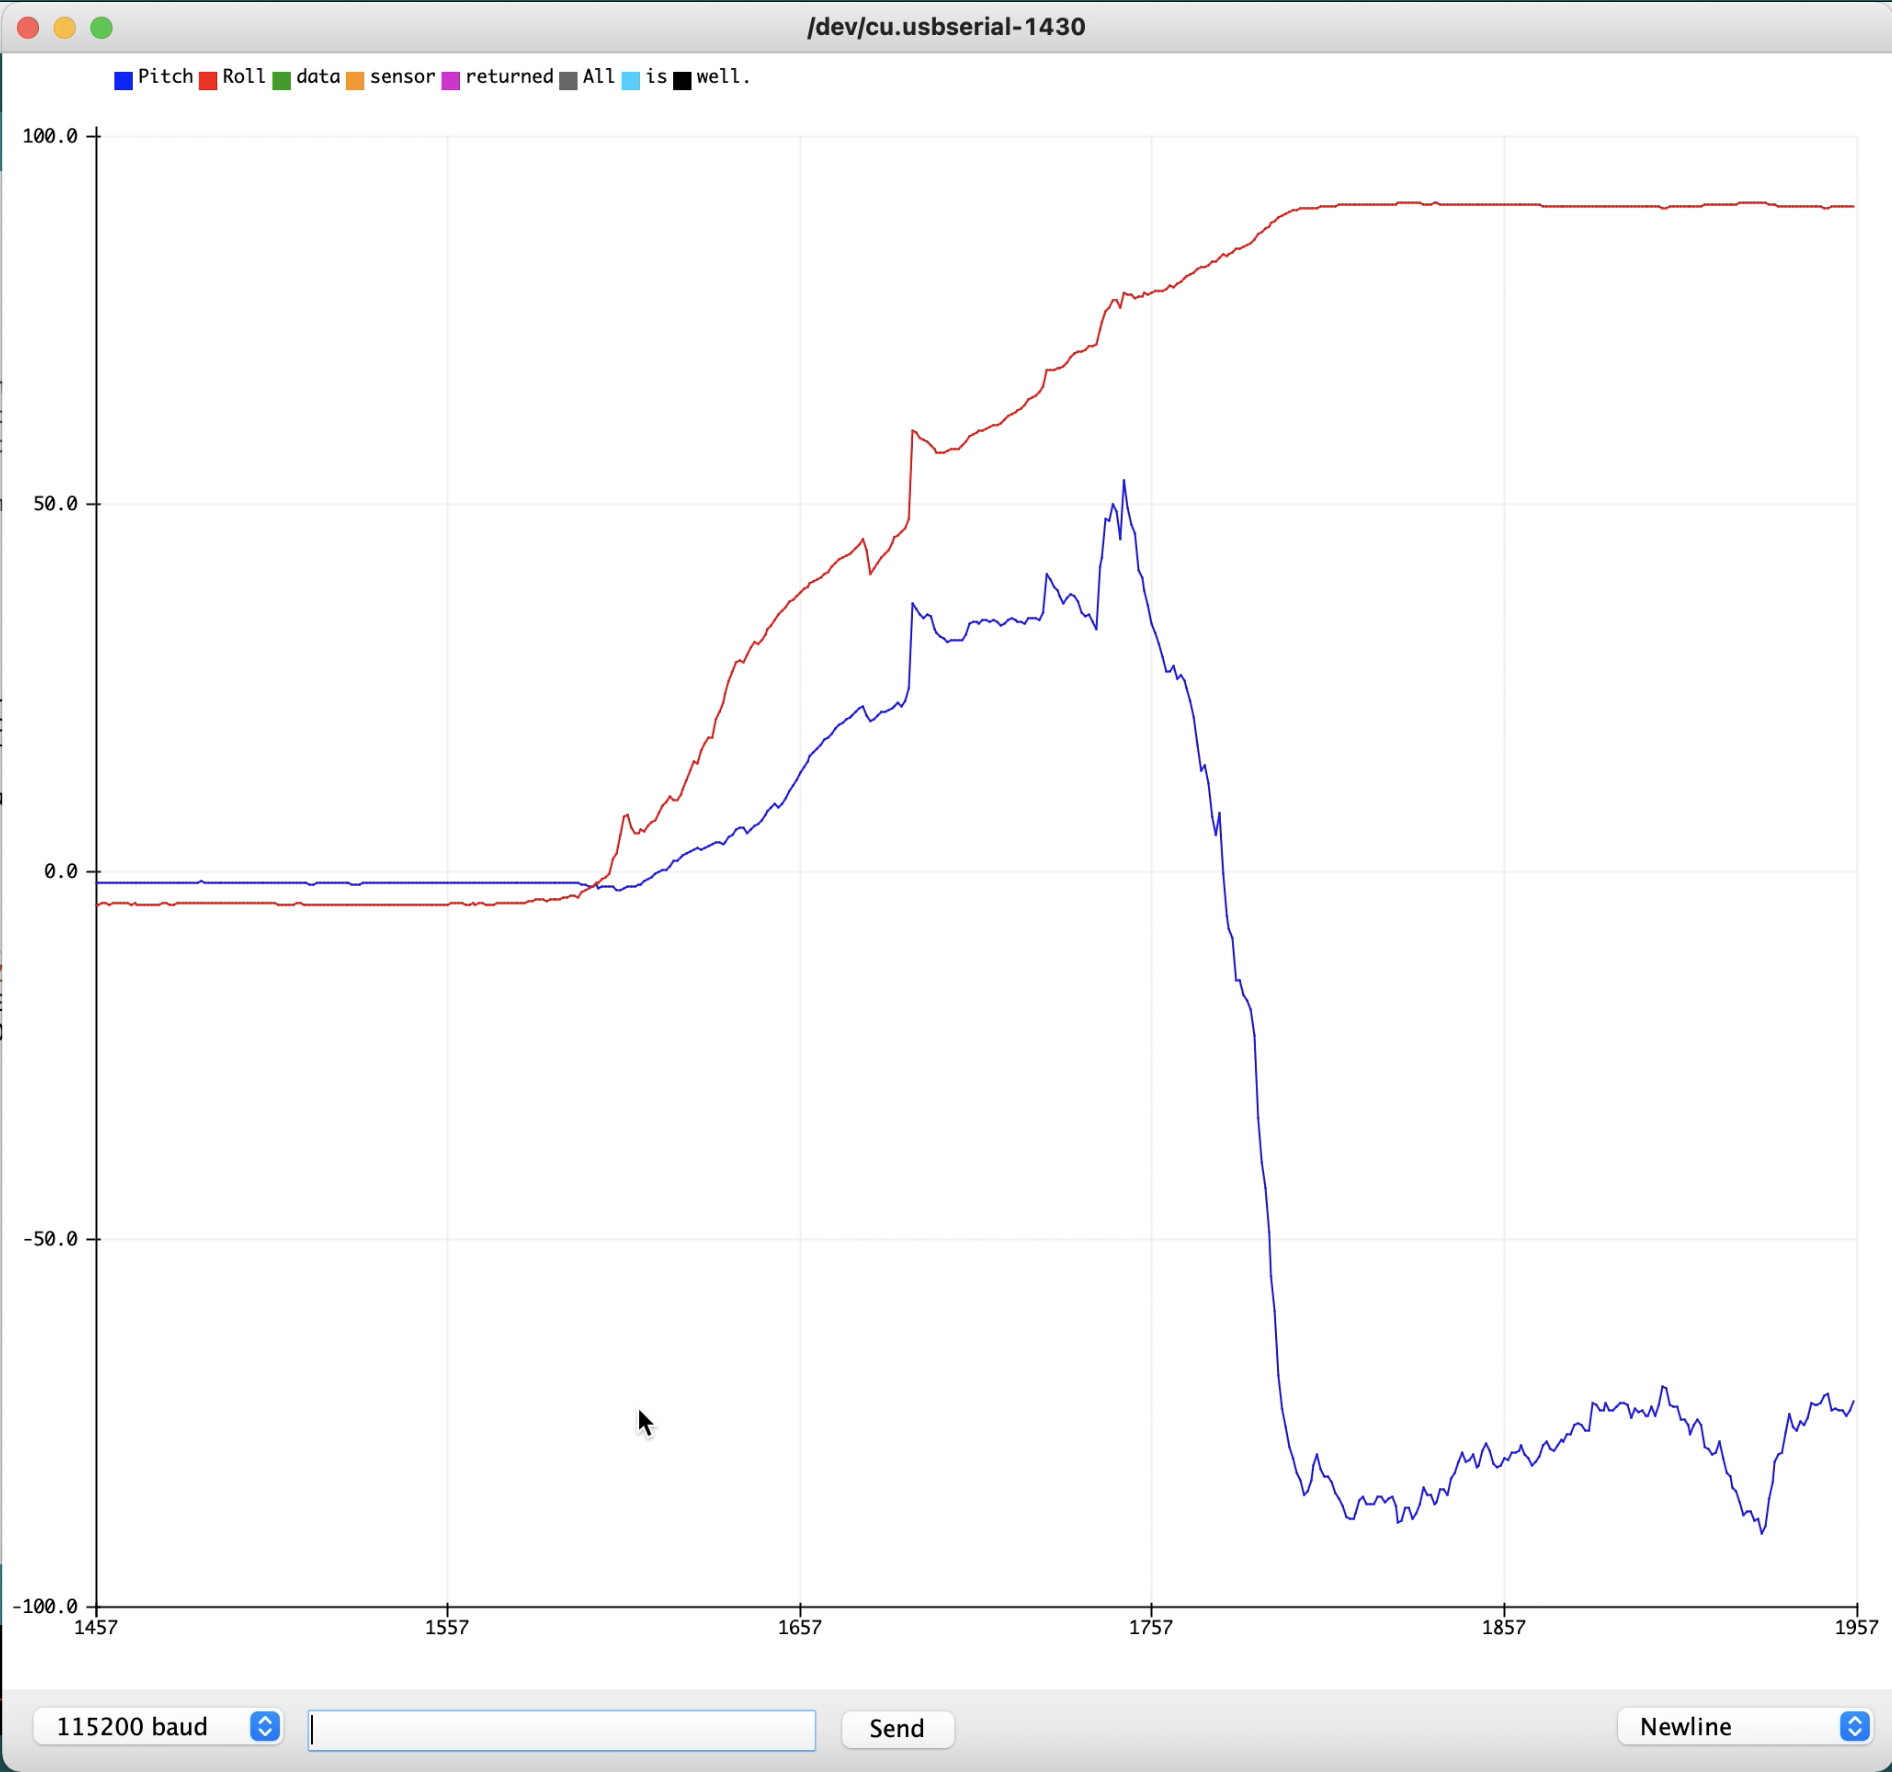
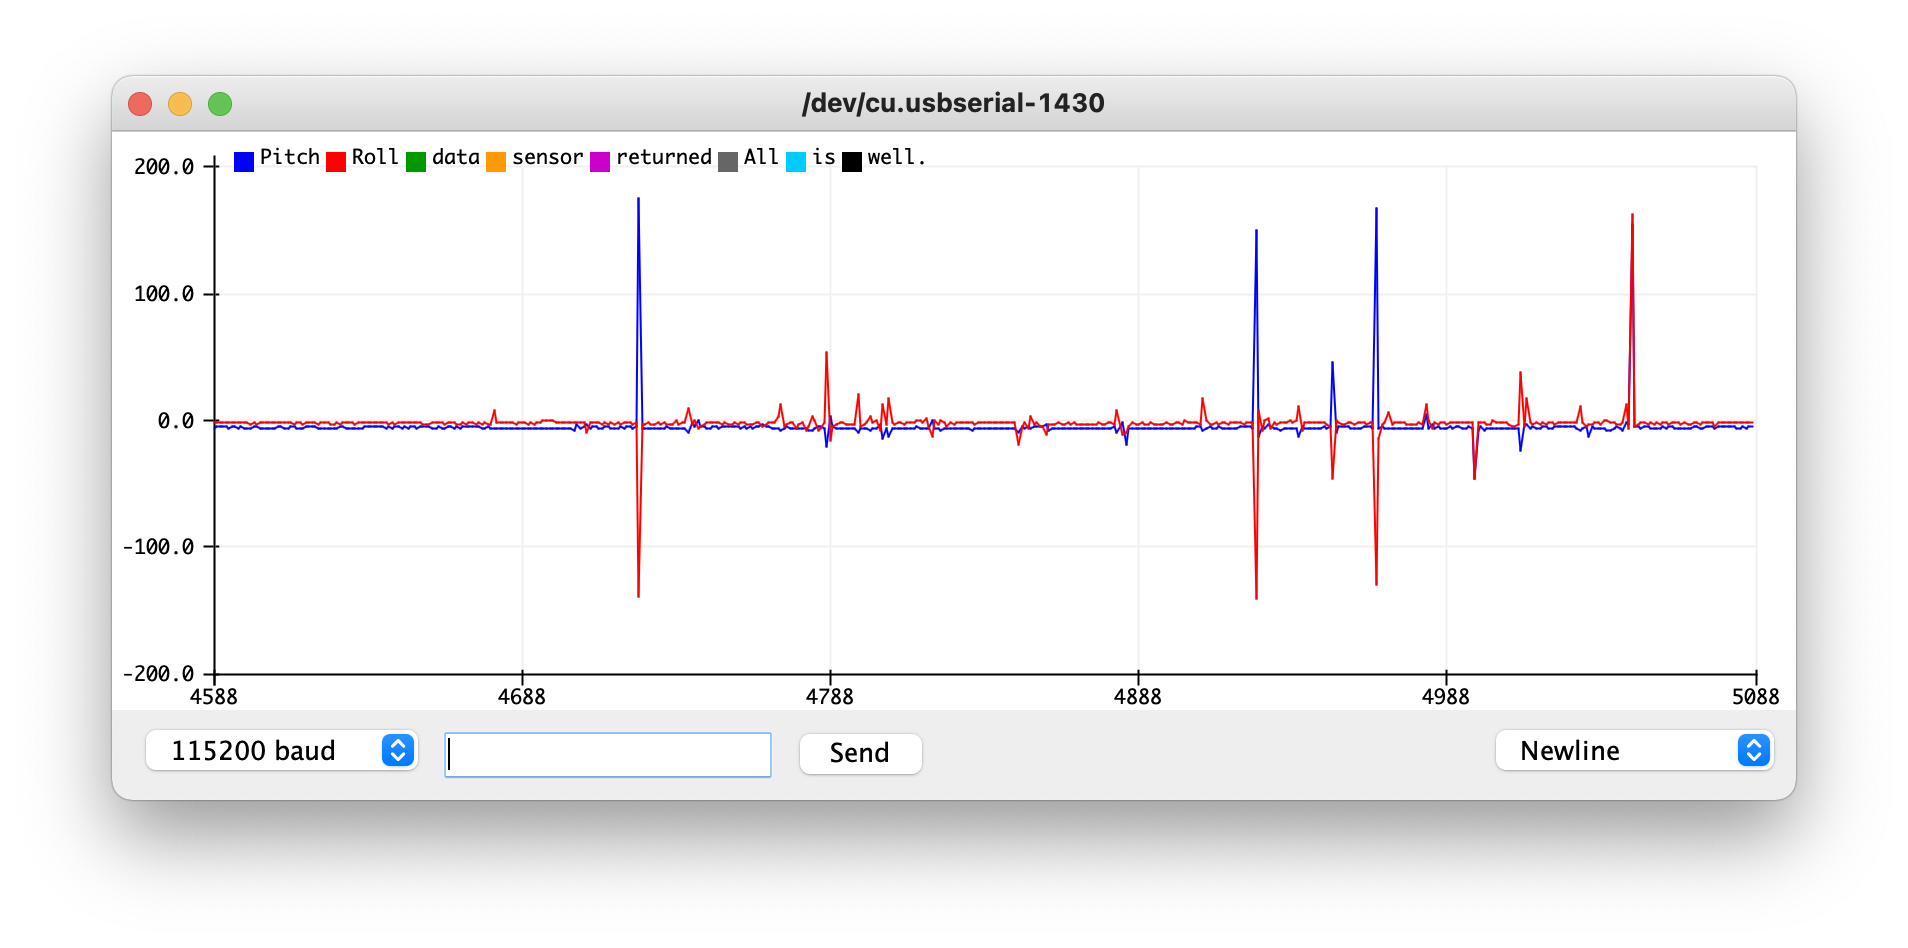
Using Serial Plotter, I have plotted the change in sensor readings values when moving the sensor. The video below explains how the sensor readings change.
Accelerometer
Using the equations from class, I calculated the pitch and roll using the accelerometer readings. The readings were surprisingly quite accurate after I used a two-point calibration factor of 2 degree correction on both ends of the range.

Next, I recorded the pitch and roll by tapping the sensor repeatedly with different intensity at varying intervals. These were quite noisy.
Using the tutorial, I did Fourier Time Transforms with Python in Jupyter Lab. Below are the time and frequency domain plots for when the sensor is being tapped and when it is still.
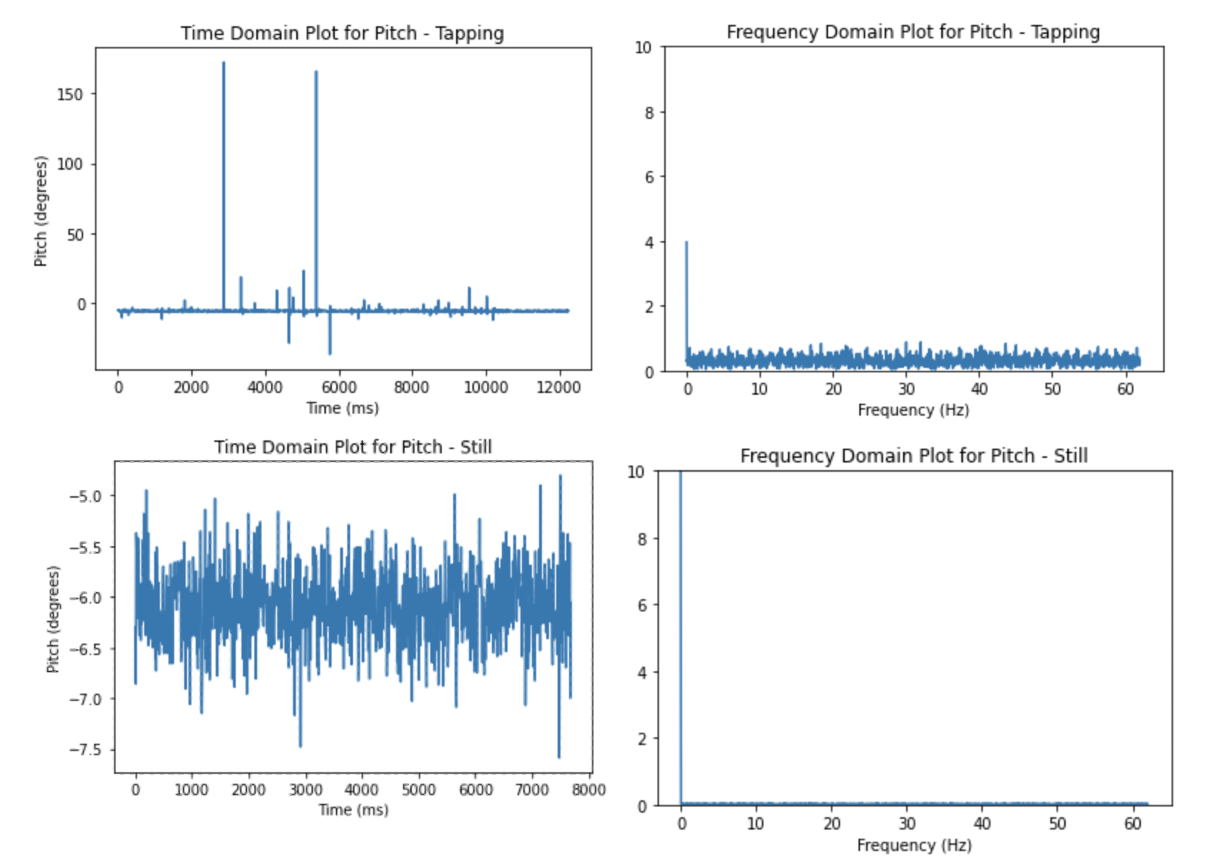
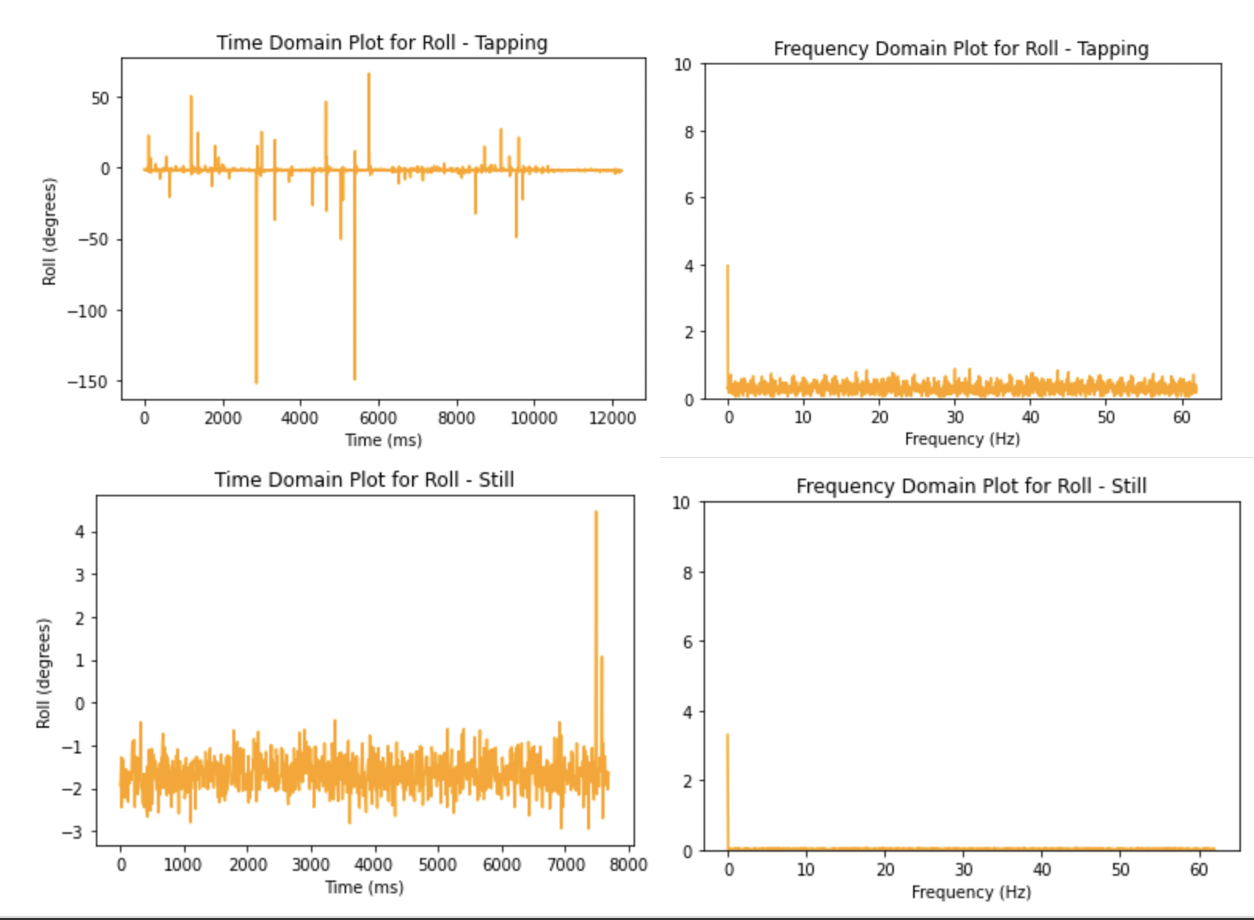
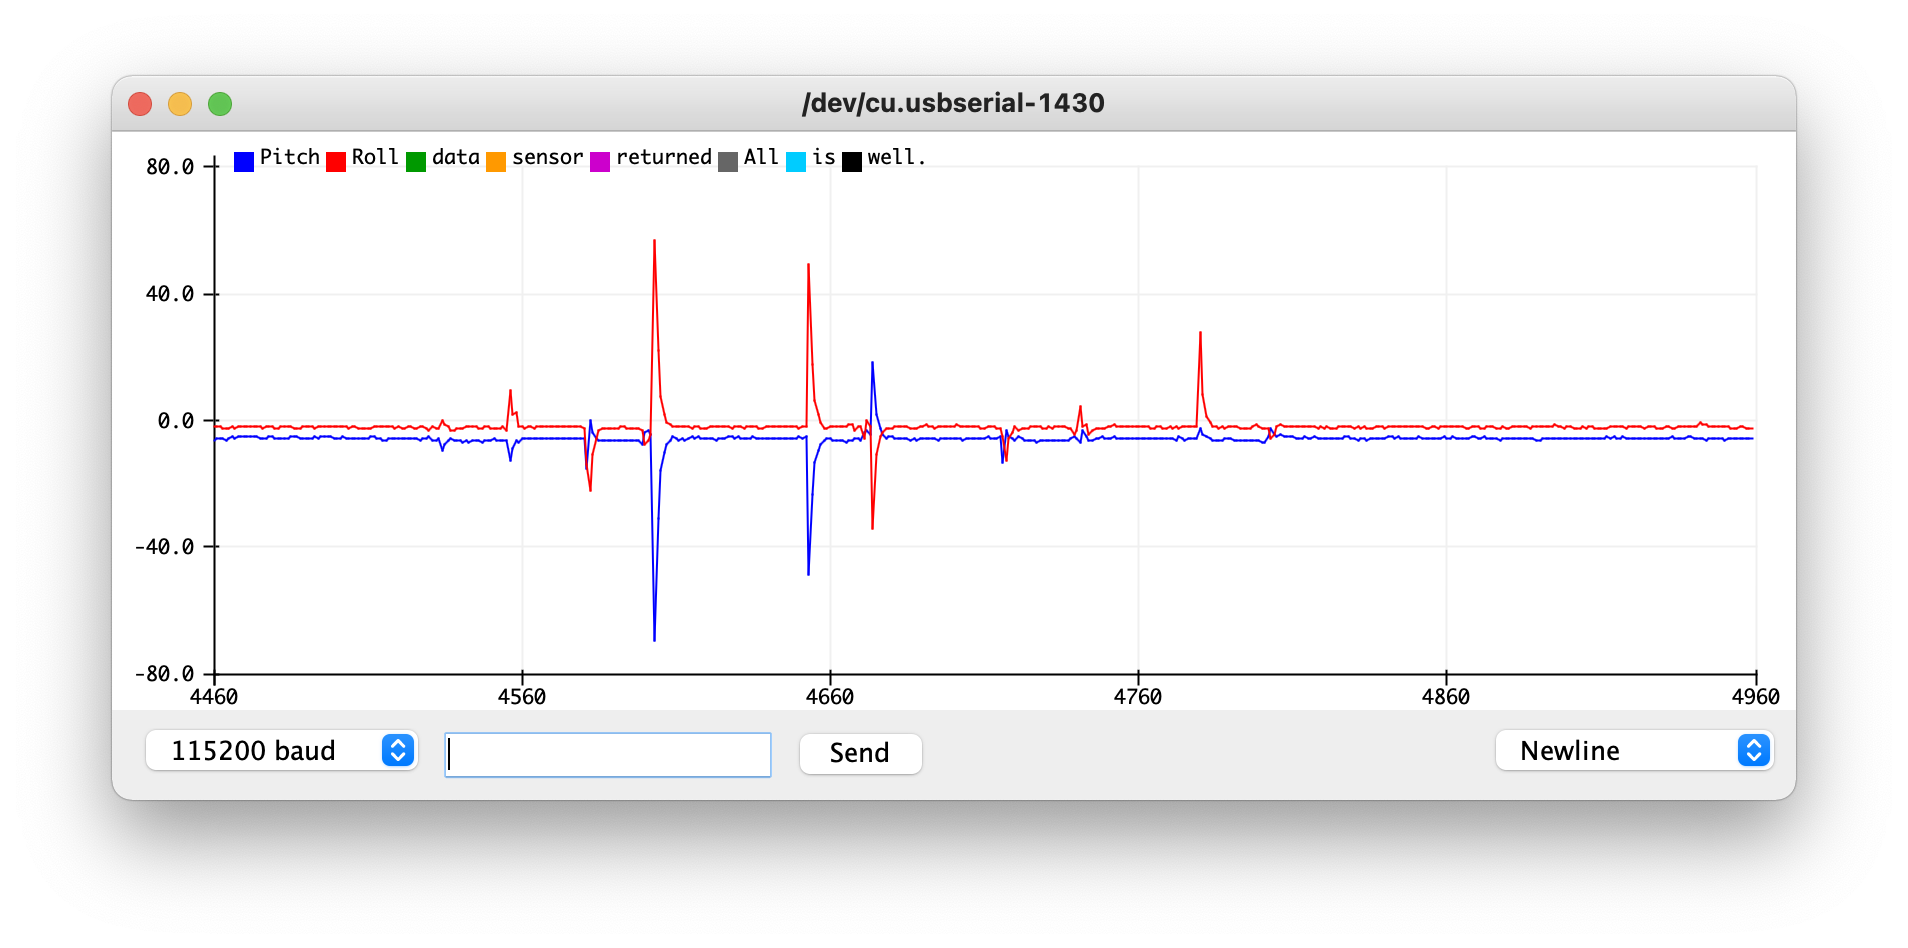
Apart from the spike around 0Hz, there is negligible noise in the frequency domain plots when the sensor is still. As there is no explicit cutoff frequency, I chose 30 Hz (maxima) as the cutoff frequency for both pitch and roll, resulting in an alpha of 0.6. I also tested with other alpha values. The plot below is the pitch and roll calculated using the low pass filter with tapping.
Gyroscope
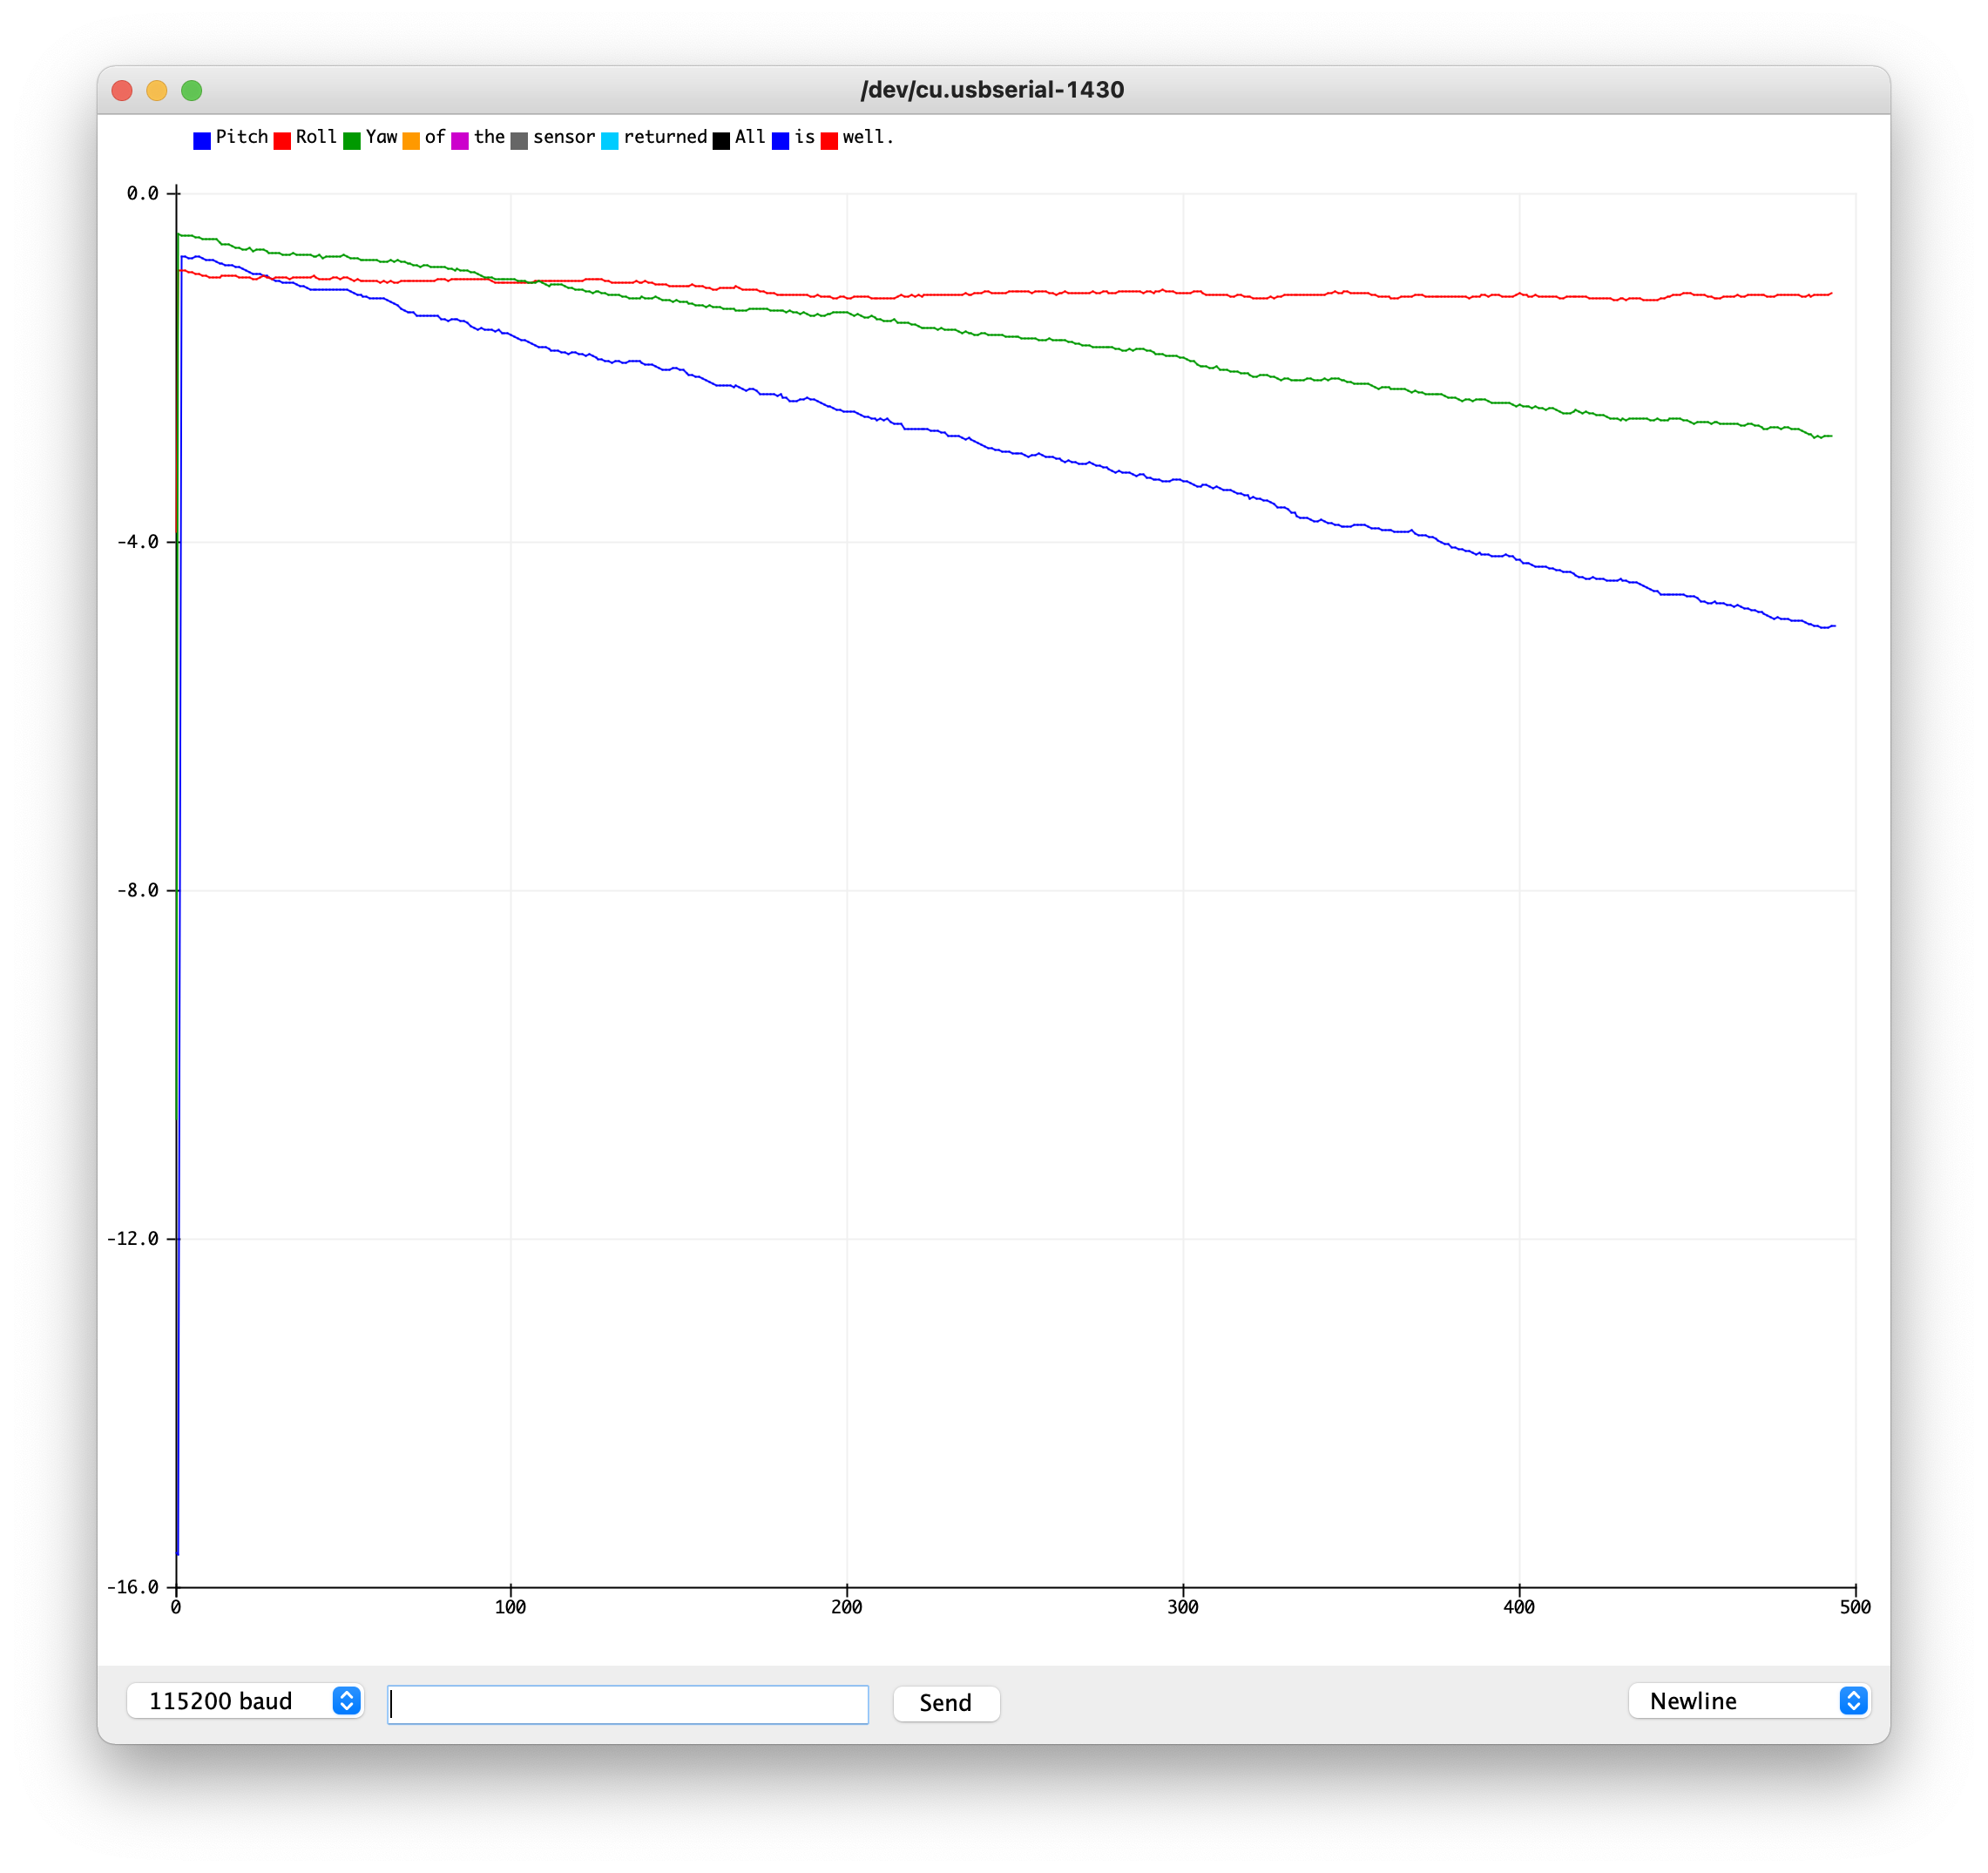
I used the gyroscope measurements to calculate the roll, pitch, and yaw angles. Below is a plot of these three values when the sensor is kept stationary. The calculated values change linearly with time despite any changes to the sensor. This is drift in the values is common for gyroscope calculations. Increasing the sampling rate, increases the rate of drift.
We use sensor fusion, as demonstrated in class, to combine the reading from the accelerometer (after the low pass filter) with the gyroscope reading to calculate the pitch and the roll angles. Impleting a complementary filter reduces this drift. The pitch and roll are plotted below when sensor is kept still and then rotated.
