Stocks, Tweets, and Volatility
Report
Introduction
The tangible impacts of social media and the unpredictability of the stock market are especially relevant in today’s day and age. We are continuously seeing how social media posts and twitter tweets are able to influence change in all various segments of society and with historic stock market trends present, we wish to discern a potential relation between the two. In particular, we wish to see how certain tweets, and their respective sentiments about a company can affect the state of the companies volatility, and stock price. More specifically, we had two primary questions.
Is their a relationship between the volatility of a stock and the number of tweets about it? Is this relationship different between general stocks in our data set, stocks of varying market cap, and the largest company in the world, Apple?
Is the stock price is affected by the attitude of tweets toward a particular company (expressed in tweets). In other words, are these two variables independent. Does this vary between general stocks in our data set and the largest company in the world, Apple?
What we ended up finding was that there is no specific effect of stock-related tweets on volatility and price. Via our data analysis, we found that their was a very weak negative correlation between a stock’s 10-day average volatility and the number of tweets about it on a given day for generic stocks. The same occurred when viewing the Apple stock in specific, though the relationship was different and a very weak positive one.
Via our evaluation of significance, we found that the stock price and attitude of tweets toward a particular company expressed in tweets are independent. We concluded that there is no established difference of 1 day changes in stock prices for stocks based on tweets mentioning them. This persists for generic stocks in the data set and Apple.
Data description
Motivation
Why was this data set created?
This data set was created to show tweet sentiment’s impact on stock returns. Each tweet is associated with a stock, given a sentiment score, and then monitored for volatility and other changes over the following days and weeks.Who funded the creation of the data set?
There was no substantial funding for this data set. It was scraped from Twitter.
Composition
What are the observations (rows) and the attributes (columns)?
Each observation in our data set is an individual tweet, and its columns consist of the tweet text, the date it was created, a sentiment score between -1 and 1, volatility data over the month following the tweet, and return data over the week following the tweet.If people are involved, were they aware of the data collection and if so, what purpose did they expect the data to be used for?
Those who posted the tweets in the data set likely don’t know that their data was collected. Though, their accounts are likely public and can be viewed by anyone.Are there any errors, sources of noise, or redundancies in the dataset?
In the original dataset, there was an error with the columns and observations since the data was clearly not aligned properly with the appropriate column. This error required us to have to clean the data prior to data analysis to ensure we had correct data to work with.
Collection Process
- What processes might have influenced what data was observed and recorded and what was not?
Since this data was scraped from Twitter, it was likely influenced by Twitter’s algorithm that determines what is shown to each user. Additionally, each tweet was run through a sentiment-detecting algorithm which could have also impacted the results.
Preprocessing/cleaning/labeling
- What pre-processing was done, and how did the data come to be in the form that you are using?
In order to prepare the data for proper use, we first had to fix about half of the rows that were aligned with the wrong variables and split between two rows each. To do this, we isolated the impacted rows, fixed their alignment, and then re-added them to the data frame. We also renamed the columns using lowercase letters to improve reproducibility and removed the X column, as it was unnecessary.
Data analysis
Summary statistics of data set
Summary of a stock’s average daily number of tweets, average volatility, average one day returns and mean sentiment of tweets.
# A tibble: 103 × 5
   stock            mean_volatility mean_x1_day_return mean_daily_tweet_count
   <chr>                      <dbl>              <dbl>                  <dbl>
 1 21CF                        15.2         -0.000149                    3
 2 ASOS                        34.3         -0.00120                    13.9
 3 AT&T                        21.8         -0.00196                    39.4
 4 Adobe                       27.9          0.0000424                  26.0
 5 Allianz                     11.9         -0.00141                     6.64
 6 Amazon                      24.3          0.000785                  530.
 7 American Express            19.0         -0.000406                    4.24
 8 Apple                       23.0         -0.00293                   899.
 9 AstraZeneca                 24.6         -0.00474                     3.12
10 Audi                        22.5         -0.000570                   28.5
# ℹ 93 more rows
# ℹ 1 more variable: mean_sentiment_of_tweets <dbl>
Visualization between stock volatility and the frequency of tweets
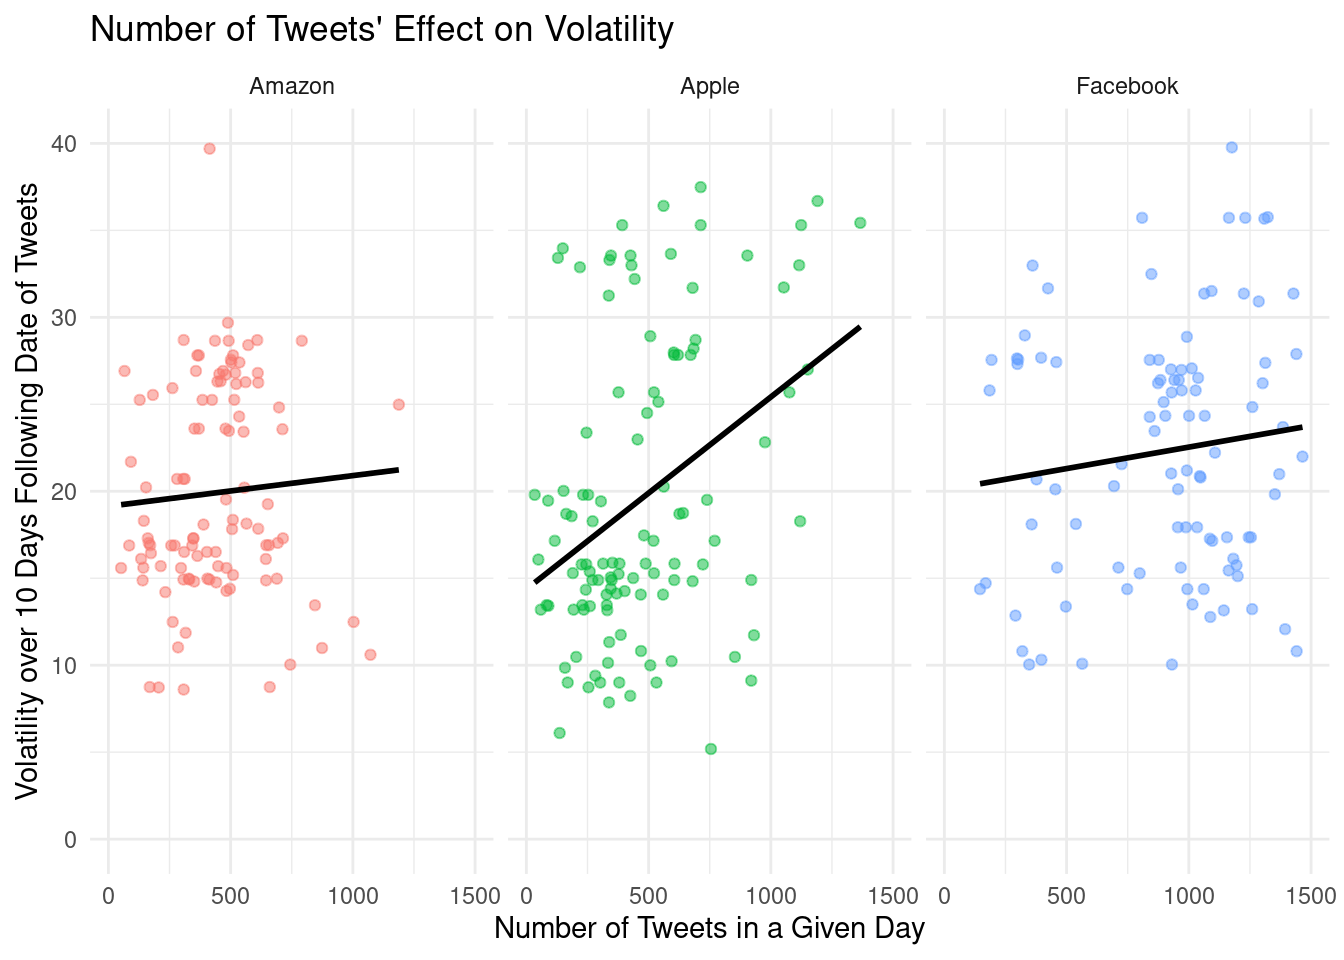
What is the general relationship between volatility and the frequency of tweets?
Is this relationship different across high market cap (generally popular) stocks and lower market cap (generally unpopular) stocks?
Stock volatility and the frequency of tweets visualization of high cap stocks
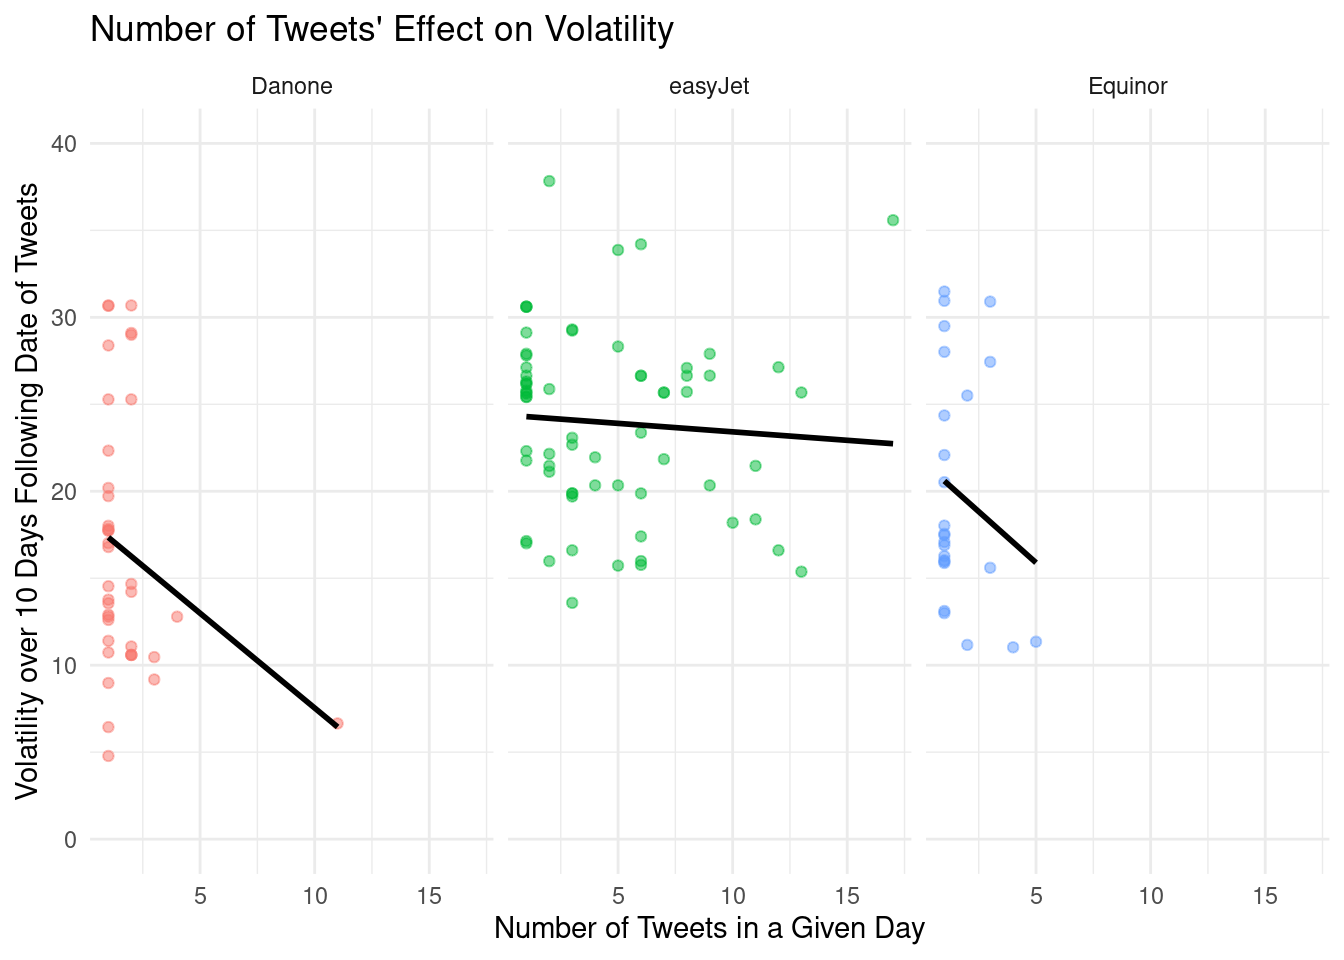
Stock volatility and the frequency of tweets visualization of low cap stocks
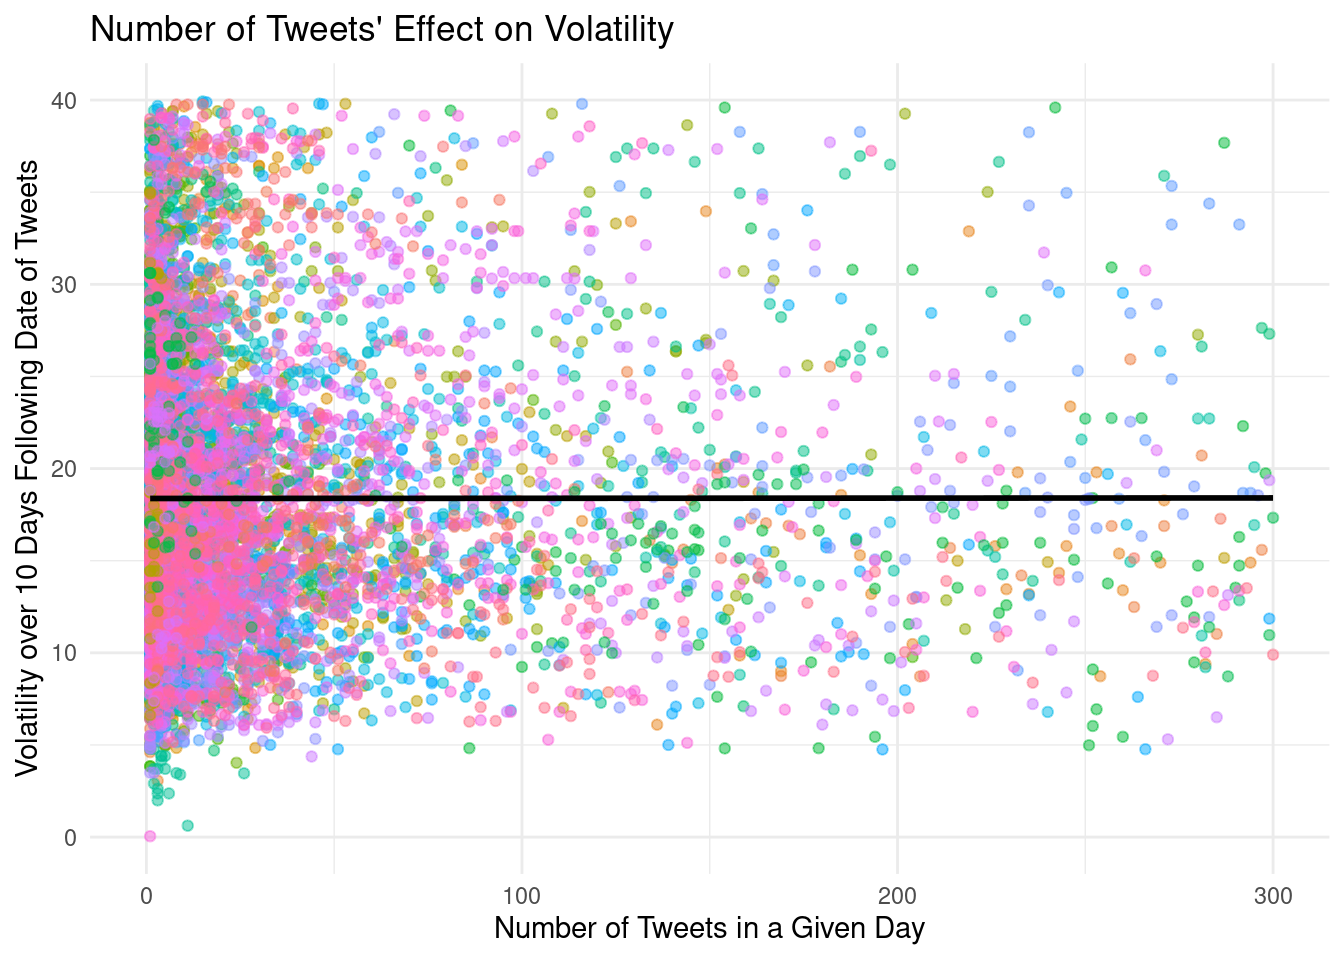
Stock volatility and the frequency of tweets visualization of all stocks across the data set
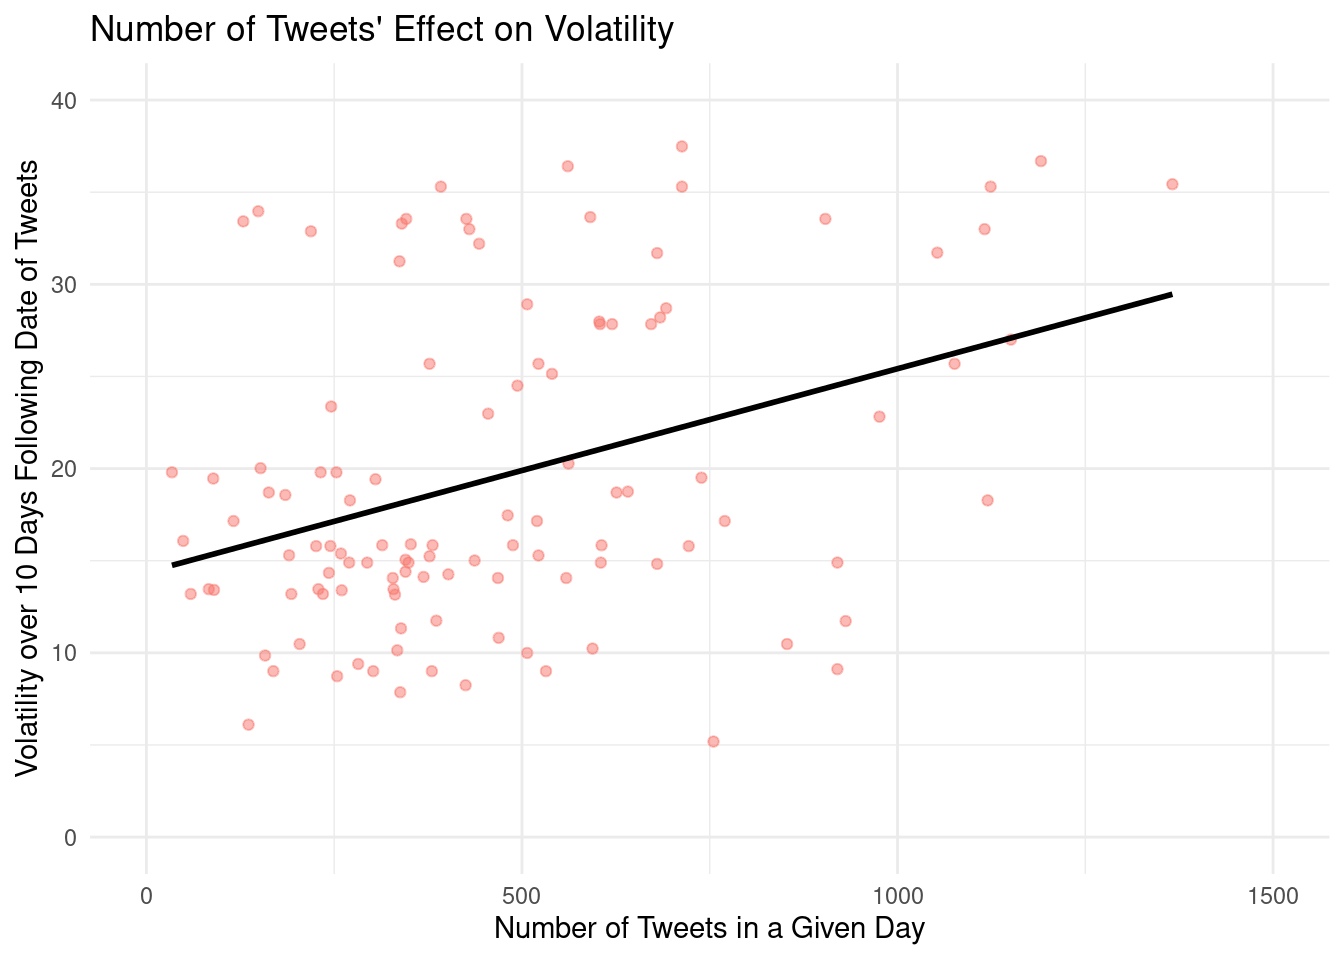
Stock volatility and the frequency of tweets visualization of Apple’s stock
Predicting stock volatility
Linear regression model predicting stock volatility and the tweets frequency of all stocks in the data set
# A tibble: 2 × 5
  term          estimate std.error statistic p.value
  <chr>            <dbl>     <dbl>     <dbl>   <dbl>
1 (Intercept) 18.3         0.285     64.5      0
2 tweet_num    0.0000243   0.00146    0.0167   0.987
# A tibble: 1 × 12
r.squared adj.r.squared sigma statistic p.value df logLik AIC BIC
<dbl> <dbl> <dbl> <dbl> <dbl> <dbl> <dbl> <dbl> <dbl>
1 0.000000136 -0.000491 11.9 0.000278 0.987 1 -7928. 15861. 15878.
# ℹ 3 more variables: deviance <dbl>, df.residual <int>, nobs <int>\[ volatility = 18.35 + 0.00002 \times number~of~tweets \]
Intercept: Companies with zero tweets on a given day are expected, on average, have a stock volatility of 18.35
Slope: For each additional tweet that mentions a company on a given day, the company’s stock volatility is expected to be higher, on average, by 0.00002.
Linear regression model predicting stock volatility and the tweets frequency of Apple’s stock
# A tibble: 2 × 5
  term        estimate std.error statistic  p.value
  <chr>          <dbl>     <dbl>     <dbl>    <dbl>
1 (Intercept) 17.5       1.30        13.5  9.62e-26
2 tweet_num    0.00607   0.00189      3.21 1.68e- 3
# A tibble: 1 × 12
r.squared adj.r.squared sigma statistic p.value df logLik AIC BIC
<dbl> <dbl> <dbl> <dbl> <dbl> <dbl> <dbl> <dbl> <dbl>
1 0.0799 0.0722 9.20 10.3 0.00168 1 -439. 884. 893.
# ℹ 3 more variables: deviance <dbl>, df.residual <int>, nobs <int>\[ volatility = 17.50 + 0.00607 \times number~of~tweets \]
Intercept: Apple with zero tweets on a given day is expected, on average, have a stock volatility of 17.50
Slope: For each additional tweet that mentions Apple on a given day, Apple’s stock volatility is expected to be higher, on average, by 0.00607.
Evaluation of significance
Is the stock price impacted by the opinion of tweets for generic stocks?
Question: Are 1 day changes in stock price different for stocks based on the number of tweets mentioning them
- Is the change in stock price and number of tweets independent?
- We will test this via a significance level of 5% (α = .05)
Null Hypothesis: There is no difference of 1 day changes in stock prices for stocks based on tweets mentioning them
\[ H_0: \mu_1 - \mu_2 = 0 \]
Alternate Hypothesis: There exists a difference of 1 day changes in stock prices for stocks based on tweets mentioning them
\[ H_a: \mu_1 - \mu_2 \neq 0 \]
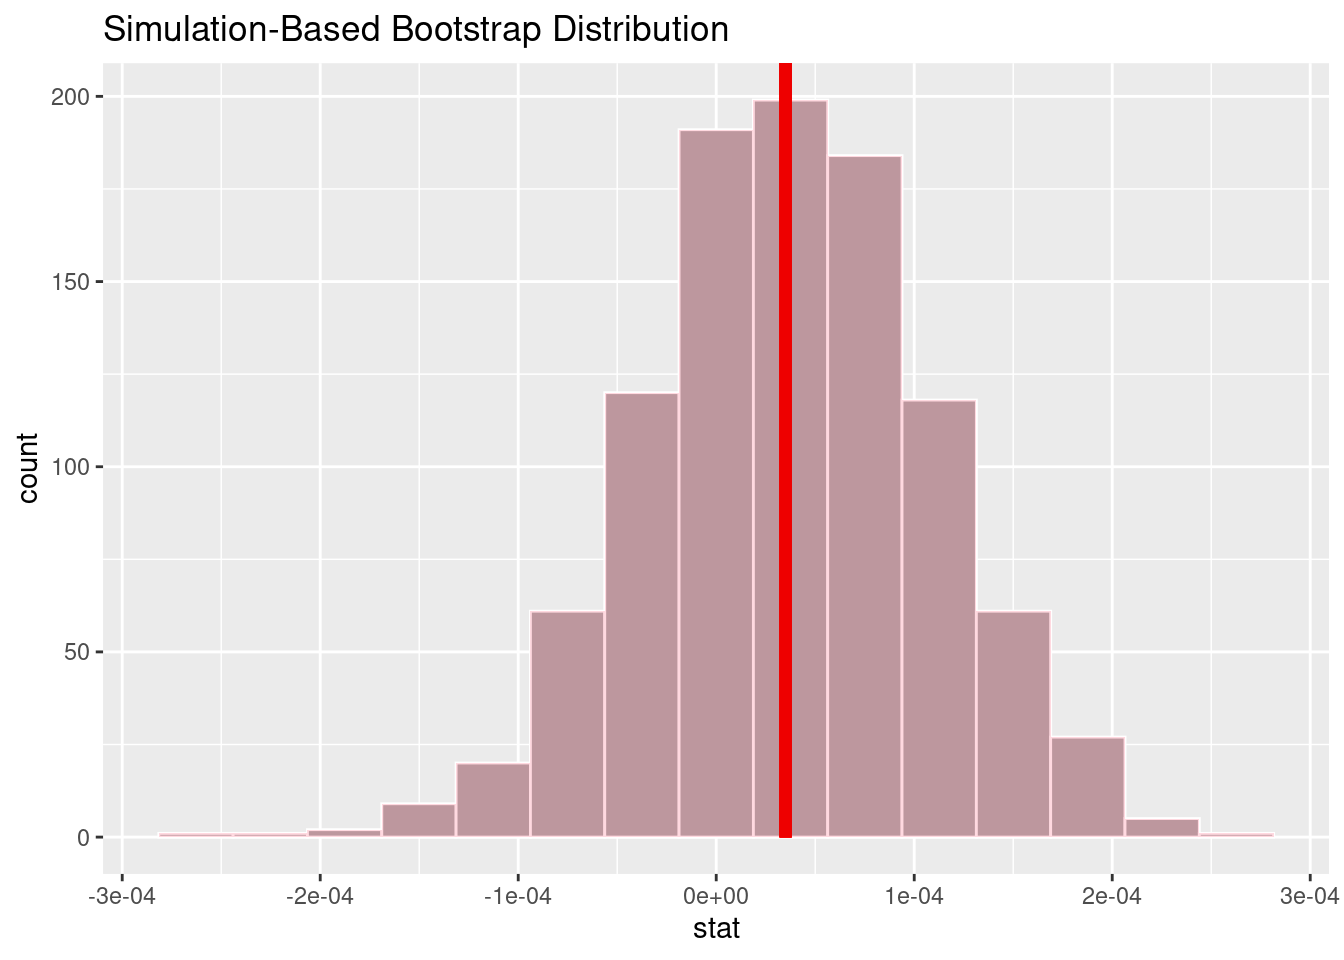
# A tibble: 1 × 1
  p_value
    <dbl>
1   0.986
Given that our significance level is .05 our P-value is 0.986, our p-value is greater than our significance level. As such, we fail to reject and accept the null hypothesis while rejecting the alternate hypothesis. Our findings indicate that there is no difference of 1 day changes in stock prices for stocks based on the sentiments of the tweets mentioning them.
Is the stock price impacted by the number of tweets for generic stocks?
Question: Are 1 day changes in stock price different for stocks based on the number of tweets mentioning them?
- Is the change in stock price and number of tweets independent?
- We will test this via a significance level of 5% (α = .05)
Null Hypothesis: There is no difference of 1 day changes in stock prices for stocks based on tweets mentioning them
\[ H_0: \mu_1 - \mu_2 = 0 \]
Alternate Hypothesis: There exists a difference of 1 day changes in stock prices for stocks based on tweets mentioning them
\[ H_a: \mu_1 - \mu_2 \neq 0 \]
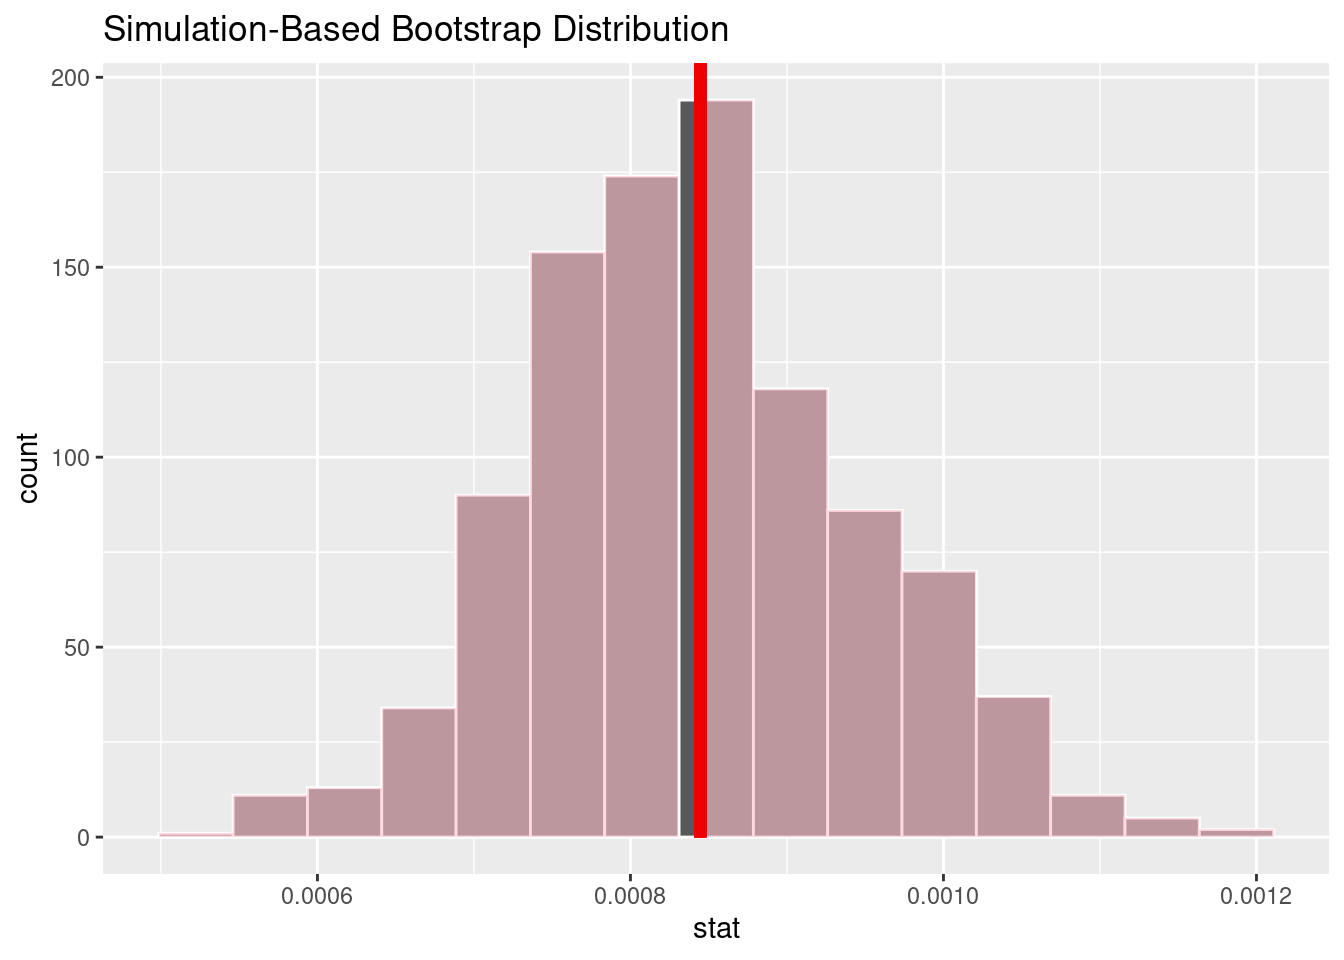
# A tibble: 1 × 1
  p_value
    <dbl>
1   0.946
Given that our significance level is .05 our P-value is 0.946, our p-value is greater than our significance level. As such, we fail to reject and accept the null hypothesis while rejecting the alternate hypothesis. Our findings indicate that there is no difference of 1 day changes in stock prices for Apple based on the sentiment of tweets about the company.
Interpretation and conclusions
Through our data analysis, we found that the relationship between the 10-day volatility of stocks in our dataset and the number of tweets about it on a given day are not well correlated, it has a very weak negative correlation. Our model’s linear regression carries an adjusted R^2 value of -0.0004. Moreover, this is the same case when viewing apple in specific. The linear model predicting volatility of Apple’s stock has an adjusted R^2 value of -0.0004. As such, both of these model with number of tweets on a given day as a sole explanatory variable is not good at predicting for volatility of stocks. There is not a relationship between volatility of a stock and the number of tweets about it on a given day. Although, this relationship is different between general stocks in our data set, stocks of varying market cap, and the largest company in the world, Apple. Via our evaluation of significance, we found that the stock price and attitude of tweets toward a particular company expressed in tweets are independent. We concluded that there is no established difference of 1 day changes in stock prices for stocks based on tweets mentioning them. This persists for generic stocks in the data set and Apple. For stocks across our dataset, given that our significance level is .05 our P-value is 0.986, we fail to reject the null hypothesis. For Apple, given that our significance level is .05 our P-value is 0.946, we also fail to reject the null hypothesis. Our findings indicate that there is no difference of 1 day changes in stock prices based on the sentiments of the tweets mentioning them for generic stocks in our dataset and Apple. It is worth noting that our data set includes stocks of varying market caps and popularities, which could impact how tweets affect them. Additionally, the number of data points for each stock varies within the dataset. High market cap companies like Apple, Amazon, and Ford have thousands of rows associated with them, while low market cap companies like Danone, easyJet, and Equinor have a significantly fewer amount of rows. Overall, there are many factors that could go into a stock’s response to attention in any form that should be considered in future studies.
Limitations
The data set contains preexisting results of two machine learning models to describe the sentiment of a tweet. One model was a Long short-term memory neural network and the other was TextBlob Python NLP library. It is unknown how the curators of this data set utilized these models and we cannot fully ascertain the accuracy or veracity of these model’s predictions, nor can we describe it’s bias. As such, there is a possibility that the polarity scores provided may contain errors and false predictions. However, we are assuming that the results of this model were accurate and contained very little bias. Moreover, another limitation is the direct relationship that we are pursuing. Although social media tweets and associated sentiments may seem to be correlated with stock price, volatility and volume, there exist other factors that could confound this relationship which we are unable to pursue. We cannot ascertain causality and we are limited to analyzing the correlation between the two. Finally, with the sheer amount of data in our data set, it is impossible to analyze it in its entirety. As such, we are limited to a certain subset of the data set, particularly looking at the stock and date variables. Given this limitation, we have done our best to remove and/or correct any erroneous or problematic rows.
Acknowledgements
We acknowledge the Tidyverse documentation and Kaggle, specifically the user “The Devastator” on Kaggle.com who uploaded this dataset to Kaggle.