We found this data set on the WHO website. We did not need to do any scraping or surveys, we were able to download this data set as an excel file and upload it to r studio. To make this data fit our research questions better, we first filtered to include on the sex variable to include only women in our data set. We then selected only columns relevant to our research questions. We plan on creating another column indicating if a country is a developing nation or a developed nation, but we are in the process of finding a reputable data set including that data. Update: We created another column indicating whether a country is a developing nation or a developed nation through mutating the dataset and entering country classification based on whether the countries in the dataset were in the list of developing countries (in the “developing_countries” vector we created, based on the list of developing countries declared by the Minister for Foreign Affairs (https://www.dfat.gov.au/sites/default/files/list-developing-countries.pdf); countries on the pdf’s list but not in our data were removed, while countries in our data but not on the pdf were individually cross-checked with a search from data in the World Bank’s website).
Data description
Have an initial draft of your data description section. Your data description should be about your analysis-ready data.
The observations for our dataset are the sample of women in each country. The attributes consist of country name, sex, year the data was collected, age range of participants in the sample, pregnancy status, mean hemoglobin levels for that observation, and the individual proportions of the sample with a hemoglobin level below a certain threshold.
The original dataset from which this was derived was funded by the World Health Organization and created for the analysis of hemoglobin data for global anemia estimates in 2021. Original data was collected via health and nutrition examinations, as well as household surveys, and anonymized individual records drawn from various databases. The creation of our dataset was motivated by the fact that anemia is both the most common blood condition globally and is a serious issue in public health as low numbers of red blood cells associated with the condition are consequential to the body’s ability to perform physiological functions, with an increased risk of mortality. Hemoglobin thresholds can differ by age groups and pregnancy status, with vulnerable populations including pregnant women and children. Our group specifically wanted to narrow our analyses to seeing the relationship between estimated global anemia rates in women based on pregnancy status (pregnant/non-pregnant), age range, or country status (developing/developed). Outlining these distributions can help to identify whether the latter factor may have an impact on the former, and whether it may be appropriate to inform and target necessary scales of prevention measures against anemia for vulnerable populations based on such.
Additional preprocessing of the data for our current include filtering for sex (samples with women only, mixed sex samples were excluded from the data), and as we look for reputable list for country statuses, later labeling of countries by status (developed or developing).
Data limitations
A potential limitation of our dataset is that the same number or type of sample categories is not necessarily investigated/calculated for each country (e.g. Afghanistan accounts for 8 different sample categories while Albania only account for 6; samples for Albania are all adjusted for altitude while none are for Angola; different sets of age ranges are also sampled from from all categories). While not measured in this investigation, the dataset itself does not account for potential environmental confounding influences besides relative country status that may affect any potential differences in hemoglobin deficiencies across countries, making it difficult to isolate specific causal factors affecting anemia prevalence. We decided that we could just filter out certain data for uniformity.
In addition, as noted by the authors of the original WHO dataset report, processes that might have influenced what data was observed and recorded and what was not included: “The main limitation of our analysis is that despite the extensive data search and access, there were considerable gaps in data availability. As a result, the estimates may not capture the full variation across countries and regions, tending to”shrink” towards global means when data are sparse. This may have especially affected the estimates in high-income and upper-middle-income countries, where anemia prevalence is low and typically addressed in a clinical setting.
Another limitation is that our current dataset does not include a column for the status of the countries which we will be analyzing according to our research question. We are currently in the process of finding a reputable list of the status of countries.
Exploratory data analysis
Perform an (initial) exploratory data analysis.
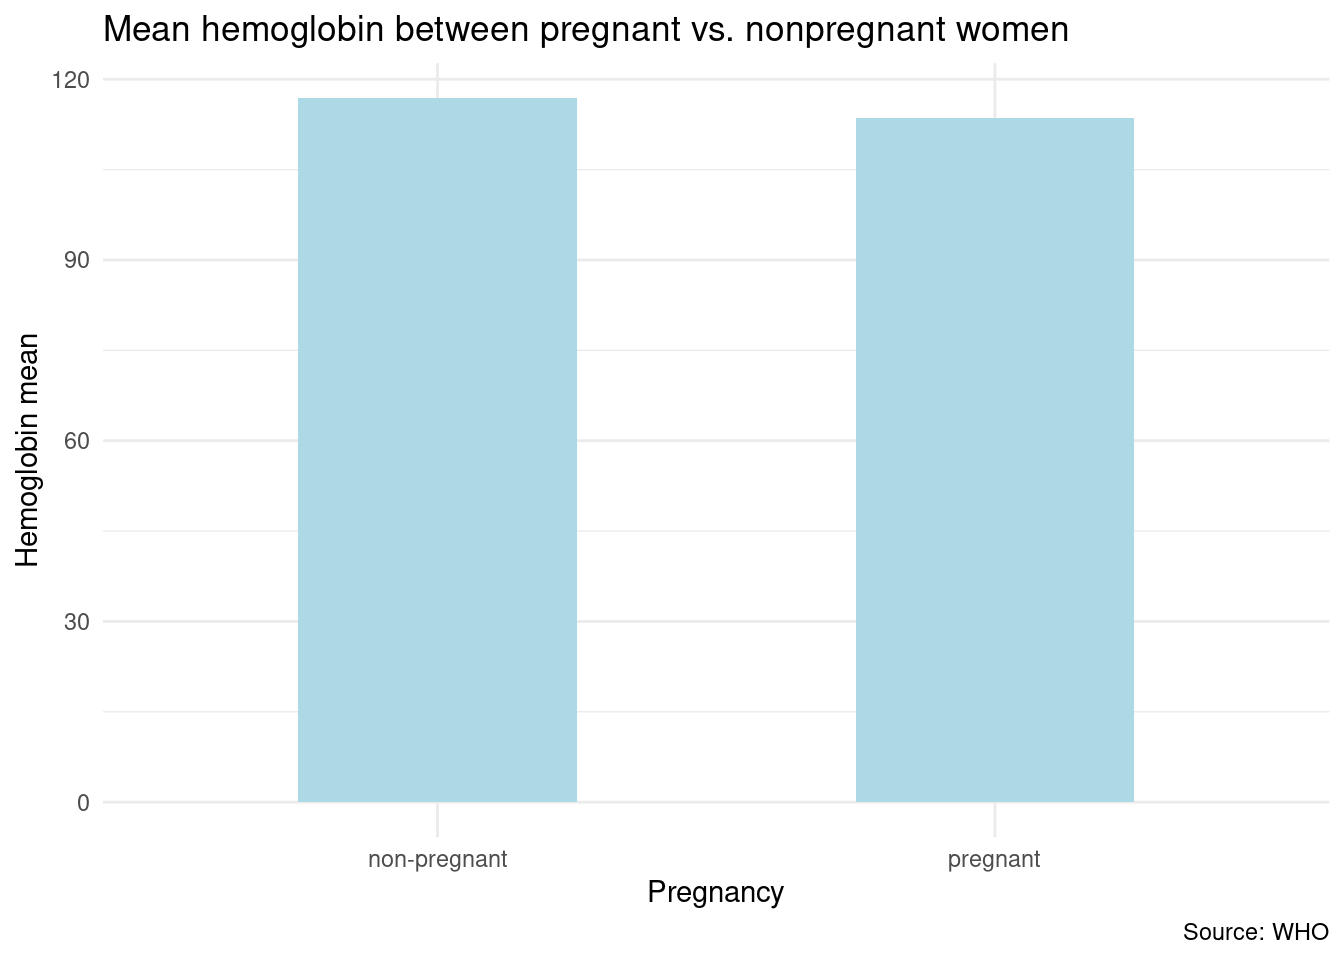
#analyzing the mean hemoglobin between pregnant vs. nonpregnant womenpreg_hemo_analysis <- anaemia_estimates_inputdata_final |>select(mean, pregnancy) |>filter(pregnancy !="all women") |>group_by(pregnancy) |>summarize(hemoglobin_mean =mean(mean, na.rm =TRUE))preg_hemo_analysis
#bar visualization of analysispreg_hemo_analysis |>ggplot(aes(x = pregnancy, y = hemoglobin_mean)) +geom_bar(stat ="identity",width =0.5,fill ="lightblue") +theme_minimal() +labs(title ="Mean hemoglobin between pregnant vs. nonpregnant women",x ="Pregnancy",y ="Hemoglobin mean",caption ="Source: WHO" )
#analyzing age range and mean hemoglobinage_hemo_analysis <- anaemia_estimates_inputdata_final |>select(agerange, mean) |>group_by(agerange) |>summarize(hemoglobin_mean =mean(mean, na.rm =TRUE)) |>filter(hemoglobin_mean !="NaN")age_hemo_analysis