Project Fabulous Buneary

Exploratory data analysis

Research question(s)

Research question(s). State your research question (s) clearly.

Research Questions (modified since proposal submission):

  1. Is there a relationship between a player’s Game Score, which is a summary measure of a player’s overall contribution to a game, and their likelihood of making a buzzer-beater shot in NBA/BAA history?
  2. What is the average distance from the basket for game-winning buzzer-beater shots?
  3. What is the average number of minutes played in a game for players who score a buzzer-beater shot?
  4. How has the frequency of game-winning buzzer beater shots changed from year to year?
  5. What factors are associated with successful game-winning buzzer-beater shots in NBA/BAA history, and how do these factors vary?

Hypotheses:

  • Players who have made more steals, blocks, and assists (as summarized and weighted by the Game Score) throughout the game are most likely to be the people who score the buzzer-beating, game-winning shot.

  • During some years, there are outside factors like COVID or a dominant team (further, scores in games with these teams are not even close, so why try to make the shot) that makes buzzer-beating shots less desirable.

  • The average player who makes the buzzer-beating shot has played for more than 30 minutes

Data collection and cleaning

Have an initial draft of your data cleaning appendix. Document every step that takes your raw data file(s) and turns it into the analysis-ready data set that you would submit with your final project. Include text narrative describing your data collection (downloading, scraping, surveys, etc) and any additional data curation/cleaning (merging data frames, filtering, transformations of variables, etc). Include code for data curation/cleaning, but not collection.

The website gives us various forms of the dataset, allowing us to choose between different formats, such as Excel workbook or CSV. We settled on using the data formatted as a CSV since it is the format we are the most comfortable with using. The website does not automatically download the data as a file, rather it produces a long string of text representing the data in the CSV format. From this you can copy the data.

Through my command line interface (terminal) I created a CSV file and edited this file using VIM. After pasting the copied data from the website, I opened this CSV file in Excel. We could see that there were unnecessary empty rows or empty columns that held no real data and were present for only formatting. These were easily removed using Excel as we predicted trying to read that CSV file with R may have raised errors / issues.

There were also rows in the dataset that indicated the start / end of each basketball season that would affect our analysis therefore those were also removed. We noticed that our research questions did not rely on exact seasons therefore changing our dataset to include this information was not necessary as each row does include the date of the game which allows us to visualize a timeline for these games if needed in the future.

Our dataset includes NA values because a lot of our variables are numerical values, therefore it would be hard and unnecessary to assign numerical values to NA as they would start to misrepresent the data. For instance, lets consider an example where a player who made a buzzer beater shot does not have data about how many free throws they made that game. We can not assume that value is zero because it could be possible that the player did make free throws but that data was unable to be recorded.

There are player names that include special characters due to the formatting on the website, there is a trend that these characters came after a space after the player’s last name therefore we could split by the space and remove those characters. Similarly there is a ‘p’ after the date of a Game if that game was a playoff game that we can remove in a similar fashion. The Margin column is represented mostly by numbers except when the game was tied before the buzzer beater shot. Therefore we can replace each instance of “tied” with the numerical value 0. Similarly for Distance we can replace “At Rim” with 0.

library(tidyverse)
── Attaching packages ─────────────────────────────────────── tidyverse 1.3.2 ──
✔ ggplot2 3.4.0     ✔ purrr   1.0.0
✔ tibble  3.2.1     ✔ dplyr   1.1.2
✔ tidyr   1.2.1     ✔ stringr 1.5.0
✔ readr   2.1.3     ✔ forcats 0.5.2
── Conflicts ────────────────────────────────────────── tidyverse_conflicts() ──
✖ dplyr::filter() masks stats::filter()
✖ dplyr::lag()    masks stats::lag()
buzzer_beaters <- read.csv("data/buzzerBeater/game-winning-buzzer-beaters.csv")

#remove special characters from Player
buzzer_beaters <- buzzer_beaters |>
  separate(col = Player, sep = "\\(", c("Player"), extra = "drop") |>
  mutate(Player = trimws(Player, which = "both"))

#remove extra characters from Game
buzzer_beaters <- buzzer_beaters |>
  separate(col = Game, sep = "\\sp", c("Game"), extra = "drop") |>
  mutate(Game = trimws(Game, which = "both"))

buzzer_beaters <- buzzer_beaters |> 
  mutate(Margin = replace(Margin, Margin == "tied", "0"),
         Distance = replace(Distance, Distance == "At Rim", "0"),
         Margin = as.numeric(Margin), 
         Distance = as.numeric(Distance))

glimpse(buzzer_beaters)
Rows: 822
Columns: 24
$ Player   <chr> "Daniel Gafford", "Trae Young  ", "Wendell Carter Jr.", "Sadd…
$ Game     <chr> "Mar 7 2023", "Feb 26 2023", "Feb 23 2023", "Jan 4 2023", "Ja…
$ Team     <chr> "WAS", "ATL", "ORL", "DET", "GSW", "MIA", "CHI", "OKC", "BRK"…
$ Opp      <chr> "DET", "BRK", "DET", "GSW", "ATL", "UTA", "ATL", "POR", "TOR"…
$ Margin   <dbl> 0, 0, 0, 0, 0, 0, 0, 0, 0, -1, -2, 0, 0, 0, 0, -1, -1, -2, -1…
$ Type     <chr> "2-pt FG", "2-pt FG", "2-pt FG", "3-pt FG", "2-pt FG", "3-pt …
$ Assisted <chr> "unassisted", "unassisted", "unassisted", "K. Hayes", "unassi…
$ Distance <dbl> 0, 12, 0, 28, 0, 25, 0, 14, 27, 6, 25, 1, 23, 31, 13, 0, 26, …
$ MP       <chr> "24:38:00", "33:48:00", "31:46:00", "28:46:00", "32:25:00", "…
$ PTS      <int> 8, 34, 14, 17, 14, 29, 9, 35, 32, 17, 12, 17, 12, 37, 30, 31,…
$ FG       <int> 4, 12, 5, 6, 4, 10, 4, 10, 13, 7, 4, 8, 3, 14, 10, 9, 6, 11, …
$ FGA      <int> 5, 26, 13, 17, 8, 20, 6, 24, 22, 17, 8, 15, 5, 24, 17, 18, 14…
$ FG.      <dbl> 0.800, 0.462, 0.385, 0.353, 0.500, 0.500, 0.667, 0.417, 0.591…
$ X3P      <int> 0, 1, 0, 4, 0, 3, 1, 1, 3, 2, 4, 1, 1, 2, 1, 3, 2, 9, 4, 2, 4…
$ X3PA     <int> 0, 5, 3, 10, 0, 11, 3, 1, 9, 11, 7, 6, 3, 7, 3, 7, 6, 12, 5, …
$ X3P.     <dbl> NA, 0.200, 0.000, 0.400, NA, 0.273, 0.333, 1.000, 0.333, 0.18…
$ FT       <int> 0, 9, 4, 1, 6, 6, 0, 14, 3, 1, 0, 0, 5, 7, 9, 10, 8, 7, 2, 3,…
$ FTA      <int> 0, 9, 6, 1, 8, 7, 0, 14, 3, 1, 0, 0, 7, 7, 11, 12, 8, 8, 2, 3…
$ FT.      <dbl> NA, 1.000, 0.667, 1.000, 0.750, 0.857, NA, 1.000, 1.000, 1.00…
$ TRB      <int> 7, 3, 14, 3, 20, 9, 3, 2, 3, 2, 4, 5, 9, 5, 2, 4, 4, 2, 8, 4,…
$ AST      <int> 1, 8, 2, 1, 4, 6, 2, 6, 5, 2, 1, 1, 8, 3, 5, 8, 3, 0, 3, 6, 1…
$ STL      <int> 1, 2, 1, 2, 0, 2, 2, 1, 0, 0, 1, 1, 2, 1, 0, 1, 3, 1, 2, 0, 1…
$ BLK      <int> 1, 0, 2, 0, 1, 0, 0, 2, 0, 1, 2, 1, 0, 0, 1, 2, 0, 0, 0, 0, 1…
$ GmSc     <dbl> 7.8, 24.7, 14.3, 11.1, 21.1, 20.9, 9.3, 26.6, 24.0, 8.8, 9.1,…
write_rds(x = buzzer_beaters, file = "data/buzzer-beaters.rds")

Data description

Motivation:

  • Why was this dataset created?

    • This dataset was created to aggregate, for the first time in a single dataset, data on all NBA games decided by game-winning buzzer-beater shots in a single place.
  • Who funded the creation of the dataset and who created it?

    • The creation of this dataset was undertaken and funded by https://www.basketball-reference.com/ whose goal is to create and publicize factual data about professional basketball games and players.

Composition:

  • What are the observations (rows) and the attributes (columns)?

    • This dataset contains an entry for each player who made a game-winning buzzer-beater shot in NBA history. There are players with multiple entries in the dataset, since some players have won multiple games for their teams this way. The attributes of the dataset include the players’ names and teams, the date of the game, and various game-level statistics about the players. These statistics include, but are not limited to, minutes played, field goals, field goal attempts, assists, steals, blocks, and game score (a standard statistic aggregating an individual players’ performance in a single game based on a variety of factors).
  • How many observations are in the dataset

    • There are 820 entries in the dataset, dating back to December 10, 1946 and coming from as recently as March 17, 2023
  • Is the data a sample of a larger population?

    • This data represents a sample of the larger population of all NBA games, since the entries in it represent only games won by buzzer-beater shots.
  • Are there null values in the dataset?

    • The dataset does contain sporadic null values. The only column that frequently has null values is the free throw percent column, though this is not an issue since there is mostly complete data for the free throw and free throw attempts column, which can be used to calculate the percent of successful free throws, should that data for a row be missing. However, in the years before 1979 when game reporting was less reliable than it is today, data about 3 point field goals was not recorded, and data for steals, blocks, and game score was also not reported consistently.

Collection process:

  • How was the data collected and where was it collected from?

    • This data was collected very carefully to make sure that it is both accurate and complete. The creators reviewed play-by-plays and other available footage of past NBA games going back for many decades looking for games that fit the criteria of the dataset. For games where footage was not available, as well as for games where it was as a way of validating their collection process, the creators read thousands of stories about old games in newspaper archives to see how the games’ endings were reported in the press.
  • If people are involved, were they aware of the data collection and if so, what purpose did they expect the data to be used for?

    • The data pertains to NBA players who have made game-winning buzzer-beater shots. Considering that these players are professional athletes, they would certainly expect their stats to be recorded and made publicly available as is customary with all sports. They would also expect this data to be analyzed to ascertain trends of interest within it.
  • What processes might have influenced what data was observed and recorded and what was not?

    • The process by which game statistics were recorded in the past, as well as how that data was preserved, is the largest influence on which variables were included in this dataset. The creators note that much of the missing data (null values) are the result of incomplete or unreliable records. It is likely that they only included variables where most of the statistics they reported are known, and left out others from the final published dataset that were mostly unknown.

Pre-processing/cleaning/labeling:

  • What preprocessing was done, and how did the data come to be in the form that you are using?

    • We were able to extract the data in the form of a raw csv text string that was then imported into Excel. We removed unnecessary rows throughout the data containing labels such as the season each game occurred in, as well as frequent relabels of the variables at intervals throughout the dataset. We figured that leaving these rows in the data would cause problems when trying to analyze the data in R. Finally, we standardized the format of the data within each column by removing any special characters in player names, removing the ‘p’s from the ends of the dates of playoff games, and changing the ’tied’ values in the margin column representing games that were tied before the final buzzer-beater shot was thrown to 0, since this should be a numeric column. *In the final report, we will merge together this summary with the more complete explanation in the data collection and cleaning section.*
  • How will missing values be handled?

    • We decided not to drop any rows with missing values during the preprocessing phase since rows with missing data in some columns may contain data in others that are relevant to specific analyses. For each analysis we conduct, we will begin with the preprocessed data and drop rows with missing data in columns relevant to that analysis before beginning it.
  • Was the raw data saved and how can it be found?

Uses:

  • What other tasks could the dataset be used for?

    • There are many analyses aside from the ones in this project that this dataset can be useful for, particularly when combined with other similar datasets. For example, if combined with a dataset containing information about all NBA games, not just those decided by a buzzer-beater shot, one could ask many questions. For example, are certain teams more likely to attempt a buzzer-beater shot than others, and have teams who have more attempts than others been more successful at making them than those that attempt them less often? Any research project that deals with NBA games decided by buzzer-beater shots can make use of this dataset.
  • Is there anything about the dataset that future users should know?

    • Future users of this dataset should be aware of the many missing values within it, particularly in games before 1979. Considering that many of these missing values deal with player statistics (shots blocked in a single game, for example), it is not feasible to fill in these null values, since a lack of data does not indicate a 0. Instead, missing values are the result of faulty game records.
  • What should the data not be used for?

    • This data should not be used for general analyses of NBA games or players, since it only contains a subset of games from the larger population of all games. This sample is also not representative of the larger population as it was not collected randomly, and thus should be used cautiously when trying to make general conclusions about the NBA not relevant to games decided by buzzer-beaters.

Data limitations

A limitation is that the dataset does not include any unsuccessful buzzer-beater shots, making it difficult to analyze success rates for a player, team, game, or year. Therefore, it is important to keep this in mind when analyzing trends in the dataset, in order for us to not draw conclusions not supported by the data as we only know about the successful buzzer beater shots and thus cannot draw conclusions about overall ratios.

Additionally, another limitation is that the dataset does not contain some of the information for games before 1979, specifically related to 3-point field goals. Thus, we would need to keep this in mind when analyzing our questions related to this in order to make sure we are consistent with the data we have.

Exploratory data analysis

Perform an (initial) exploratory data analysis. In this section, we conduct an exploratory analyses on each of our (modified) research questions.

# add code here
library(tidyverse)
library(skimr)
library(scales)

Attaching package: 'scales'
The following object is masked from 'package:purrr':

    discard
The following object is masked from 'package:readr':

    col_factor
# Importing data
buzzer_beaters <- read_rds("data/buzzer-beaters.rds")

# Histogram of Game Score
ggplot(buzzer_beaters, aes(x = GmSc)) +
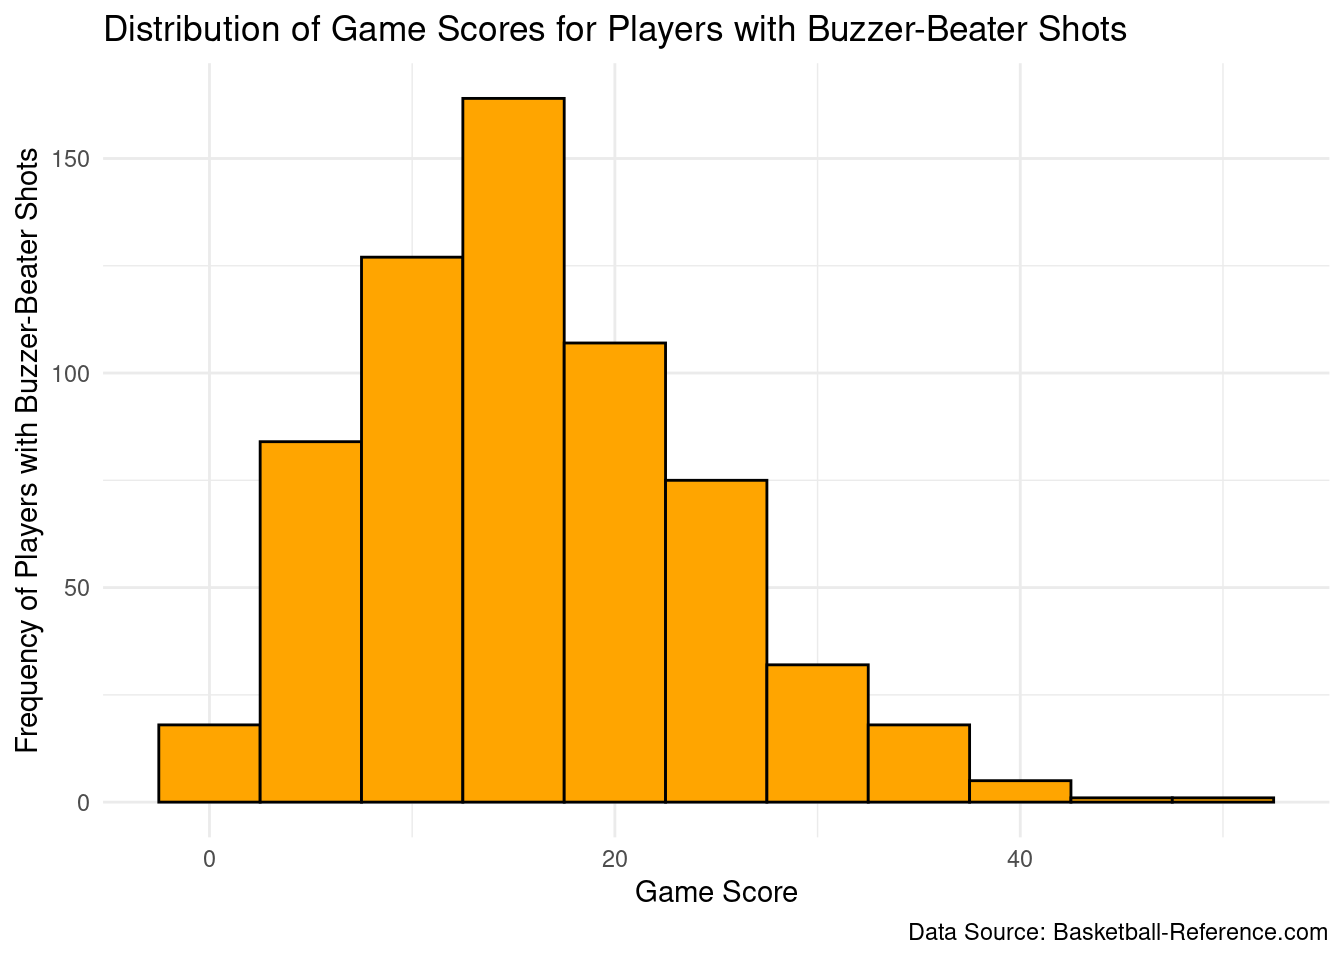
  geom_histogram(binwidth = 5, color = "black", fill = "orange") +
  scale_x_continuous(breaks = seq(0, max(buzzer_beaters$GmSc, na.rm = TRUE), 20)) +
  scale_y_continuous(labels = comma) +
  labs(x = "Game Score", 
       y = "Frequency of Players with Buzzer-Beater Shots", 
       title = "Distribution of Game Scores for Players with Buzzer-Beater Shots",
       caption = "Data Source: Basketball-Reference.com"
       ) +
  theme_minimal()
Warning: Removed 190 rows containing non-finite values (`stat_bin()`).

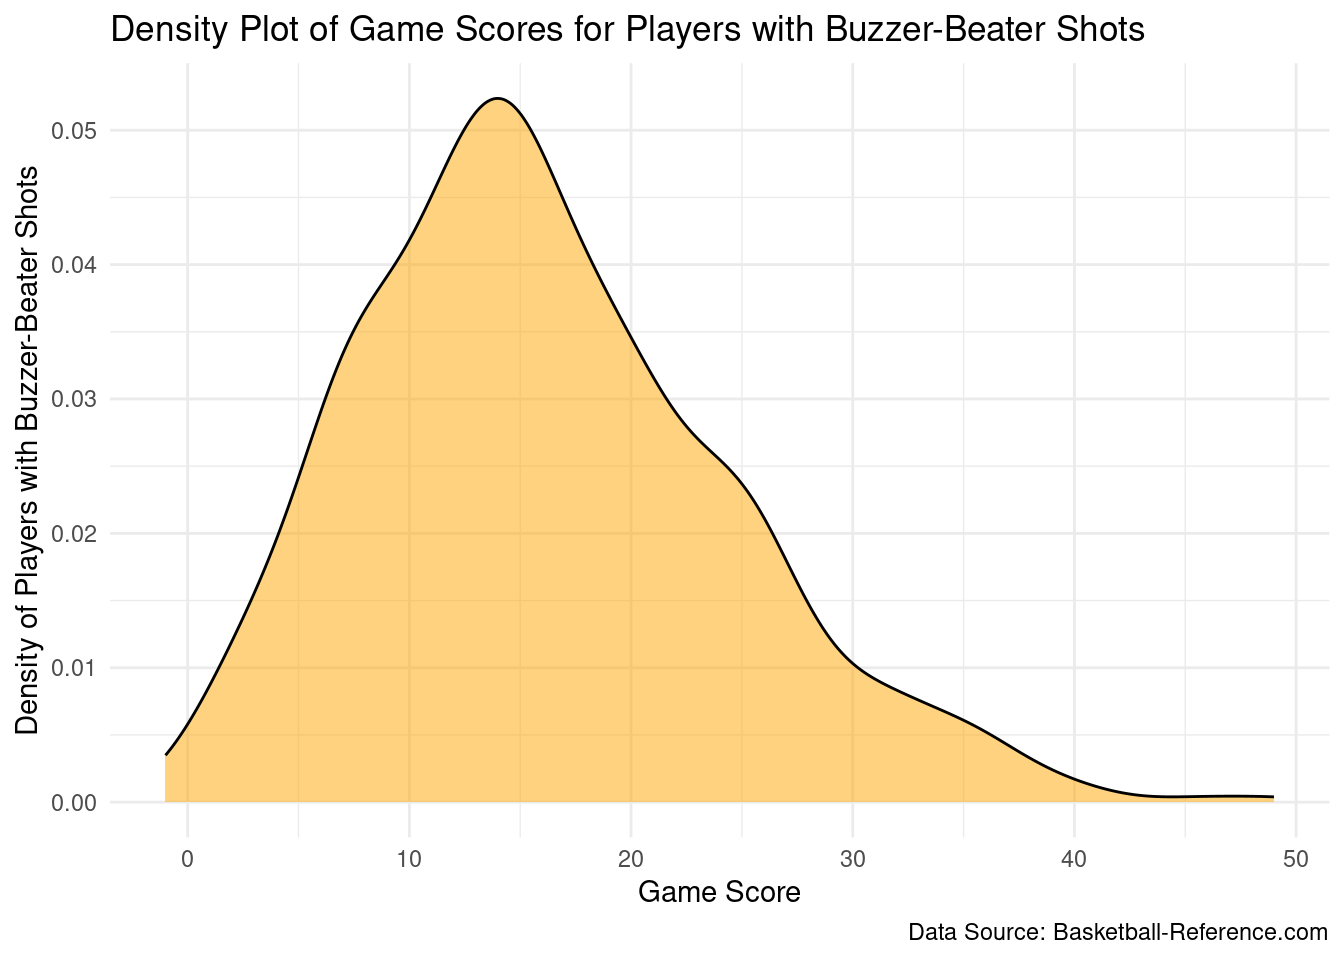
# Density plot of Game Score
ggplot(buzzer_beaters, aes(x = GmSc)) +
  geom_density(color = "black", fill = "orange", alpha = 0.5) +
  labs(
       x = "Game Score", 
       y = "Density of Players with Buzzer-Beater Shots", 
       title = "Density Plot of Game Scores for Players with Buzzer-Beater Shots",
       caption = "Data Source: Basketball-Reference.com"
      ) +
  theme_minimal()
Warning: Removed 190 rows containing non-finite values (`stat_density()`).

Description: The two graphs depict the distribution of game scores for NBA players who have made buzzer-beater shots. According to the histogram, the most common game score range for players who make buzzer-beaters is between 10 and 20. The density plot confirms this and provides additional information about the skewness of the data. The peak of the density curve is around 15, indicating that this is the most common game score among buzzer-beater makers. The right-skewness of the data is also visible in the long tail to the right of the peak, indicating that there are more high-scoring buzzer-beater makers than low-scoring ones.

# add code here
library(tidyverse)

buzzer_beaters <- read_rds("data/buzzer-beaters.rds")

# Calculating mean distance
mean_distance <- buzzer_beaters |>
  summarize(mean_distance = mean(Distance, na.rm = TRUE))

# Creating a box plot of distance
ggplot(buzzer_beaters, aes(x = "", y = Distance)) +
  geom_boxplot(fill = "orange", color = "black") +
  labs(
      title = "Distribution of Distance for Game-Winning Buzzer-Beater Shots",
       y = "Distance from the Basket (feet)",
       x = "",
      caption = "Data Source: Basketball-Reference.com"
       ) +
  theme_minimal()
Warning: Removed 49 rows containing non-finite values (`stat_boxplot()`).

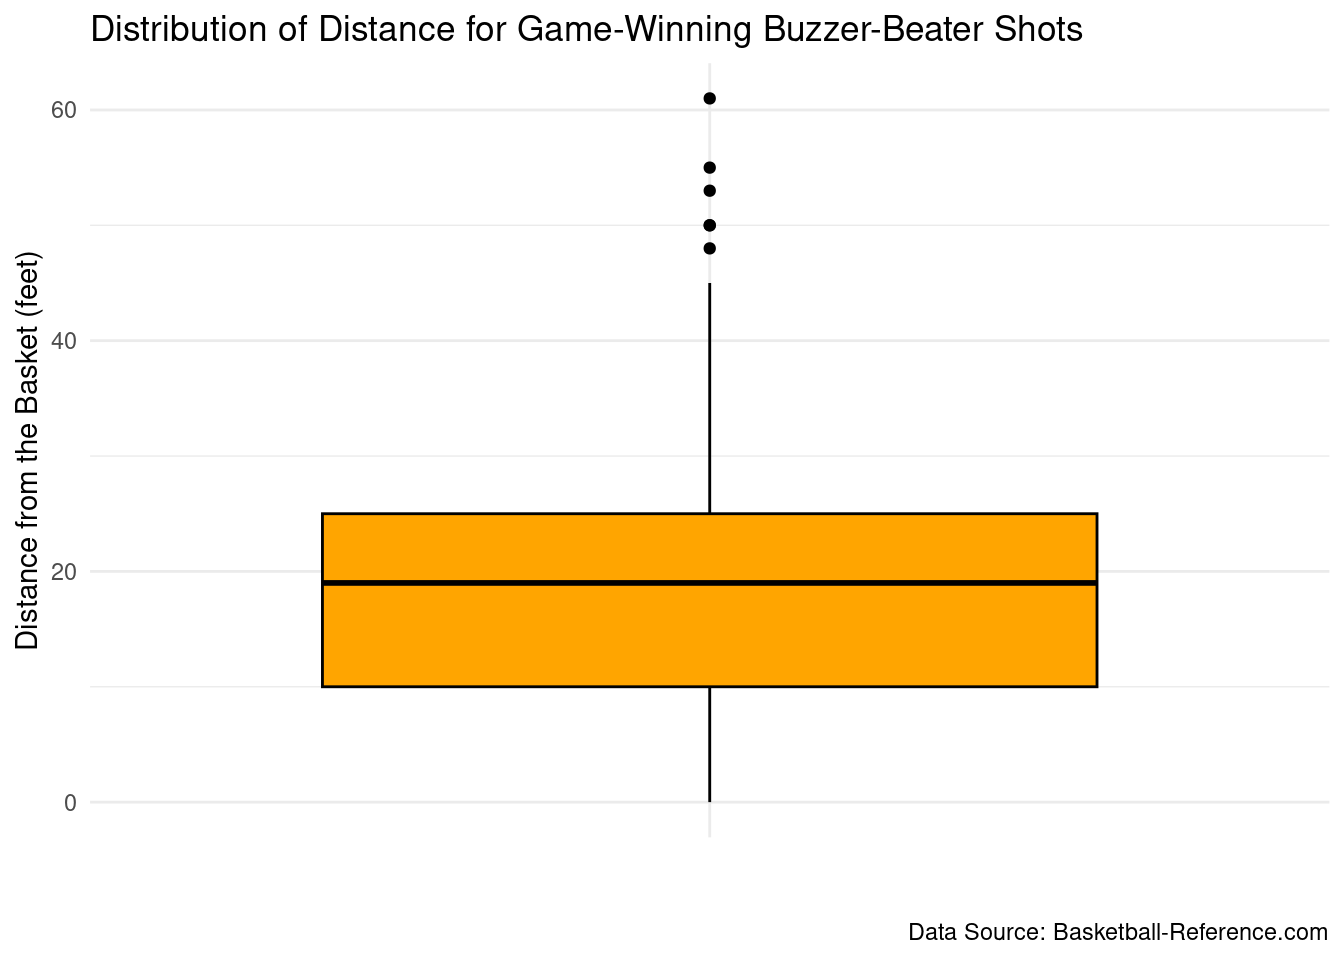
Description: The box plot reveals that the median distance for game-winning buzzer-beater shots is approximately 19 feet, with the majority of shots falling within a range of 10 to 22 feet from the basket. This suggests that players are more likely to be successful when shooting from within this range. However, the plot also shows the presence of a few outliers, indicating that there are some players who have successfully made these shots from much greater distances. Despite these outliers, the relatively narrow spread of distances suggests that players may have a certain preferred distance from which they are most likely to make these types of shots.

library(tidyverse)

buzzer_beaters <- read_rds("data/buzzer-beaters.rds")

# Splitting the MP column into minutes and seconds
buzzer_beaters <- buzzer_beaters |>
  separate(MP, c("minutes", "seconds"), sep = ":", convert = TRUE)
Warning: Expected 2 pieces. Additional pieces discarded in 694 rows [1, 2, 3, 4,
5, 6, 7, 8, 9, 10, 11, 12, 13, 14, 15, 16, 17, 18, 19, 20, ...].
Warning: Expected 2 pieces. Missing pieces filled with `NA` in 61 rows [696,
707, 724, 728, 748, 752, 755, 757, 758, 759, 760, 762, 763, 764, 765, 767, 768,
769, 771, 772, ...].
avg_minutes <- buzzer_beaters |>
  group_by(Player) |>
  summarize(avg_minutes = mean(minutes + seconds/60))

# Creating a histogram of the average minutes played
ggplot(avg_minutes, aes(x = avg_minutes)) +
  geom_histogram(fill = "orange", color = "black", bins = 30) +
  labs(
      title = "Distribution of Average Minutes Played for Buzzer-Beater Scorers",
       x = "Average Minutes Played in Game",
       y = "Frequency",
       caption = "Data Source: Basketball-Reference.com"
      ) +
  theme_minimal()
Warning: Removed 46 rows containing non-finite values (`stat_bin()`).

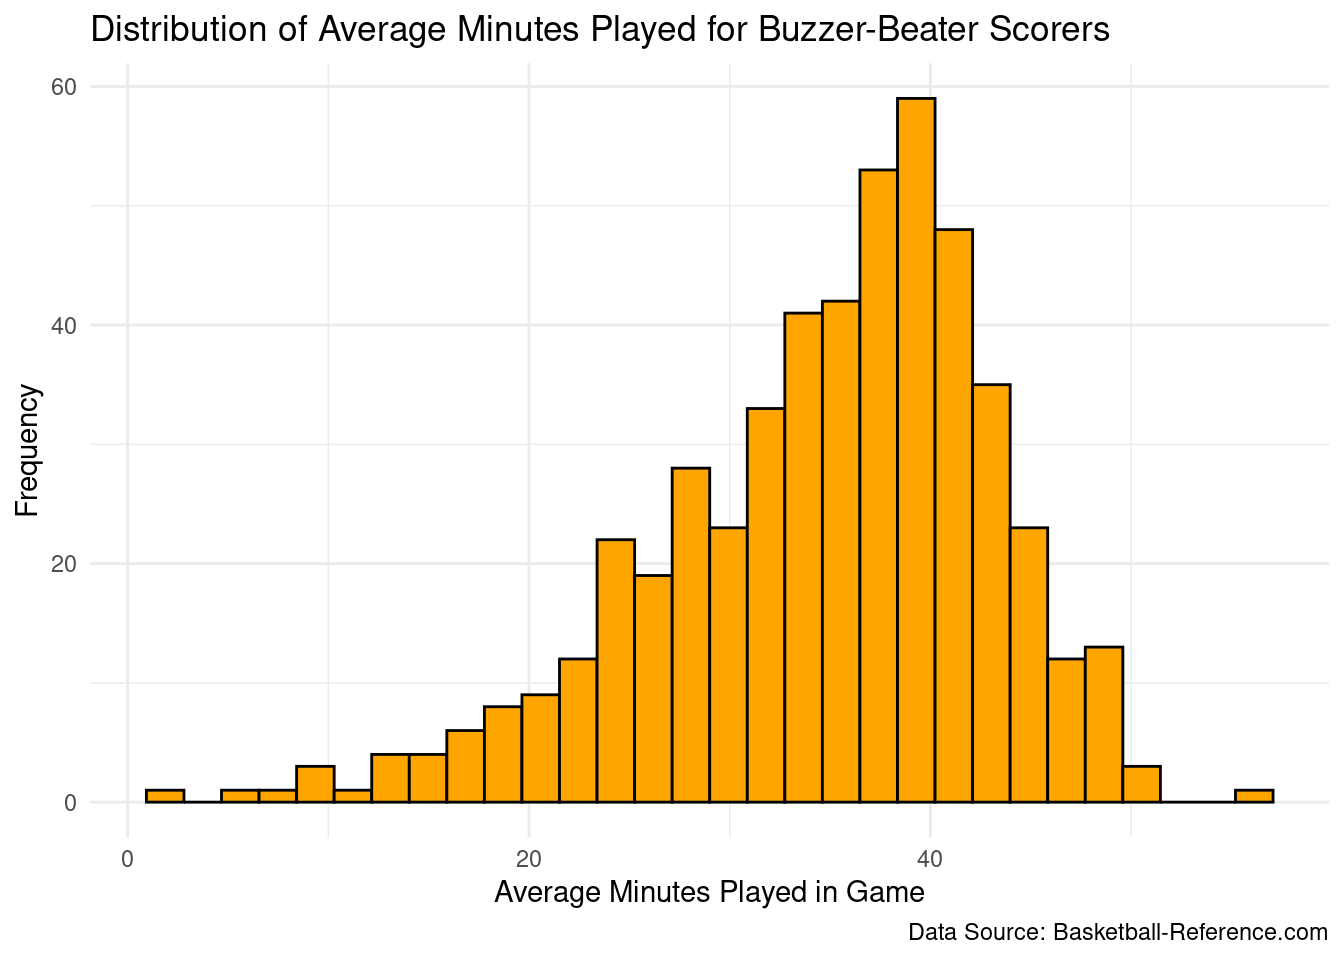
Description: This histogram displays the distribution of the average number of minutes played in a game for players who have scored a buzzer-beater shot. The x-axis represents the average minutes played while the y-axis shows the frequency of players. The frequency of players increases starting at 30 minutes and gradually decreases after 40 minutes, with the peak of the distribution at an average of 40 minutes played. This suggests that most buzzer-beater scorers are likely starters or key players on their teams who are given significant playing time. The histogram reveals a left-skewed distribution, indicating there may be some players who have much lower average playing times, potentially indicating that they might be specialist players brought in specifically for their shooting abilities when needed. Overall, this histogram provides insight into the typical playing time for players who make buzzer-beater shots in basketball games.

library(tidyverse)

buzzer_beaters <- read_rds("data/buzzer-beaters.rds")

# Extracting the year from the "game" variable
buzzer_beaters <- buzzer_beaters |>
  mutate(year = str_sub(Game, -4) |> as.integer())

# Counting the number of buzzer-beaters by year
buzzer_counts <- buzzer_beaters |>
  group_by(year) |>
  summarize(count = n())

# Creating a line graph of buzzer-beaters by year
ggplot(buzzer_counts, aes(x = year, y = count)) +
  geom_line(color = "orange") +
  labs(title = "Frequency of Game-Winning Buzzer-Beaters in NBA/BAA History",
       subtitle = "Number of Buzzer-Beaters Made Per Year",
       x = "Year",
       y = "Number of Buzzer-Beaters",
       caption = "Data Source: Basketball-Reference.com"
       ) +
  theme_minimal()
Warning: Removed 1 row containing missing values (`geom_line()`).

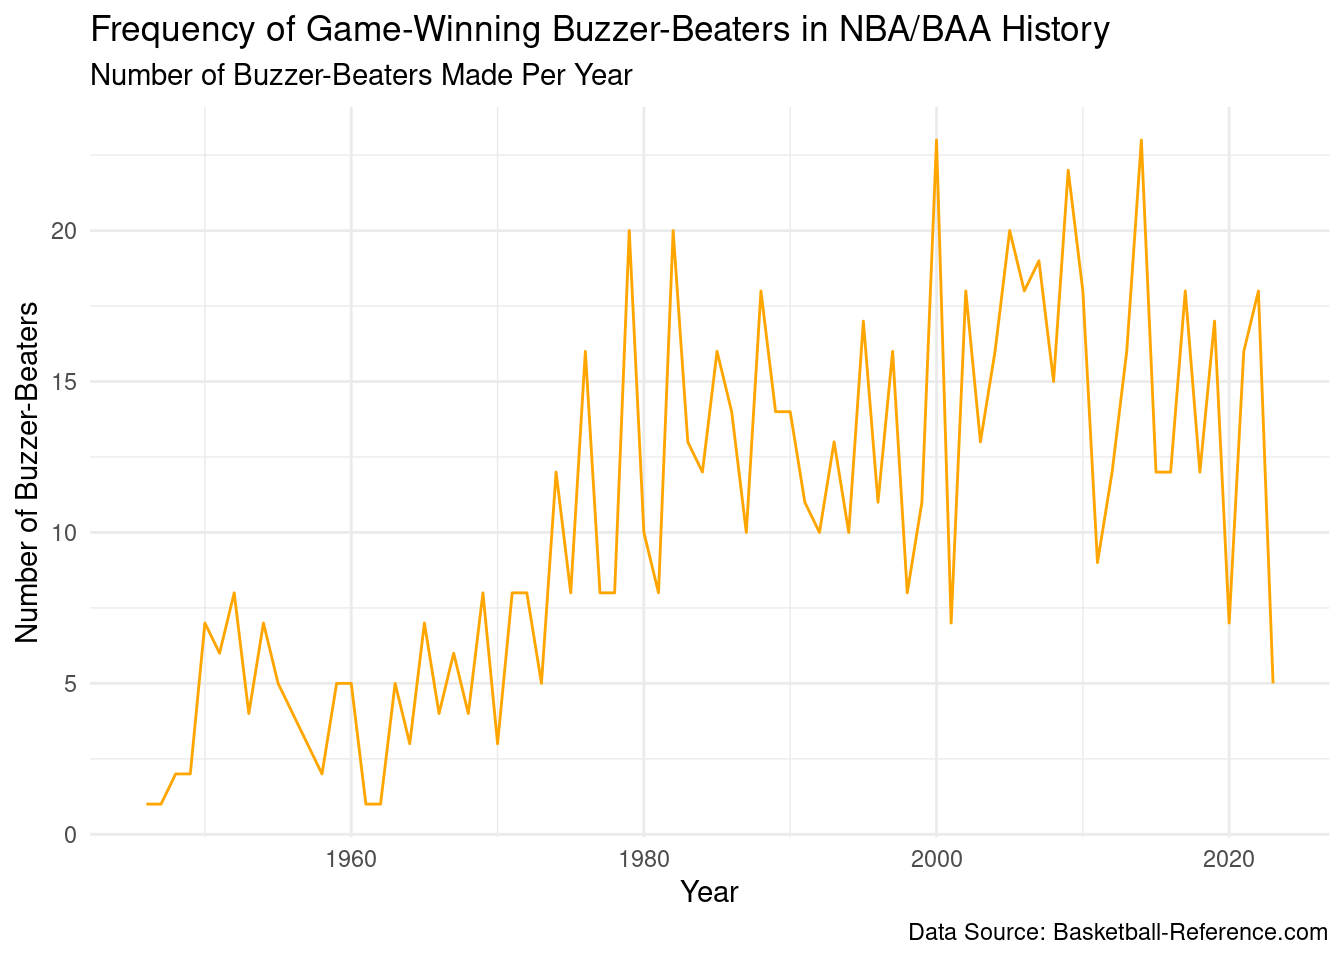
Description: The line graph depicts the frequency of buzzer-beater shots in basketball from 1946 to 2022. From the 1940s to around 1980, there was an overall increase in buzzer-beater shots, with minor fluctuations year to year. This increase could be attributed to a number of factors, including changes in defensive strategies, improvements in players’ shooting abilities, or changes in game rules. The frequency of buzzer-beater shots remained relatively stable from the 1980s to the early 2000s, with occasional peaks and valleys. However, the frequency of buzzer-beater shots increased significantly around the year 2000, possibly as a result of the NBA’s influx of talented players and teams. This trend continued until around 2010, when the number of buzzer-beater shots began to decline, with occasional fluctuations. Notably, some of the league’s most talented players, including Stephen Curry, James Harden, and Damian Lillard, had incredible buzzer-beater moments in 2015. Their abilities and willingness to take last-second shots may have contributed to the increase in buzzer-beater shots that year. Overall, the line chart indicates that the frequency of buzzer-beater shots in basketball has fluctuated over time and may not be a factor in the number of Buzzer-Beater shots made. Surprisingly, the Covid pandemic did not seem to have much of an effect either.

library(tidymodels)
── Attaching packages ────────────────────────────────────── tidymodels 1.0.0 ──
✔ broom        1.0.2     ✔ rsample      1.1.1
✔ dials        1.1.0     ✔ tune         1.1.1
✔ infer        1.0.4     ✔ workflows    1.1.2
✔ modeldata    1.0.1     ✔ workflowsets 1.0.0
✔ parsnip      1.0.3     ✔ yardstick    1.1.0
✔ recipes      1.0.6     
── Conflicts ───────────────────────────────────────── tidymodels_conflicts() ──
✖ scales::discard() masks purrr::discard()
✖ dplyr::filter()   masks stats::filter()
✖ recipes::fixed()  masks stringr::fixed()
✖ dplyr::lag()      masks stats::lag()
✖ yardstick::spec() masks readr::spec()
✖ recipes::step()   masks stats::step()
• Learn how to get started at https://www.tidymodels.org/start/
library(ggplot2)

buzzer_beaters <- read_rds("data/buzzer-beaters.rds")

# Converting character variables to factors
buzzer_beaters$Player <- as.factor(buzzer_beaters$Player)
buzzer_beaters$Opp <- as.factor(buzzer_beaters$Opp)
buzzer_beaters$Game <- as.factor(buzzer_beaters$Game)

# Creating a new column called Assist
buzzer_beaters <- buzzer_beaters |>
  mutate(Assist = ifelse(Assisted != "unassisted", "Yes", "No"))

# Extracting the year from the "Game" variable
buzzer_beaters <- buzzer_beaters |>
  mutate(year = str_sub(Game, -4) |> as.integer())

# Creating scatterplot and regression line
ggplot(buzzer_beaters, aes(x = GmSc, y = Distance, color = Assist)) +
  geom_point() +
  geom_smooth(method = "lm") +
  labs(x = "Player Game Score", 
       y = "Distance from the Basket (feet)", 
       color = "Assist",
       title = "Factors to Game-Winning Buzzer-Beater Shots in NBA/BAA History",
       subtitle = 
         "Role of Player Game Score and Assist for Buzzer-Beater Shots at Varying Distances",
       caption = "Data Source: Basketball-Reference.com") +
  scale_color_manual(values = c("#E03A3E", "#007A33"))
`geom_smooth()` using formula = 'y ~ x'
Warning: Removed 205 rows containing non-finite values (`stat_smooth()`).
Warning: Removed 205 rows containing missing values (`geom_point()`).

# Performing linear regression analysis
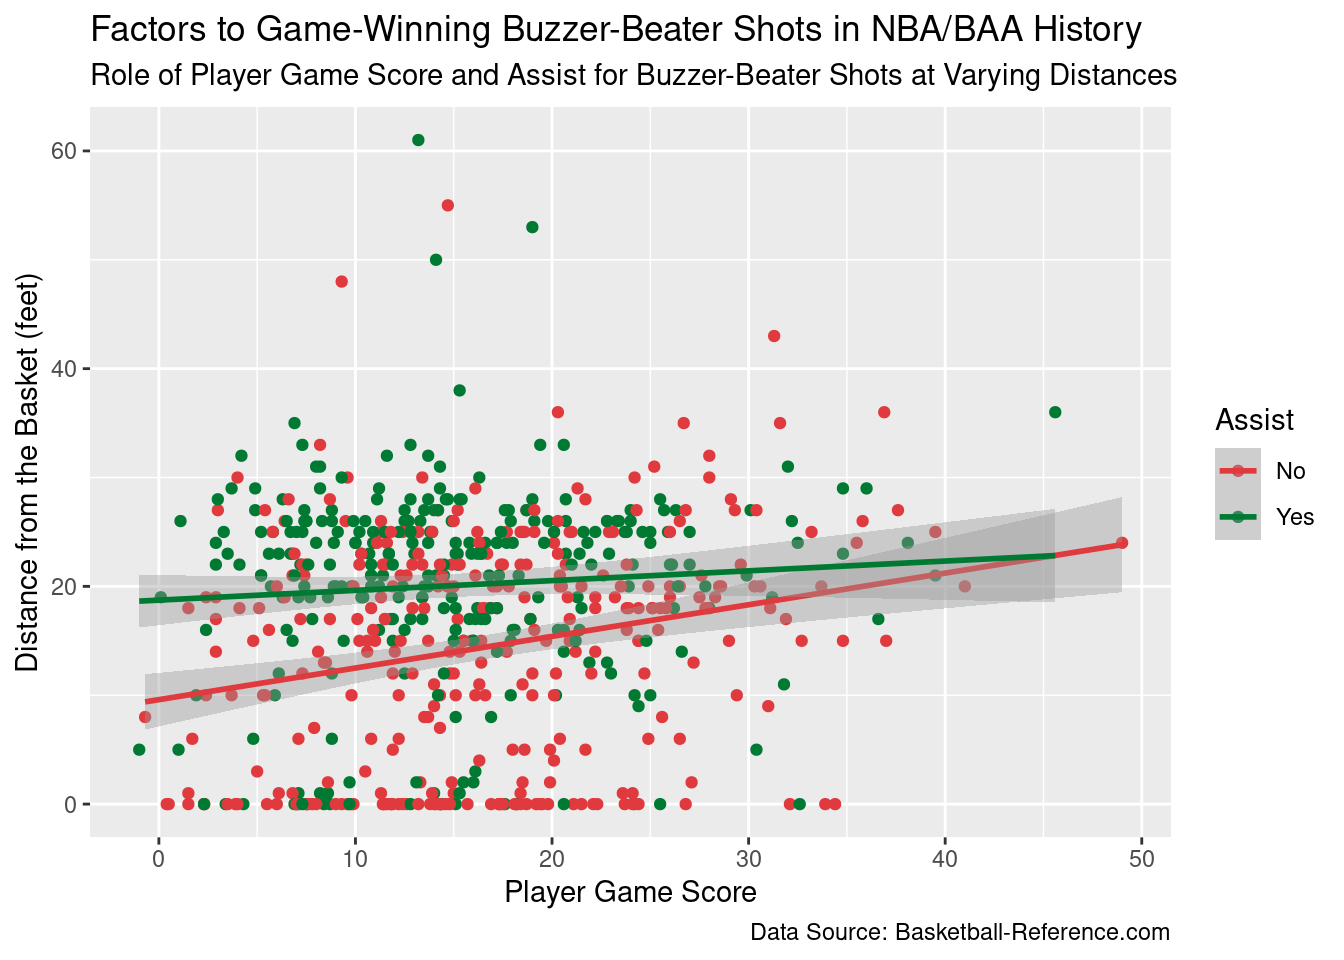
model <- lm(Distance ~ GmSc * Assist, data = buzzer_beaters)

# Summarizing results
summary(model)

Call:
lm(formula = Distance ~ GmSc * Assist, data = buzzer_beaters)

Residuals:
    Min      1Q  Median      3Q     Max 
-21.662  -5.659   1.413   6.375  41.132 

Coefficients:
               Estimate Std. Error t value Pr(>|t|)    
(Intercept)     9.59583    1.19795   8.010 5.79e-15 ***
GmSc            0.29059    0.06383   4.553 6.38e-06 ***
AssistYes       9.14040    1.72070   5.312 1.52e-07 ***
GmSc:AssistYes -0.20084    0.09691  -2.072   0.0386 *  
---
Signif. codes:  0 '***' 0.001 '**' 0.01 '*' 0.05 '.' 0.1 ' ' 1

Residual standard error: 9.74 on 613 degrees of freedom
  (205 observations deleted due to missingness)
Multiple R-squared:  0.1068,    Adjusted R-squared:  0.1024 
F-statistic: 24.43 on 3 and 613 DF,  p-value: 6.101e-15

Description: In this chart, we examine how the game score and distance of game-winning buzzer-beater shots in NBA/BAA history vary and correlate with one another depending on whether the shot was assisted or unassisted. The scatterplot displays the relationship between two variables: Game Score (x-axis) and Distance (y-axis), with the points colored according to whether the shot was assisted or unassisted. The regression lines indicate the overall trend for each group and the interaction between Game Score and assisted/unassisted shots. The lines show that successful unassisted shots tend to be made from closer range compared to successful assisted shots. Moreover, the lines suggest a slightly positive relationship between Game Score and Distance, implying that players with higher Game Scores are more likely to take shots from farther away. Further investigations could explore additional factors influencing successful buzzer-beater shots.

Questions for reviewers

List specific questions for your peer reviewers and project mentor to answer in giving you feedback on this phase.

  1. Are our research questions deep enough for the entire project, assuming we use all 4 of them? We realized that with our previous dataset we forgot to note that the set is a list of every game-winning shot in NBA/BAA history that was taken with the shooter’s team tied or trailing and left no time on the clock after it went through. The new five questions take this into consideration.
  2. Are we missing any limitations in the data that we should know about?
  3. Are our hypotheses substantial enough for this project?