── Attaching packages ─────────────────────────────────────── tidyverse 1.3.2 ──
✔ tibble  3.2.1     ✔ dplyr   1.1.2
✔ tidyr   1.2.1     ✔ stringr 1.5.0
✔ readr   2.1.3     ✔ forcats 0.5.2
✔ purrr   1.0.0
── Conflicts ────────────────────────────────────────── tidyverse_conflicts() ──
✖ dplyr::filter() masks stats::filter()
✖ dplyr::lag()    masks stats::lag()
── Attaching packages ────────────────────────────────────── tidymodels 1.0.0 ──

✔ broom        1.0.2     ✔ rsample      1.1.1
✔ dials        1.1.0     ✔ tune         1.1.1
✔ infer        1.0.4     ✔ workflows    1.1.2
✔ modeldata    1.0.1     ✔ workflowsets 1.0.0
✔ parsnip      1.0.3     ✔ yardstick    1.1.0
✔ recipes      1.0.6

── Conflicts ───────────────────────────────────────── tidymodels_conflicts() ──
✖ scales::discard() masks purrr::discard()
✖ dplyr::filter()   masks stats::filter()
✖ recipes::fixed()  masks stringr::fixed()
✖ dplyr::lag()      masks stats::lag()
✖ yardstick::spec() masks readr::spec()
✖ recipes::step()   masks stats::step()
• Use tidymodels_prefer() to resolve common conflicts.Where does it pay to attend college?
How school region and school type impact salaries of graduates
Topic and motivation
Project motivation: Investigating the earning levels of graduates from different college types and regions.
Salaries at career stages: starting salary, mid-career salary.
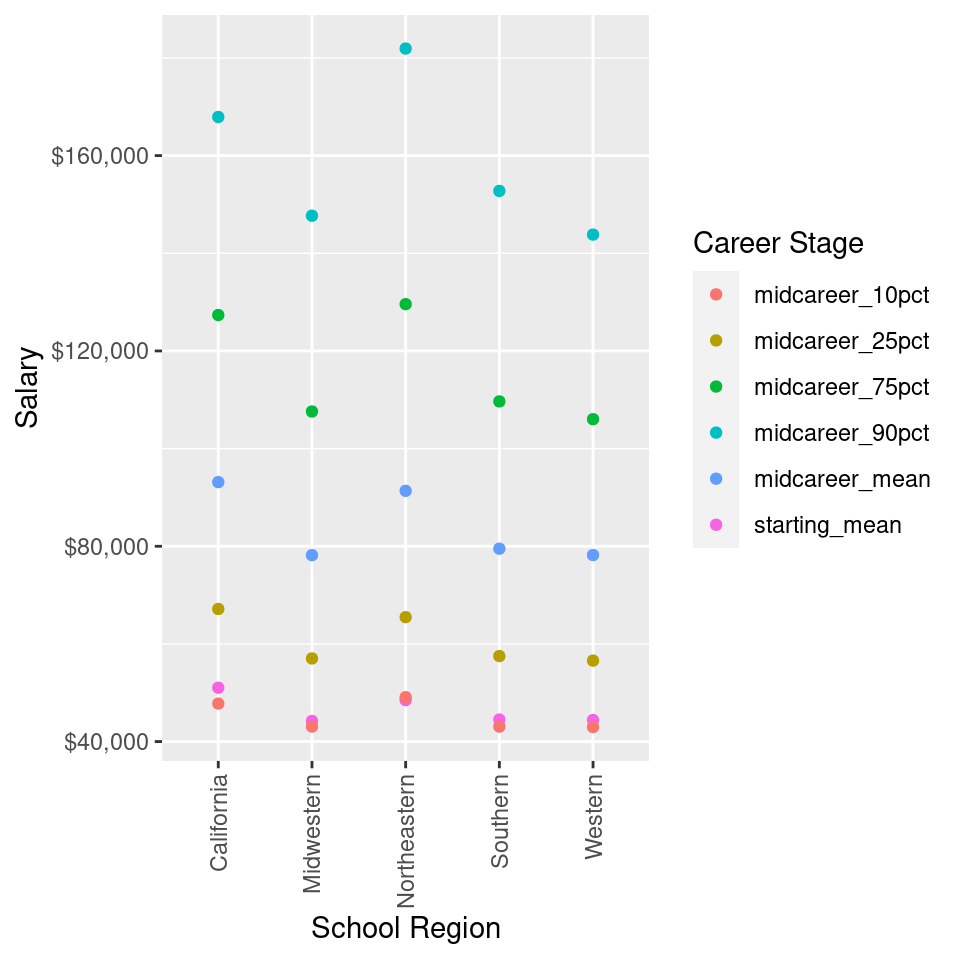
Regions: California, Midwestern, Northeastern, Southern, Western.
College Types: Engineering, Ivy League, Liberal Arts, Party, State.
Introducing the data
Data source: Wall Street Journal (obtained by Payscale, Inc.)
Dataset 1: Salary information for colleges with college region
Rows: 320
Columns: 8
$ School.Name                       <chr> "Stanford University", "California I…
$ Region                            <chr> "California", "California", "Califor…
$ Starting.Median.Salary            <chr> "$70,400.00", "$75,500.00", "$71,800…
$ Mid.Career.Median.Salary          <chr> "$129,000.00", "$123,000.00", "$122,…
$ Mid.Career.10th.Percentile.Salary <chr> "$68,400.00", "N/A", "N/A", "$59,500…
$ Mid.Career.25th.Percentile.Salary <chr> "$93,100.00", "$104,000.00", "$96,00…
$ Mid.Career.75th.Percentile.Salary <chr> "$184,000.00", "$161,000.00", "$180,…
$ Mid.Career.90th.Percentile.Salary <chr> "$257,000.00", "N/A", "N/A", "$201,0…
Dataset 2: Salary information for colleges with college type
Rows: 269
Columns: 8
$ School.Name                       <chr> "Massachusetts Institute of Technolo…
$ School.Type                       <chr> "Engineering", "Engineering", "Engin…
$ Starting.Median.Salary            <chr> "$72,200.00", "$75,500.00", "$71,800…
$ Mid.Career.Median.Salary          <chr> "$126,000.00", "$123,000.00", "$122,…
$ Mid.Career.10th.Percentile.Salary <chr> "$76,800.00", "N/A", "N/A", "$66,800…
$ Mid.Career.25th.Percentile.Salary <chr> "$99,200.00", "$104,000.00", "$96,00…
$ Mid.Career.75th.Percentile.Salary <chr> "$168,000.00", "$161,000.00", "$180,…
$ Mid.Career.90th.Percentile.Salary <chr> "$220,000.00", "N/A", "N/A", "$190,0…
Highlights from EDA
Joining with `by = join_by(School.Name, Starting.Median.Salary,
Mid.Career.Median.Salary, Mid.Career.10th.Percentile.Salary,
Mid.Career.25th.Percentile.Salary, Mid.Career.75th.Percentile.Salary,
Mid.Career.90th.Percentile.Salary)`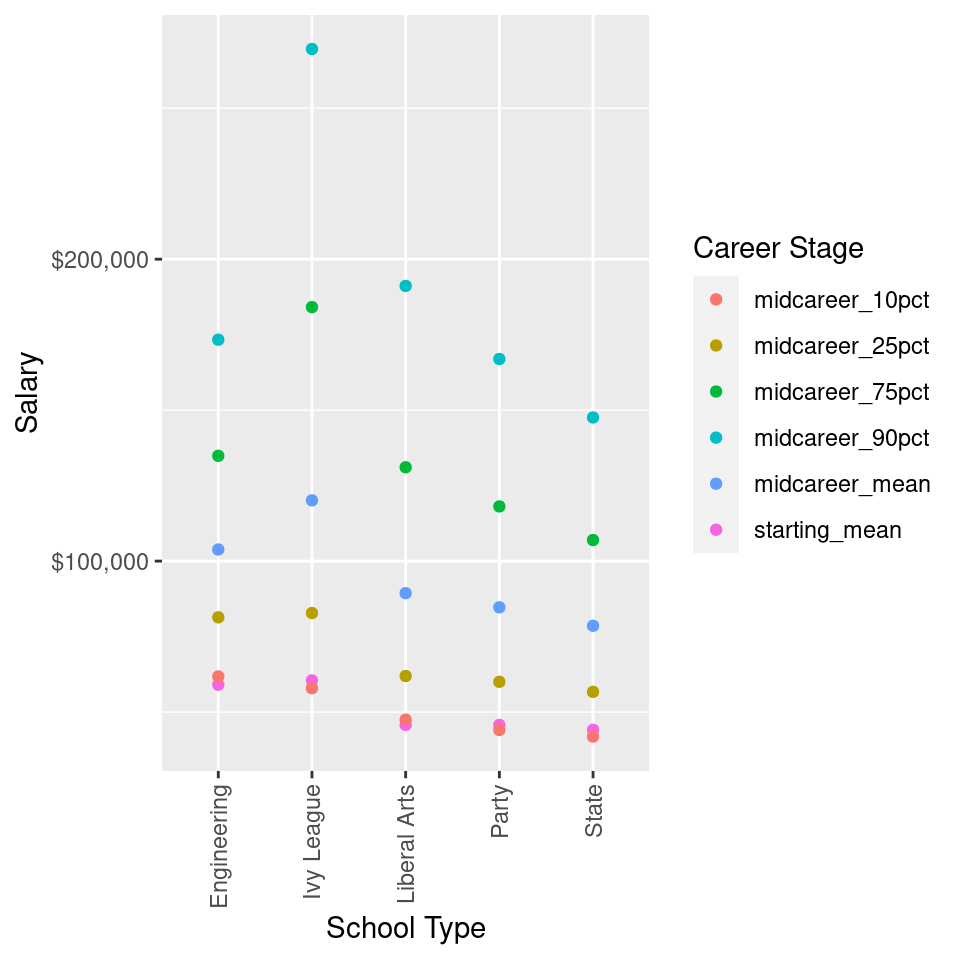
Analysis: ANOVA significance tests for school regions
At \(\alpha = 0.05\), we can reject the null hypothesis (there is no association between median starting salary and region). There is enough statistical evidence to conclude that there is an association between median starting salary and school region.
At \(\alpha = 0.05\), we can reject the null hypothesis (there is no association between median mid-career salary and region). There is enough statistical evidence to conclude that there is an association between mid-career salary and school region.
Analysis: p-tests for school types
At \(\alpha = 0.05\), we can reject the null hypothesis (there is no difference between the median starting salaries of Ivy League and State schools). We draw the same conclusion for the median mid-career salary of Ivy League and State schools.
At \(\alpha = 0.05\), we fail to reject the null hypothesis (there is no difference between the median starting salaries of graduates from Ivy League and Engineering schools). However, for median mid-career salaries we reject the null hypothesis (there is no difference between the median mid-career salaries of graduates from Ivy League and Engineering schools).
Conclusions
School region impacts median starting and mid-career salaries.
Median starting and mid-career salaries of Ivy League graduates are significantly higher than state school graduates.
Median starting salaries of Ivy League graduates are not significantly higher than engineering school graduates, but the median mid-career salaries are significantly higher.