It’s Getting Hot in Here
Report
Introduction
Climate change is the biggest challenge facing our generation, with increased global CO2 emissions being one of the leading contributors to this issue. According to NASA, “Carbon dioxide in the atmosphere warms the planet, causing climate change. Human activities have raised the atmosphere’s carbon dioxide content by 50% in less than 200 years,” and according to Climate.gov, “By adding more carbon dioxide to the atmosphere, people are supercharging the natural greenhouse effect, causing global temperature to rise.” However, in order to combat the effects of climate change, we must first understand the data behind it. In our analysis, we intend to answer the following research questions:
In 2018, is the true proportion of developed countries with CO2 gas emissions above 1000 kilotons different than those with CO2 gas emissions below 1000 kilotons? The definition of developing versus developed countries will be as defined by the United Nations:
https://www.un.org/en/development/desa/policy/wesp/wesp_current/2014wesp_country_classification.pdf?
Is the true proportion of countries with a CO2 emission greater than the US in the twentieth century different from those in the twenty-first century?
Through significance tests we discovered that in 2018, the proportion of industrialized countries with CO2 gas emissions exceeding 1000 kilotons differed from those with CO2 gas emissions below 1000 kilotons, although the data did not provide strong evidence for this claim. The data also offers strong proof that the true fraction of nations with CO2 emissions higher than those of the US in the twentieth century differed from those in the twenty-first.
Data description
Motivation
The dataset was created to show how emissions are changing in each country and allow for comparisons of various countries and regions in relation to overall emission trends along with their sources. The Our World in Data team created the original dataset on behalf of the Our World in Data project, which is a project of the Global Change Data Lab (a non-profit organization based in the United Kingdom). The current dataset we will be using is a subset from the original dataset from the CORGIS Dataset Project created by Sam Donald. The Global Change Data Lab funded the creation of the dataset, and it is a registered charity in England and Wales. Their work is made possible by donations from individuals and organizations that have contributed to their project.
Composition
The dataset’s instances represent countries (per year from 1992 to 2018), and there are 2484 instances in total. The observations (rows) are countries per year, and the attributes (columns) are year, country name, country code, country GDP, country population, emissions production CH4, emissions production N2O, emissions production CO2 cement, emissions production CO2 coal, emissions production CO2 gas, emissions production CO2 oil, emissions production CO2 flaring, emissions production CO2 other, emissions production CO2 total, emissions global share CO2 cement, emissions global share CO2 coal, emissions global share CO2 gas, emissions global share CO2 oil, emissions global share CO2 flaring, emissions global share CO2 total.
Collection Process
The original dataset is built upon a number of datasets and processing steps. The datasets that were processed include Statistical review of world energy (BP), International energy data (EIA), Primary energy consumption (Our World in Data based on BP’s Statistical review of world energy & EIA’s International energy data), Global carbon budget - Fossil CO2 emissions (Global Carbon Project), Global carbon budget - Global carbon emissions (Global Carbon Project), Global carbon budget - National fossil carbon emissions (Global Carbon Project), Global carbon budget - National land-use change carbon emissions (Global Carbon Project), Global carbon budget (Our World in Data based on the Global Carbon Project’s Fossil CO2 emissions, Global carbon emissions, National fossil carbon emissions, and National land-use change emissions), Greenhouse gas emissions (including methane and nitrous oxide) by sector (CAIT), CO2 dataset (Our World in Data based on all sources above), Population (Our World in Data based on a number of different sources), and GDP (University of Groningen GGDC’s Maddison Project Database, Bolt and van Zanden, 2020). The current dataset we are using extracts from the original dataset.
The current dataset we will use depends on the datasets it was built off of and how they were processed, so if certain countries or emission data were left out of those datasets, they will also be left out of our dataset.
Preprocessing/cleaning/labeling
The various datasets that were the foundation for the original dataset underwent processing steps (the codes of which can be found at this website, https://github.com/owid/co2-data), the names of countries and regions were standardized, the carbon emissions were recalculated to CO2 (e.g. from tonnes of carbon to tonnes of CO2 using a conversion factor of 3.664), and per capita figures were calculated from the dataset’s “Population” metric, which is included in the complete dataset and the population figures were sourced from Gapminder and the UN World Population Prospects (UNWPP). The current dataset we will use is a subset of the original dataset, with all the tonnes units converted into kilotons and the variable names altered.
The link for the software and code that was used to preprocess/clean/label the data: https://github.com/owid/co2-data
Data analysis
# A tibble: 92 × 2
   Country.Name          mean
   <chr>                <dbl>
 1 Afghanistan   33132487623.
 2 Albania       21086224119.
 3 Algeria      337419554968.
 4 Angola        80080787153.
 5 Argentina    644263431130.
 6 Armenia       21997234897.
 7 Australia    846270603567.
 8 Austria      306055723842.
 9 Azerbaijan    87440896379.
10 Bangladesh   324340371911.
# ℹ 82 more rows
The average GDP for all countries (between 1992 and 2018) in the dataset were calculated and can be found in the displayed tibble.
# A tibble: 92 × 2
   Country.Name    mean
   <chr>          <dbl>
 1 Afghanistan   0.308
 2 Albania       0.0591
 3 Algeria      54.3
 4 Angola        1.21
 5 Argentina    76.1
 6 Armenia       3.19
 7 Australia    56.1
 8 Austria      16.3
 9 Azerbaijan   17.6
10 Bangladesh   28.6
# ℹ 82 more rows
The average CO2 gas emissions for all countries (between 1992 and 2018) in the dataset were calculated and can be found in the second displayed tibble.
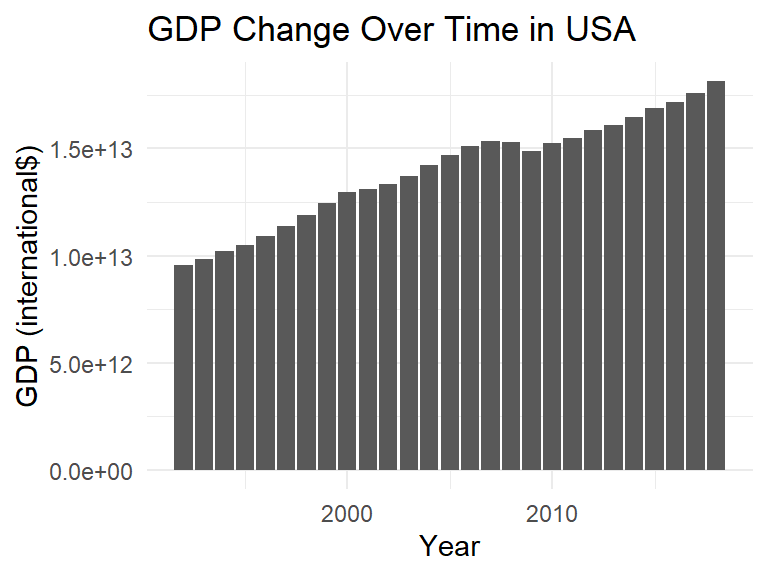
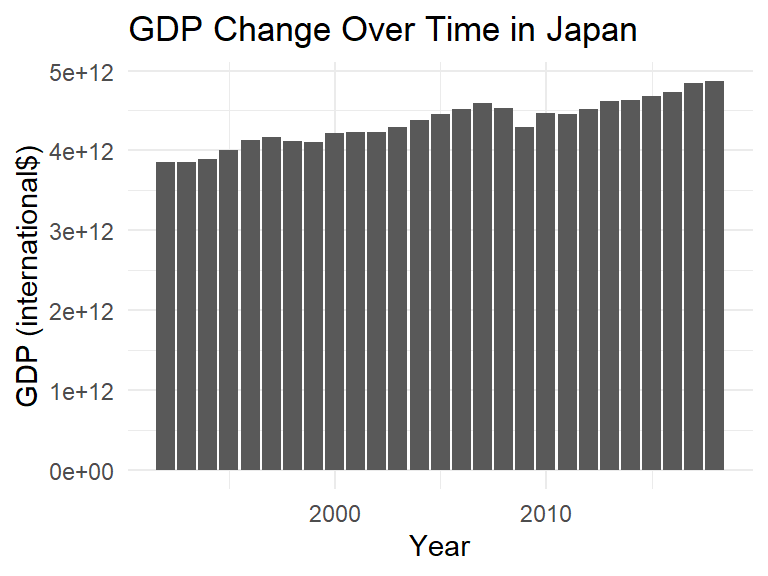
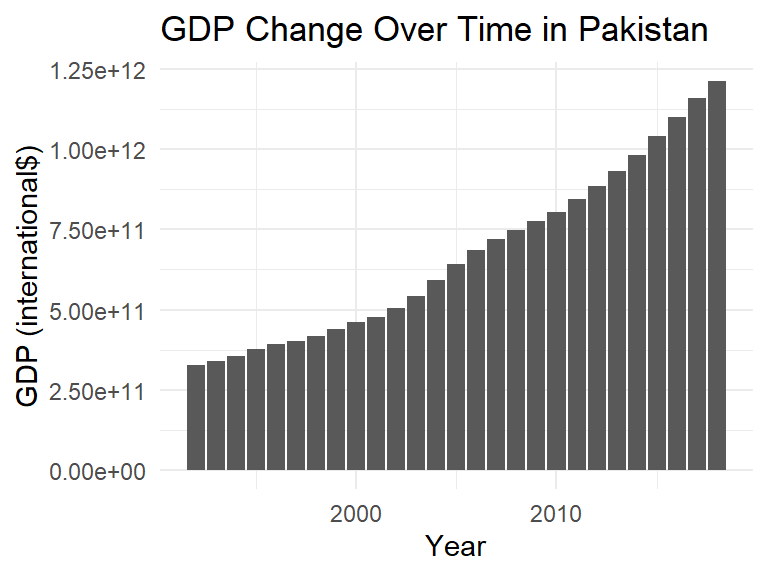
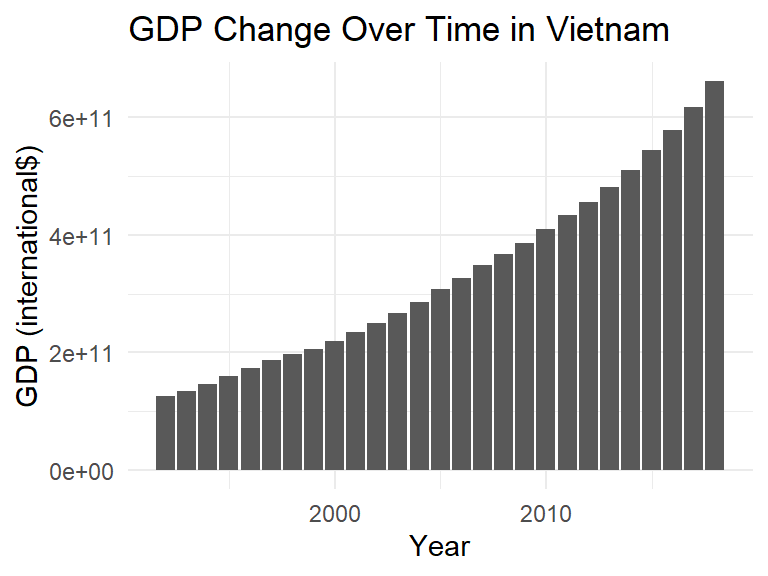
Through visualizing the change in GDP over time for the two developed (United States and Japan) countries and the two developing countries (Pakistan and Vietnam), it can be seen that it appears that developing countries have a much higher rate of increase in GDP over time than developed countries do. However, as expected, the developing countries have much lower GDPs than developed countries in general.
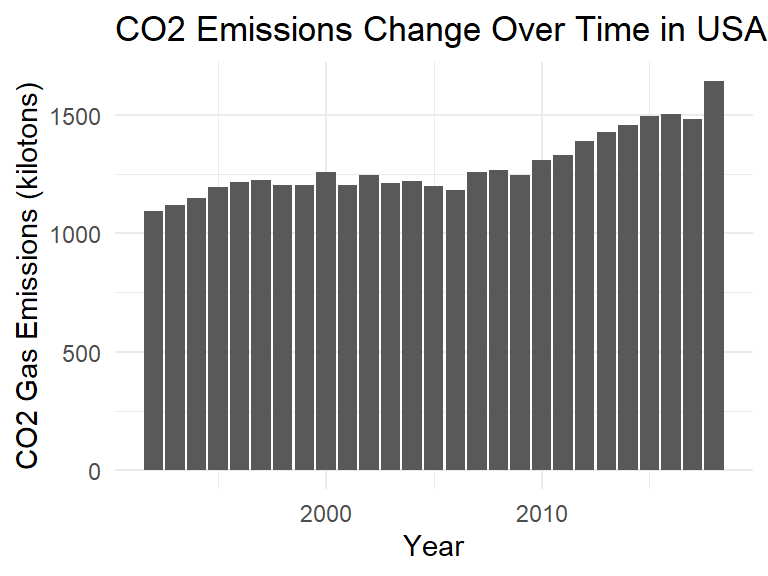
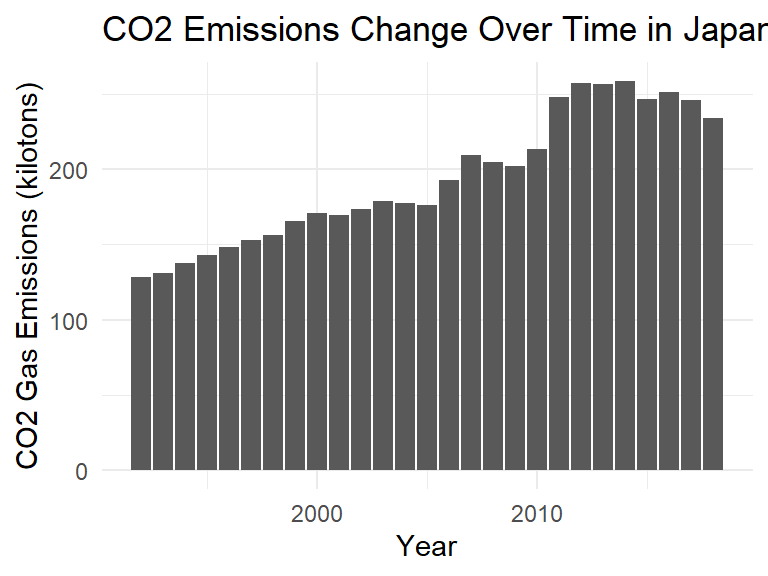
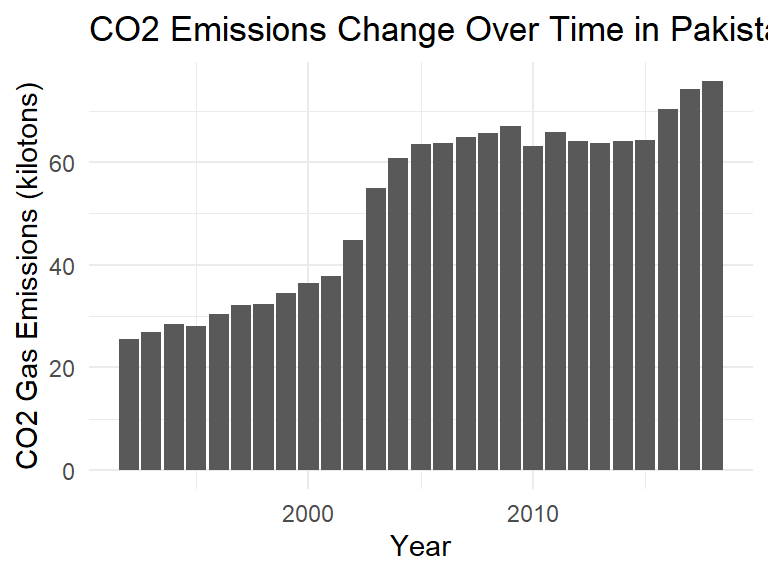
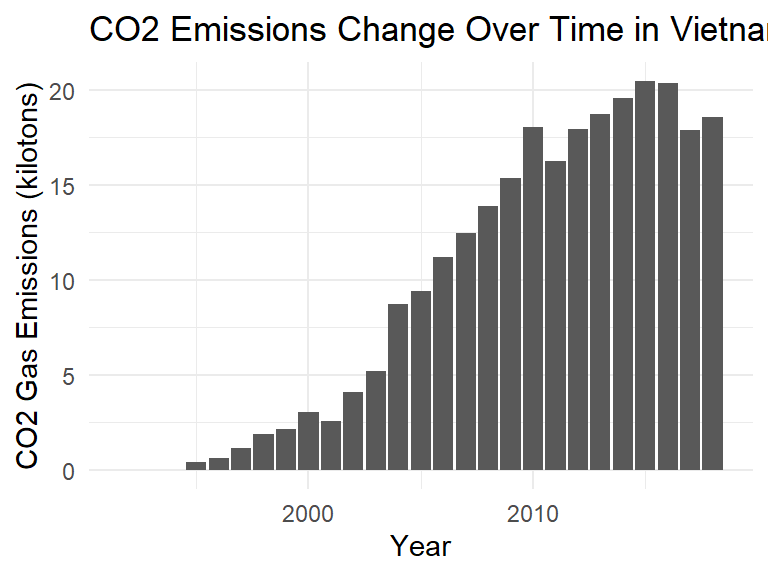
Through visualizing the change in CO2 gas emissions over time for the two developed (United States and Japan) countries and the two developing countries (Pakistan and Vietnam), it can be seen that it appears that developing countries have a much higher rate of increase in CO2 gas emissions over time than developed countries do. Furthermore, as expected, despite higher rates of growth in CO2 gas emissions over time for developing countries, developed countries tend to have much higher CO2 gas emissions overall than developing countries.
The above observations could indicate a possible correlation between GDP growth and increased CO2 emissions. It could also suggest that developed countries produce much more CO2 gas than developing countries, contributing much more to climate change, but that there is an upward trend in development in developing countries that are also increasing CO2 gas emissions.
We will utilize a logistic regression model to analyze the relationship between GDP and CO2 gas emissions for developing versus developed countries in 2018. As there is no clear definition of a GDP threshold that determines whether a country is developed or developing, we will use the United Nations’ definition (https://www.un.org/en/development/desa/policy/wesp/wesp_current/2014wesp_country_classification.pdf?), since their definition takes a country’s GDP into account.
# A tibble: 2 × 5
  term                          estimate std.error statistic p.value
  <chr>                            <dbl>     <dbl>     <dbl>   <dbl>
1 (Intercept)                   0.573      0.232       2.46   0.0137
2 Emissions.Production.CO2.Gas -0.000483   0.00105    -0.460  0.645
The logistic regression model using the total CO2 emissions production as an explanatory variable is as follows:
\[ log(\frac{p}{1-p})= 0.573 - 0.000483 \times CO2~gas~emissions \]
The probability a country is developed can be calculated as:
\[p = \frac{\exp\{0.573 - 0.000483 \times CO2~gas~emissions\}}{1 + \exp\{0.573 - 0.000483 \times CO2~gas~emissions\}}\]
Thus, using the logistic regression model, if the CO2 gas emissions of a given country is 100 kilotons, the probability that that country is developed is 0.37:
# A tibble: 1 × 2
  .pred_developed .pred_developing
            <dbl>            <dbl>
1           0.372            0.628
If the CO2 gas emissions of a given country is 1000 kilotons, the probability that that country is developed is 0.48:
# A tibble: 1 × 2
  .pred_developed .pred_developing
            <dbl>            <dbl>
1           0.478            0.522
If the CO2 gas emissions of a given country is 3000 kilotons, the probability that that country is developed is 0.71:
# A tibble: 1 × 2
  .pred_developed .pred_developing
            <dbl>            <dbl>
1           0.706            0.294
Using the default decision-making threshold of 0.5 (that is, if the predicted probability that a country is developed is greater than 0.5, then we would classify it as developed), we can see that as the CO2 gas emissions increases, the probability that the country is developed also increases, which indicates that GDP growth/higher GDP is correlated with higher CO2 gas emissions. Additionally, it appears that there is a CO2 gas emission threshold of around 1000 kilotons, where countries with CO2 gas emissions greater than 1000 kilotons are most likely developed, while countries with CO2 gas emissions less than 1000 kilotons are most likely developing.
Evaluation of significance
Research Question One
The first research question we will attempt to answer is: In 2018, is the true proportion of developed countries with CO2 gas emissions above 1000 kilotons different than those with CO2 gas emissions below 1000 kilotons? As there is no clear definition of a GDP threshold determining whether a country is developed or developing, we will again use the United Nations’ definition (https://www.un.org/en/development/desa/policy/wesp/wesp_current/2014wesp_country_classification.pdf?), since their definition takes a country’s GDP into account. To answer this question, we will conduct a hypothesis test.
Using the observed potential CO2 gas emission threshold of around 1000 kilotons from the logistic regression model, the null hypothesis is that in 2018, the true proportion of developed countries with CO2 gas emissions above 1000 kilotons is not different than those with CO2 gas emissions below 1000 kilotons. The alternative hypothesis is that in 2018, the true proportion of developed countries with CO2 gas emissions above 1000 kilotons is different than those with CO2 gas emissions below 1000 kilotons. In proper notation:
\[ H_0 : p_a - p_b = 0 \] \[ H_A: p_a - p_b \neq 0 \]
# A tibble: 1 × 1
  p_value
    <dbl>
1   0.766
Since the p-value is 0.766, which is greater than the significance level of 0.05, we fail to reject the null hypothesis. The data fails to provide convincing evidence that in 2018, the proportion of developed countries with CO2 gas emissions above 1000 kilotons is different from those with CO2 gas emissions below 1000 kilotons.
Research Question Two
The second research question we will attempt to answer is if the true proportion of countries with a CO2 emission greater than the US in the twentieth century is different from those in the twenty-first century. We will do this using a null hypothesis test. The null hypothesis is that there is no difference between the centuries, and the alternative hypothesis is the opposite: that there is a difference. In proper notation:
\[ H_0 : p_a - p_b = 0 \] \[ H_A: p_a - p_b \neq 0 \]
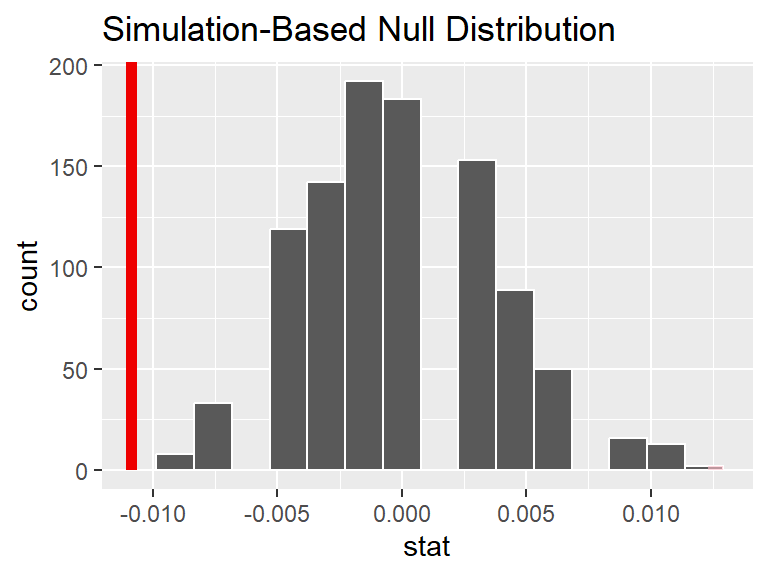
# A tibble: 1 × 1
  p_value
    <dbl>
1       0
Since the p-value is 0, which is less than the significance level of 0.05, we reject the null hypothesis in favor of the alternative hypothesis. The data provide convincing evidence that the true proportion of countries with a CO2 emission greater than the US in the twentieth century differs from those in the twenty-first century.
Interpretation and conclusions
We investigate the CO2 emissions of the world and its nations from 1992 - 2018. First, we create some graphs using the UN definition of developing/developed nations. Through our visualizations, GDP change over time for developing countries is increasing, but much faster than in developed countries. The same is for CO2 emissions, where both developed types of nations have increasing emissions. Still, developing nations have a much higher rate of increase (although developed countries have much higher emissions than developing nations in the first place). We found, with a logistic regression, that as a country’s carbon emissions increase, the more likely it was developed.
We thus conducted a correlation test to see if the CO2 increase was steeper in developing or developed nations. However, the data and test statistics showed us that it was unlikely that there was a difference in proportion between developed countries with CO2 gas emissions above 1,000 kilotons and nations with emissions less than 1,000 kilotons.
Secondly, we investigate if the true proportion of nations with CO2 emissions greater than the US in the 20th century is different than those in the 21st century. In our 2-proportion test, there is indeed a likelihood that the proportion of nations with higher carbon emissions than the US is different between the two centuries.
We find that there is indeed an increase in CO2 emissions and that this increase is correlated to a country’s GDP. Furthermore, our data indicate a dramatic rise in CO2 emissions; for developing countries, a near-exponential increase, and for developed countries, a linear increase.
Regardless, according to the United Nations Environment Program (UNEP) and the Environmental Protection Agency (EPA), Carbon dioxide emissions are problematic because they contribute to the warming of the Earth’s atmosphere and the subsequent climate change. Furthermore, in developing nations, we tend to see industrialization, which means more burning of fossil fuels and deforestation, thus increasing CO2 emissions. Therefore, we see an increase in emissions from these countries.
Reducing emissions is essential to mitigate the impacts of climate change and limit the ever-increasing global temperature. This requires transitioning to renewable energy sources, improving energy efficiency, reducing deforestation, and promoting reforestation and eco-repair. Developing or developed, every nation has a duty to help protect and preserve the planet in which we all reside.
Limitations
We encountered a few minor limitations with our dataset. Not all 195 countries are in our dataset, which limits the scope of our dataset a bit. The years within the dataset only range from 1992 to 2018, which could be a limitation because the range is 26 years, which may or may not be a long enough time period to see substantive changes in GDP or CO2 emissions. Additionally, this dataset does not contain data for more recent years, which could be another limitation if we want to see the most up-to-date data on GDP/emissions for different countries. Moreover, we wanted to see the relationship between GDP and CO2 emissions for developed and developing countries, however, there was no exact GDP threshold to determine if a country is developed or not. Thus, we used the UN classification which takes GDP into account, but GDP is not the sole determining factor of whether a country is developing or not.
Acknowledgments
We would first like to express our sincere thanks to our section’s graduate TA that has helped us every step of the way: Chi-Jung L. We would also like to acknowledge our peer reviewers Impressive Charmander and Impressive Togepi, who have provided us with constructive feedback to better our projects. We want to thank Professor Benjamin Soltoff for all the helpful AEs he walked us through. Lastly, we would like to acknowledge the Our World Our Data team for the report’s dataset. Our report would not have been possible without the assistance of all those mentioned above. We would also like to thank Nintendo and the Pokemon IP for inspiring the names for our teams and for inspiring us to always be better people. Gotta Catch ’Em All!