The Effect of State Resource Allocation on Crime Rate
Based on correction, police, and education sector spending from 2015-2019
Introduction to Topic and Data
Investigating the relationship between crime data and state allocation of spending
Research question: How does state allocation of financial resources affect crime rates across different states in the US from 2015-2019?
Hypothesis: states with more state funding for prisons, education, and the police tend to have lower violent crime rates.
We merged our data from the National Incident-Based Reporting System’s crime reports and state spending reports.
We combined columns of violent crime counts for each state between 2015-2019 with proportions of state spending for fields including prisons, education, and the police from the CORGIS data set.
Highlights from EDA
correlation between prison and crime rate: 0.3096611

Inference/modeling/other analysis
Prison Model \[ R^2 = 0.09224 , ~ pval = 5.885e-07 \]
Education Model \[ R^2 = -0.004028 , ~pval= 0.9738 \]
Police Model \[ R^2= 0.02056 , ~ pval = 0.01323 \]
Additive Model: \[ R^2= 0.1264, ~pval= 6.451e-08 \]
Interaction Model: \[ R^2 = 0.3193, pval = 2.2e-16 \]
Hypothesis Test for Prison Spending
Null Hypothesis: There is no significant difference in violence rate in countries with low per cap prison spending and high per cap prison spending. Alternative Hypothesis: There is a significant difference in violence rate in countries with low per cap prison spending and high per cap prison spending.
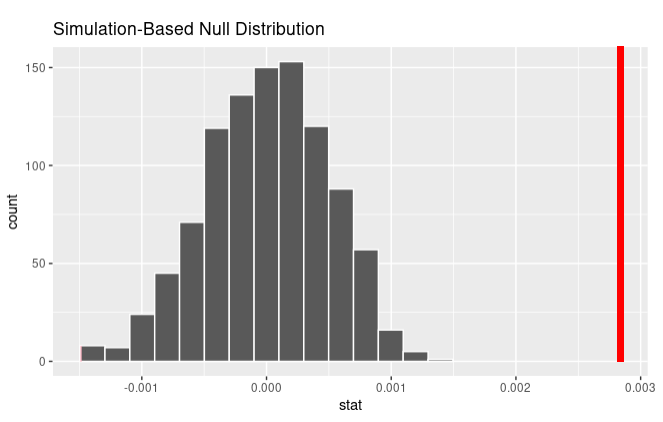
Since the p-value is 0 which is less than any significance level, we can reject the null hypothesis in favor of the alternative hypothesis. The data provides convincing evidence that the average violence crime rates of countries with low per cap prison spending and high per cap prison spending is different.
Analysis
Based on the results that we found from conducting hypothesis tests for state spending on police, education, and prisons, we noticed a difference in each of their effects on violent crime rates. Both for police spending and education spending, our acquired p-values were not small enough to be rejected on a 95% significance level but would be rejected on a 90% significance level. On the other hand, the p-value for prison spending was small enough to be rejected at the highest significance level. This indicates that the state allocation of funds to prisons has a much strong relationship with the average crime rates in the area than for state spending on police or education.
Conclusion
Other factors may influence state spending including political affiliation, state population, ranking in the education system, or other population demographics.
More feasible that the hypothesis test for prison spending yielded a lower p-value since prisons are related to crime activity. Our findings support our hypothesis that spending in police, education, and prisons are correlated with lower crime rates.
We plan to gather data over a longer period of time to make our regression models more accurate and to better visualize the trajectory of state spending’s influence on crime rates. We will also investigate other sectors such as healthcare or social welfare.