Introduction
Streaming platforms have taken the world by storm due to their convenience and ability to house innumerable popular television shows and movies. As these mediums continue to grow in popularity, discourse about them is also developing and is often centered around one primary question: Which platform is best? Throughout our data analysis, our team seeks to answer this aforementioned question to the best of our ability, taking an in-depth look at four mainstream services —- Netflix, Amazon Prime Video, Hulu, and Disney+ —- and the programs that have been present on the site throughout roughly the past two decades. Specifically, we use rankings developed by Rotten Tomatoes and hypothesis testing to approach two research questions:
RQ1: “Is the quality of exclusive shows different from non-exclusive shows across platforms?”
RQ2: “Are exclusive shows’ ratings different between the four platforms (Netflix, Hulu, Disney+, and Prime Video)?”
Our tv_shows dataset was taken from Kaggle and originally contained the following variables: ID , Title, Year, Age, IMDb, Rotten Tomatoes, Netflix, Hulu, Prime Video, Disney+, and Type.The original dataset contains 12 columns and 5368 observations. Each of the variables above were used to describe an observation of a television show featured on the four platforms we’re analyzing. In our data cleaning process, we made some of the variables easier to understand; in the Netflix, Hulu, Prime Video, Disney+ variables, we changed 0 or 1 binary results to “Yes” or “No” depending on whether a certain show is present on each platform. Additionally, we mutated the data to add four columns: exclusive_netflix, exclusive_prime_video, exclusive_disney_plus, and exclusive_hulu, which contains “TRUE” or “FALSE” data to indicate whether an observation is exclusively seen on the platform at hand. Finally, we removed the ‘%’ in the Rotten Tomatoes score and converted the values to integers to make them easier to use in our analysis.
After conducting two hypothesis tests and interpreting the results (including the p-value, point-estimate, and confidence interval values), we were able to determine a few conclusions with respect to the research questions above. Regarding the first hypothesis, we were able to reject the null hypothesis and were in favor of the alternative hypothesis. This means that the first hypothesis test provides convincing evidence that the average quality of exclusive shows (measured by Rotten Tomatoes scores) is greater than the average quality of non-exclusive shows (measured by Rotten Tomatoes scores) across all platforms. In terms of the second research question, our findings were in favor of the alternate hypothesis: there is some sort of difference in ratings between the exclusive shows on each of the four platforms.
Data description
The observations (rows) of the tvshows dataset represent each individual TV show that is readily watched and broadcasted on at least one of the four top ranking broadcasting platforms (we are focusing on Hulu, Disney+, Prime Video and Netflix). The attributes (columns) of the tvshows dataset categorizes each individual TV show based on the streaming platform it’s being streamed on and reveals additional information. This includes revealing the year the TV show was produced, target age group of audience, and the rating of the show (by the Rotten Tomatoes metric). This dataset was created by the curator after being inspired by personal experiences of wanting to know more about which streaming platform(s) a particular TV show can be found on. Furthermore, the curator wished to explore potential relationships between target age group of audience, year of production, and the streaming platform the show can be found on. The creation of the tvshows dataset was not funded by anyone and was curated solely with the desire to learn more about tv shows readily broadcasted on top streaming platforms. Specifically, the curator likely looked at TV shows broadcasted on each streaming platform to determine which Rotten Tomatoes ratings to include within the dataset and determine which year of production data as well as target age of audience should be included.
As previously mentioned, the processes that might have influenced which TV shows and relevant information that was and wasn’t observed/recorded involved a combination of the curator’s personal experiences with TV shows and the observed streaming platforms. Specifically, the curator must have had some interest, interaction or experience with the streaming platforms or specific TV shows to have wanted to focus the observations of the dataset to include just TV shows from specific streaming platforms ( Netflix, Hulu, Disney Plus and Prime Video). Also, the availability of the TV show on these platforms influenced whether a particular show was included in the dataset as shows not available on the aforementioned platforms wouldn’t be observed or recorded. Finally, the availability of the information about the show (i.e., target age, year of production, Rotten Tomatoes ratings, etc.) would have influenced whether certain shows were included in the dataset or whether the show would be included with NA values in place of where this information is recorded in the dataset.
In regards to the preprocessing of the data, the Rotten Tomatoes score itself needed to undergo specific calculations before the curator is able to scrape the Rotten Tomatoes score for the corresponding TV shows. To summarize, the Rotten Tomatoes score is calculated only when the show receives at least 5 reviews. Then, the critic’s rating of “Fresh” (positive) or “Rotten” bad is collected and the Rotten Tomatoes percentage is calculated by dividing the number of “Fresh” scores by the total number of “Fresh” and “Rotten” scores times 100. In addition, the curator then used a binary system (0 for “no” and 1 for “yes”) to classify which streaming platform(s) each TV show can be found on.
The curator did not involve any other people during the data collection and likely collected the data from official sites that reported the taken corresponding data values. At the same time, the Rotten Tomatoes data values inherently involve people as the score is reliant on people’s opinions and rating of the show. From this perspective, the people are likely aware of this data collection as they are displaying their ratings of the tv shows in a public domain. They likely expected their data to be used to contribute to the overall rating of the TV show and used to inform others on whether they should watch the respective TV show.
Data analysis
── Attaching packages ─────────────────────────────────────── tidyverse 1.3.2 ──
✔ ggplot2 3.4.2     ✔ purrr   1.0.0
✔ tibble  3.2.1     ✔ dplyr   1.1.2
✔ tidyr   1.2.1     ✔ stringr 1.5.0
✔ readr   2.1.3     ✔ forcats 0.5.2
── Conflicts ────────────────────────────────────────── tidyverse_conflicts() ──
✖ dplyr::filter() masks stats::filter()
✖ dplyr::lag()    masks stats::lag()
── Attaching packages ────────────────────────────────────── tidymodels 1.0.0 ──

✔ broom        1.0.2     ✔ rsample      1.1.1
✔ dials        1.1.0     ✔ tune         1.1.1
✔ infer        1.0.4     ✔ workflows    1.1.2
✔ modeldata    1.0.1     ✔ workflowsets 1.0.0
✔ parsnip      1.0.3     ✔ yardstick    1.1.0
✔ recipes      1.0.6

── Conflicts ───────────────────────────────────────── tidymodels_conflicts() ──
✖ scales::discard() masks purrr::discard()
✖ dplyr::filter()   masks stats::filter()
✖ recipes::fixed()  masks stringr::fixed()
✖ dplyr::lag()      masks stats::lag()
✖ yardstick::spec() masks readr::spec()
✖ recipes::step()   masks stats::step()
• Dig deeper into tidy modeling with R at https://www.tmwr.org

Loading required package: viridisLite


Attaching package: 'viridis'


The following object is masked from 'package:scales':

    viridis_pal


New names:
Rows: 5368 Columns: 12
── Column specification ────────────────────────────────────────────────────────
Delimiter: ","
chr (4): Title, Age, IMDb, Rotten Tomatoes
dbl (8): ...1, ID, Year, Netflix, Hulu, Prime Video, Disney+, Type

ℹ Use `spec()` to retrieve the full column specification for this data.
ℹ Specify the column types or set `show_col_types = FALSE` to quiet this message.
# A tibble: 5,368 × 16
    ...1    ID Title            Year Age   IMDb  `Rotten Tomatoes` Netflix Hulu
   <dbl> <dbl> <chr>           <dbl> <chr> <chr>             <int> <chr>   <chr>
 1     0     1 Breaking Bad     2008 18+   9.4/…               100 Yes     No
 2     1     2 Stranger Things  2016 16+   8.7/…                96 Yes     No
 3     2     3 Attack on Titan  2013 18+   9.0/…                95 Yes     Yes
 4     3     4 Better Call Sa…  2015 18+   8.8/…                94 Yes     No
 5     4     5 Dark             2017 16+   8.8/…                93 Yes     No
 6     5     6 Avatar: The La…  2005 7+    9.3/…                93 Yes     No
 7     6     7 Peaky Blinders   2013 18+   8.8/…                93 Yes     No
 8     7     8 The Walking De…  2010 18+   8.2/…                93 Yes     No
 9     8     9 Black Mirror     2011 18+   8.8/…                92 Yes     No
10     9    10 The Queen's Ga…  2020 18+   8.6/…                92 Yes     No
# ℹ 5,358 more rows
# ℹ 7 more variables: `Prime Video` <chr>, `Disney+` <chr>, Type <dbl>,
#   exclusive_netflix <lgl>, exclusive_hulu <lgl>, exclusive_prime_video <lgl>,
#   exclusive_disney_plus <lgl>
`summarise()` has grouped output by 'decile'. You can override using the
`.groups` argument.
# A tibble: 5 × 5
  term             estimate std.error statistic   p.value
  <chr>               <dbl>     <dbl>     <dbl>     <dbl>
1 (Intercept)       35.5        0.937   37.8    8.27e-278
2 NetflixYes        17.0        0.929   18.3    1.01e- 72
3 HuluYes           15.8        0.891   17.7    2.07e- 68
4 `Prime Video`Yes  -0.0767     0.920   -0.0834 9.34e-  1
5 `Disney+`Yes      11.9        1.26     9.43   5.70e- 21
\[
Rotten Tomatoes = 35.45 + 17.02*NetflixYes + 15.79*HuluYes \\ - 0.08*Prime VideoYes + 11.86*Disney+Yes
\]
Linear Regression Explanation:
The intercept of 35.45 represents the expected value of Rotten Tomatoes scores when all of the binary predictor variables (NetflixYes, HuluYes, Prime VideoYes, and Disney+Yes) are equal to zero. Based on these results, we can see that shows on Netflix and Hulu are associated with higher Rotten Tomatoes ratings, as indicated by their positive estimates of 17.02 and 15.79, respectively, and their very small p-values of 1.01e-72 and 2.07e-68, respectively. In contrast, the presence of Prime Video is associated with slightly lower Rotten Tomatoes ratings, as seen by its negative estimate of -0.08 and p-value of 0.933, although this difference is not statistically significant. Finally, the presence of Disney+ is associated with higher Rotten Tomatoes ratings; this can be seen by its positive estimate of 11.86 and very small p-value of 5.70e-21.
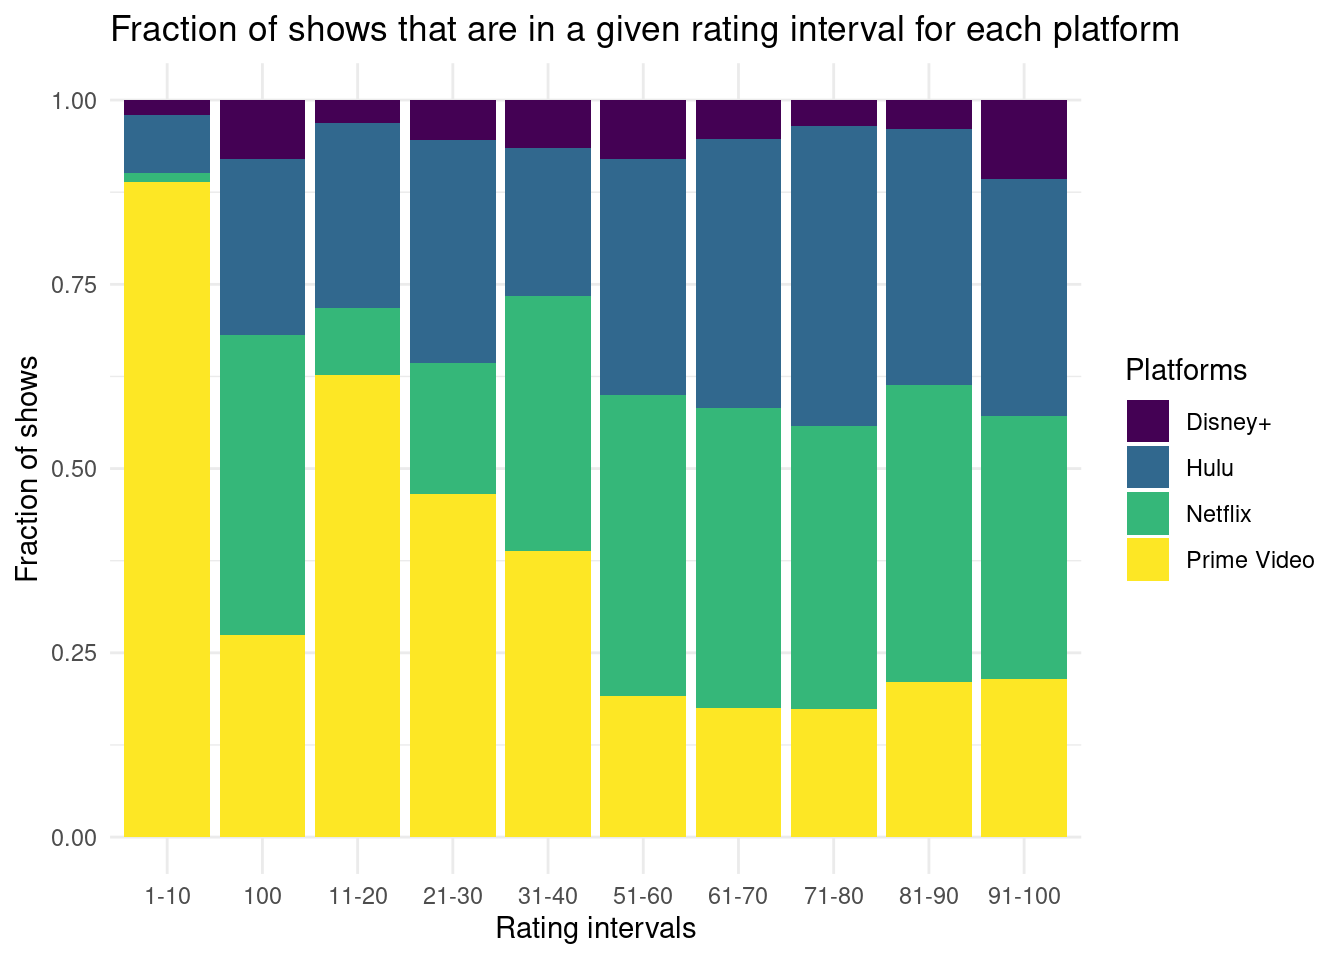
Fraction of shows that are in a given rating interval for each platform:
The graph titled Fraction of shows that are in a given rating interval for each platform is a normalized frequency bar chart where every bar has the same height so that each bar represents the proportion of each rating (in our case: rotten tomatoes score) interval for a given platform. This allows us to normalize the number of shows in each platform and reduce the bias of different platforms having different number of shows. In this graph, the y-axis represents the fraction of shows (compared to the overall number of shows) rather than the actual number of shows on each platform. This allows us to compare the rotten tomato scores of shows of each platform as well as across all the platforms. The x-axis represents the rotten tomato score intervals (decided) that we chose to categorize and group the shows based on.
Based on the graph we can deduce that Hulu and Netflix have equally large proportion of shows ranked between 91 and 100 on rotten tomatoes. Prime Video has the third largest proportion of shows in that interval of rotten tomatoes scores, followed by the last platform, which is Disney+. The same tendency is consistent for rotten tomatoes score intervals 51-60, 61-70, 71-80, and 81-90 rotten tomatoes score intervals. The proportion of shows that have the lowest rotten tomatoes score is the largest for Prime Video. Shows ranked within the interval of 1-10 are mostly streamed on Prime Video. In general, it seems like Netflix and Hulu have the largest proportion of shows that are ranked relatively high on rotten tomatoes, meanwhile Prime Video has the largest proportion of shows that are ranked the lowest on rotten tomatoes.
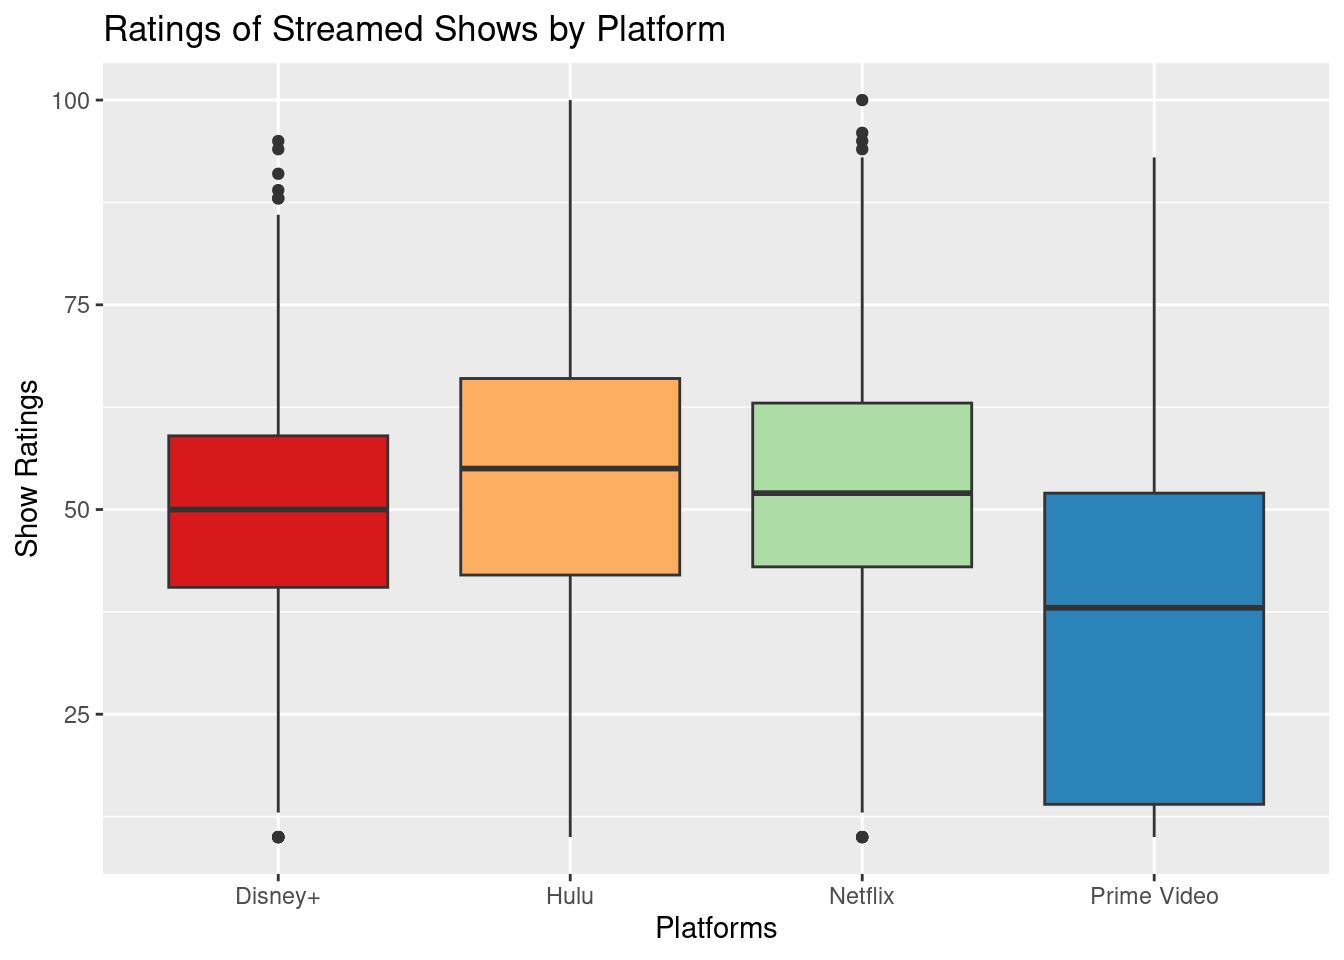
Ratings of Streamed Shows by Platform:
This graph shows boxplots that represent the distribution of rotten tomatoes scores of shows on each platform. The heights of the boxplots represent the diversity of data points (in this case rotten tomatoes scores) on each platform. The rotten tomatoes scores of shows in Disney+ are the most consistent across all the shows and are similar to each other with the median rotten tomatoes score being 50 (indicated by the horizontal line). The same is true for scores of shows streaming on Netflix. On the other hand, because the boxplot for shows streaming on Prime Video is well spread out across the y-axis, meaning its IQR is large, the scores for the shows streaming on Prime Video have varying range and are not consistent or similar across all the shows on the platform. This also means that even though there is a mean value of around 40, we cannot make meaningful conclusions about Prime Video show scores that would be relevant and valid for all the shows across the platform. This said, comparatively it seems that Hulu has the highest median score for its shows.
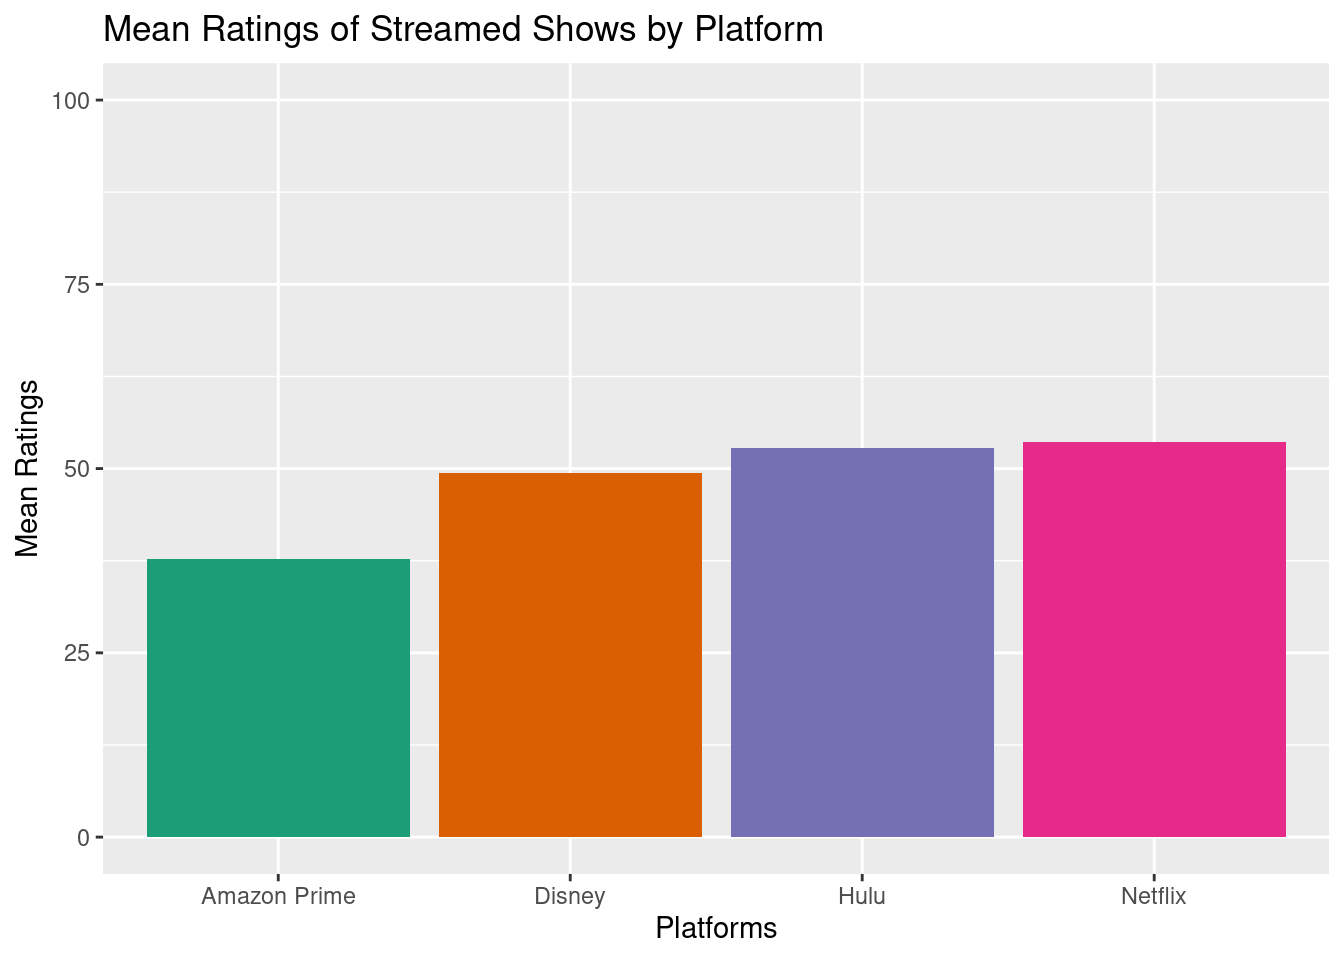
Mean Ratings of Streamed Shows by Platform
This graph shows the mean rotten tomatoes score of shows per platform. Netflix and Hulu seem to have almost the same mean rotten tomatoes score with Netflix slightly dominating. On the third place with rotten tomatoes score is Disney+, which is followed by Prime Vide that has the lowest mean score for shows streaming on it.
Overall, these exploratory data visualizations show that there is a difference between rotten tomatoes scores for shows on different platforms. Moving forward we explore the possible factors (exclusivity of the shows to each platform) that might affect these differences.
Evaluation of significance
First Analysis: Hypothesis Test
Research Question: Is the quality of exclusive shows different from non-exclusive shows across all streaming platforms?
Null Hypothesis: The average Rotten Tomatoes score of exclusive shows is less than the average Rotten Tomatoes score of non-exclusive shows across all four platforms.
\[
H_0: \mu_{exclusive} < \mu_{non-exclusive}
\]
Alternative Hypothesis: The average Rotten Tomatoes score of exclusive shows is greater than the average Rotten Tomatoes score of non-exclusive shows across all four platforms.
\[
H_0: \mu_{exclusive} > \mu_{non-exclusive}
\]
Response: rotten_tomatoes (numeric)
Explanatory: exclusivity (factor)
# A tibble: 1 × 1
   stat
  <dbl>
1 -1.14
Warning: Please be cautious in reporting a p-value of 0. This result is an
approximation based on the number of `reps` chosen in the `generate()` step. See
`?get_p_value()` for more information.
# A tibble: 1 × 1
  p_value
    <dbl>
1       0
Warning in min(diff(unique_loc)): no non-missing arguments to min; returning Inf
# A tibble: 1 × 2
  lower_ci upper_ci
     <dbl>    <dbl>
1    -1.80   -0.578
Second Analysis: Hypothesis Test
Research Question: Are exclusive shows’ ratings different between the four platforms (Netflix, Hulu, Disney+, and Prime Video)?
Null Hypothesis: There is no difference in quality of the exclusive shows between the four platforms.
\[
H_0: μ1 = μ2 = μ3 = μ4
\]
Alternate Hypothesis: There is a difference in quality of the exclusive shows between the four platforms.
\[
H_A: μ1 ≠ μ2 ≠ μ3 ≠ μ4
\]
# A tibble: 4 × 2
  term                       estimate
  <chr>                         <dbl>
1 intercept                     52.7
2 showsexclusive_disney_plus    -4.60
3 showsexclusive_hulu           -1.56
4 showsexclusive_prime_video   -17.9
Warning: Please be cautious in reporting a p-value of 0. This result is an
approximation based on the number of `reps` chosen in the `generate()` step. See
`?get_p_value()` for more information.

Warning: Please be cautious in reporting a p-value of 0. This result is an
approximation based on the number of `reps` chosen in the `generate()` step. See
`?get_p_value()` for more information.

Warning: Please be cautious in reporting a p-value of 0. This result is an
approximation based on the number of `reps` chosen in the `generate()` step. See
`?get_p_value()` for more information.
# A tibble: 4 × 2
  term                       p_value
  <chr>                        <dbl>
1 intercept                     0
2 showsexclusive_disney_plus    0
3 showsexclusive_hulu           0.02
4 showsexclusive_prime_video    0
# A tibble: 4 × 3
  term                       lower_ci upper_ci
  <chr>                         <dbl>    <dbl>
1 intercept                     52.0    53.5
2 showsexclusive_disney_plus    -6.41   -2.77
3 showsexclusive_hulu           -2.81   -0.310
4 showsexclusive_prime_video   -19.0   -16.6
Warning: F usually corresponds to right-tailed tests. Proceed with caution.

Warning: F usually corresponds to right-tailed tests. Proceed with caution.

Warning: F usually corresponds to right-tailed tests. Proceed with caution.
Warning: F usually corresponds to right-tailed tests. Proceed with caution.
Interpretation and conclusions
Hypothesis #1: Point-Estimate
The point estimate -1.141822 represents, on average, the estimated difference of mean Rotten Tomatoes ratings between exclusive shows (to only one platform) and non exclusive shows across all four platforms.
Hypothesis #1: Confidence Interval
The 95% confidence interval [-1.78, -0.500] represents that we can be 95% confident that the difference in average Rotten Tomato rating between exclusive and non-exclusive shows across all platforms observed in the real population falls into the observed range of the confidence interval.
Additionally, since the bootstrapped confidence interval [-1.78, -0.500] does not include 0 in its interval, we can confidently rule out the possibility that exclusive shows across all platforms do not have a significant influence on Rotten Tomatoes ratings. In other words, since the confidence interval does not include 0, this suggests that the difference in average Rotten Tomato ratings between exclusive and non-exclusive shows is statistically significant and that exclusive shows has a significant influence on average Rotten Tomatoes ratings.
Hypothesis #1: P-Values
The calculated p-value for the difference in mean Rotten Tomato ratings between exclusive and non-exclusive shows across all 4 platforms is approximately 0.001. Since this calculated p-value is smaller than the significance level indicated by \(\alpha\) = 0.05, we are able to reject the null hypothesis (the average Rotten Tomatoes score of exclusive shows is less than the average Rotten Tomatoes score of non-exclusive shows across all four platforms.). In other words, there was convincing evidence that would favor the alternative hypothesis which indicates that the average Rotten Tomatoes score of exclusive shows is greater than the average Rotten Tomatoes score of non-exclusive shows across all four platforms.
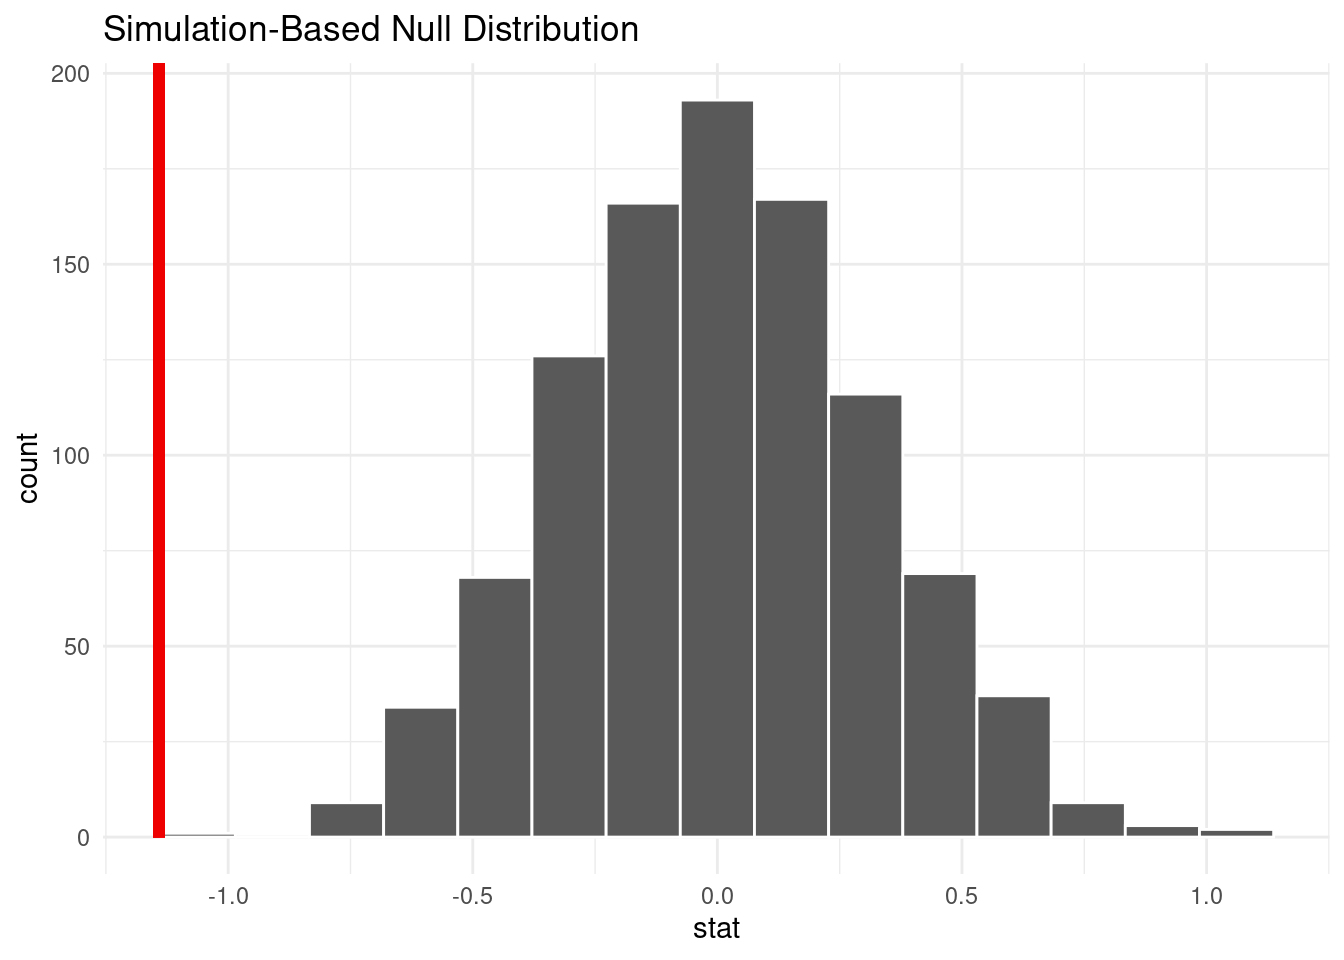
Hypothesis #1: Simulation-Based Null Distributions Visualization
The visualization displays the null distribution and the p-value (shown by the red line). Specifically, the null distribution displayed represents the distribution of the difference of mean Rotten Tomatoes scores between exclusive and non-exclusive shows under the assumption that the null hypothesis is true. Based on the visualization, the p-value is found on the left of the null distribution. Since a one-tailed test was conducted, the critical region is found on the left side of the null distribution. This then indicates that the observed test statistic (the difference in mean Rotten Tomatoes scores) falls within the critical region. This means that the difference in mean Rotten Tomatoes scores is smaller than what would be expected under the null hypothesis. This also means the observed data is unlikely to have occurred by chance alone, assuming the null hypothesis is true. Thus, correspondingly, the p-value will be a very small value and would overall provide evidence in support of the alternative hypothesis: the difference in mean Rotten Tomato ratings between exclusive and non-exclusive shows across all platforms is statistically significant in the direction specified by the alternative hypothesis (the average Rotten Tomatoes score of exclusive shows is greater than the average Rotten Tomatoes score of non-exclusive shows across all four platforms).
Hypothesis #2: Point Estimate
The intercept 52.747303 represents, on average, the Rotten Tomatoes score for exclusive Netflix shows.
The estimated Rotten Tomatoes score for exclusive Disney plus shows, on average, will be 4.600244 less than the exclusive Netflix shows Rotten Tomatoes score. The estimated Rotten Tomatoes score for exclusive Hulu shows, on average, will be 1.556898 less than the exclusive Netflix shows Rotten Tomatoes score. The estimated Rotten Tomatoes score for exclusive Prime video shows, on average, will be 17.856883 less than the exclusive Netflix shows Rotten Tomatoes score.
Hypothesis #2: Confidence Intervals
The 95% confidence intervals for observing the estimated Rotten Tomatoes scores for shows exclusive to either Hulu, Disney+, or Prime Video are
[-6.406644, -2.7691091] for exclusive_disney_plus
[-2.813665, -0.3103026] for exclusive_hulu
[-19.043264, -16.124430] for exclusive_prime_video
The 95% confidence interval [-6.406644, -2.7691091] for exclusive_disney_plus means that we can be 95% confident that the estimated difference in Rotten Tomatoes scores between exclusive shows on Disney+ and Netflix (the reference, or intercept, variable) is within the given confidence interval range.
The 95% confidence interval [-2.813665, -0.3103026] for exclusive_hulu means that we can be 95% confident that the estimated difference in Rotten Tomatoes scores between exclusive shows on Hulu and Netflix (the reference, or intercept, variable) is within the given confidence interval range.
The 95% confidence interval [-19.043264, -16.124430] for exclusive_prime_video means that we can be 95% confident that the estimated difference in Rotten Tomatoes scores between exclusive shows on Prime Video and Netflix (the reference, or intercept, variable) is within the given confidence interval range.
The 95% confidence interval [52.019703, 53.415572] for the intercept (which represents the exclusive_netflix column) shows that we can be confident that the estimated Rotten Tomato score for exclusive Netflix shows is within the given confidence interval range.
Hypothesis #2: P-Values
The intercept p-value is 0.001 which represents the p-value for exclusive Netflix shows. For exclusive shows on Prime Video and Disney Plus, we calculated a p-value of 0.001 whereas exclusive shows on Hulu had a p-value of 0.02. Since the p-values for exclusive shows on all 4 platforms are less than the significance level indicated by \(\alpha\) = 0.05, we are able to reject the null hypothesis (there is no difference in quality of the exclusive shows between the four platforms). This means that there was convincing evidence that would favor the alternative hypothesis which indicates that there is a difference in quality of the exclusive shows between the four platforms (measured through Rotten Tomatoes scores).
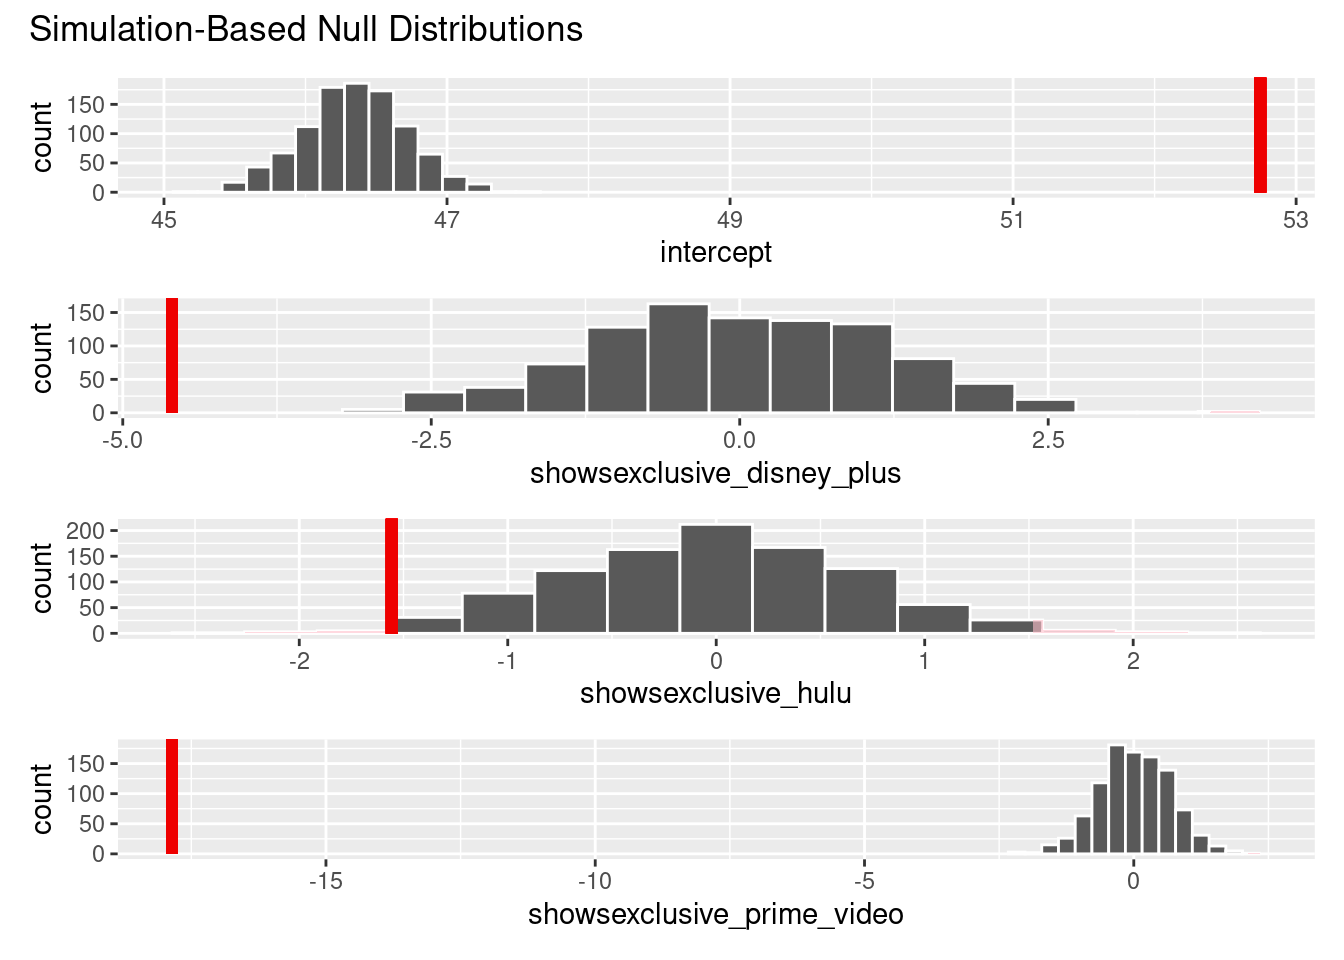
Hypothesis #2: Simulation-Based Null Distributions Visualization
The visualizations of exclusive_disney_plus, exclusive_prime_video, exclusive_hulu, and the intercept display the null distribution in reference to the p-value (the red line). A null distribution that is far from the p-value (as seen in exclusive_prime_video, exclusive_disney_plus, and the intercept) indicates that the observed difference in ratings between the four platforms is larger than what would be expected under the null hypothesis. Hence, the p-value is small because the observed difference is unlikely to be due to chance. Additionally, we can also reasonably say that, in the case of exclusive_hulu, because the red line is on the edge of the graph, it likely means that the p-value is very small; similarly to what was previously mentioned, this thus indicates that the observed difference is unlikely to be due to chance if the null hypothesis were true. Hence, this suggests strong evidence against the null hypothesis in favor of the alternate hypothesis.
Extra Note:
We recognize that, in interpreting our results, a post-hoc analysis might’ve been beneficial to use in addition to an ANOVA test to more accurately draw conclusions from our data. In that case, the ANOVA (Analysis of Variance), would be used to test whether there are statistically significant differences between the means of two or more groups (i.e. between exclusive_disney_plus, exclusive_prime_video, exclusive_hulu, and the exclusive_netflix). If a significant difference is found, a post-hoc test like Tukey’s HSD (Honestly Significant Difference) would be utilized to determine which groups in particular are significantly different from each other. However, due to the fact that this was not included in the scope of this course, we decided to omit these tests and instead only perform our traditional hypothesis tests, as seen above.
Further Conclusions:
In the context of our overall analysis of the “streaming wars” between the most popular streaming platforms in our current pop culture, our hypothesis testing indicates that there are likely platforms that are of higher quality than the others (looking at the point estimates of the second hypothesis test it indicated a specific order based on Rotten Tomato ratings (from highest to lowest: Netflix, Disney Plus, Hulu, Prime Video)), although we are unable to specifically locate which one due to the scope of our data analysis. Ultimately, we are able to confidently reject both null hypotheses. The average Rotten Tomatoes score of exclusive shows is greater than the average Rotten Tomatoes score of non-exclusive shows across all four platforms. Moreover, there is some sort of difference in ratings between the exclusive shows on each of the four platforms.
This could suggest that the platforms are investing in exclusive content that is of higher quality than their non-exclusive offerings; they may need to do so in order to remain competitive and retain subscribers. This also implicates the beginning of a new trend in the streaming industry as platforms might turn to exclusively producing their own shows (like a TV network) as a way to maximize profits and appeal to new subscribers to join their platform (as exclusive shows can only be streamed on one specific platform) instead of relying on the popularity of non-exclusive shows that can be accessed on a multitude of platforms.
Limitations
The first limitation is that our study right now just focuses on the quality of exclusive shows based on their rating scores (Rotten Tomatoes), which may not be a comprehensive measure of the quality of exclusive shows or non-exclusive shows on each platform. The analysis’s focus on Rotten Tomatoes ratings alone may not fully capture the perceived quality of exclusive shows on each platform. Moreover, considering the ratings of exclusive shows and not non-exclusive shows could limit the overall understanding of the quality of each platform’s content.
The second limitation is that we could not find any reliable and consistent dataset for the popularity, preferences, viewerships, viewing rates, or the number of subscribers of each platform, which could also affect the audiences’ perceived quality and critical reception, limiting our study to find the relationship between the quality of exclusive shows or non-exclusive shows and the preference of platforms. This is a result of the competitiveness in the streaming industry. Companies’ revenue almost entirely depends on subscriptions, and some of them are less active in publishing them. Additionally, some of the viewership data we find are using different metrics and, therefore, cannot be used to generate inferences. We can try to find a more comprehensive dataset that includes more variables which we could include in our analysis to reduce bias of confounding variables in hypothesis testing. We could also join dataset with those information.
The third limitation of our study is that there are unbalanced amounts of exclusive shows on each platform; for example, Netflix has significantly larger data of exclusive shows compared to the other platforms, which may affect the overall quality comparison between platforms. Disney Plus is a relatively new platform and has a smaller library of exclusive shows, which may limit the analysis. These unbalanced amounts of exclusive shows on each platform may introduce bias and affect the conclusions we can draw from our analyses.
The fourth limitation is that our analysis plan uses tomato scores to represent quality. This definition could have some biases. Firstly, the tomato score is a critics rating rather than an audience rating. Many movies and shows have a target audience that is better or worse represented than the other. Critics might inadvertently bring bias into their rating, and subsequently, our definition of quality could be biased as well. In addition, some shows that are watched by fewer people are less rated with tomato score, making the score easily influenced by a few critics, and therefore create bias in the definition of quality.
The fifth limitation is that our analysis does not account for the different types or genres of exclusive shows on each platform, such as comedies, documentaries, actions, etc., which may have different average ratings. We would have better insights if we had more data about the genres to compare shows of similar types across platforms rather than just looking at the overall average ratings.
The sixth limitation is that we do not take into account the number of views of each show across all platforms. This is a crucial factor in determining the quality of both exclusive and non-exclusive shows, as it can be a game-changer along with ratings. Many viewers may not rate a show after watching it, so the number of views plays an important role in determining if a show is popular or not, which affects its quality since quality is not solely determined by ratings.
The seventh limitation is that our data does not include the cost of subscription for each platform. For example, suppose a particular platform has a higher subscription cost. In that case, viewers may have higher expectations for the quality of the content they are paying for and may be more likely to rate shows negatively if they feel they are not getting their money’s worth. Alternatively, if a platform has a lower subscription cost, viewers may be more forgiving of lower-quality content or may rate shows more positively if they feel they are getting a good deal. Additionally, subscription costs can also impact the target audience of a particular platform, as viewers with different budgets may be more likely to subscribe to platforms with lower costs. Overall, it’s important to consider the cost of subscriptions when analyzing the quality of shows across different platforms.
Moreover, there are some other possible variables to consider in the study. The first one is release dates. Media critics have varied opinion on whether the movie/show release year has an relationship with quality or scores of a show. Setting this aside, another way the release date could impact our study is that eariler realsed shows could have a lower possibility of being exclusive, because media exclusiveness isn’t prevalent before Netflix decided to produce its own shows. Therefore, the release year could have an impact on both the exclusiveness and their quality. Similarly, the production budget for each show could be confounding as well, because exclusive shows typically require more budget to produce than non-exclusive shows. Shows with more budget could also provide a better visual experience/hire better actors and thus have an impact on tomato scores. We tried to account these factors but each platforms have a different policy of releasing their data and many of the data aren’t typically released to outside the companies.