Introduction
In the NBA (National Basketball Association), there are a variety of awards and accolades used to celebrate individual players accomplishments, such as the Defensive Player of the Year, Most Valuable Player, and Rookie of the Year. As a result, these awards are used alongside individual statistics by fans, players, and media pundits alike in debates over which players are better than others. However, there is rarely any discussion over which position is the best, or most impactful, in the league. As a result, we sought to conduct a data analysis on every player to play a game during the 2020-2021 NBA season to draw conclusions on which of the five positions, if any has the largest impact, based on the highest cumulative offensive statistics such as points per game, assists per game, offensive rebounds per game and turnovers per game. We selected just one season to focus on due to the difficulties of comparing multiple datasets for different seasons of the NBA. Our null hypothesis is that all NBA player positions are equally impactful based on the cumulative average of the offensive statistics, and the alternative hypothesis is that at least one position is more impactful than the others using the same metrics.
A brief summary of our results:
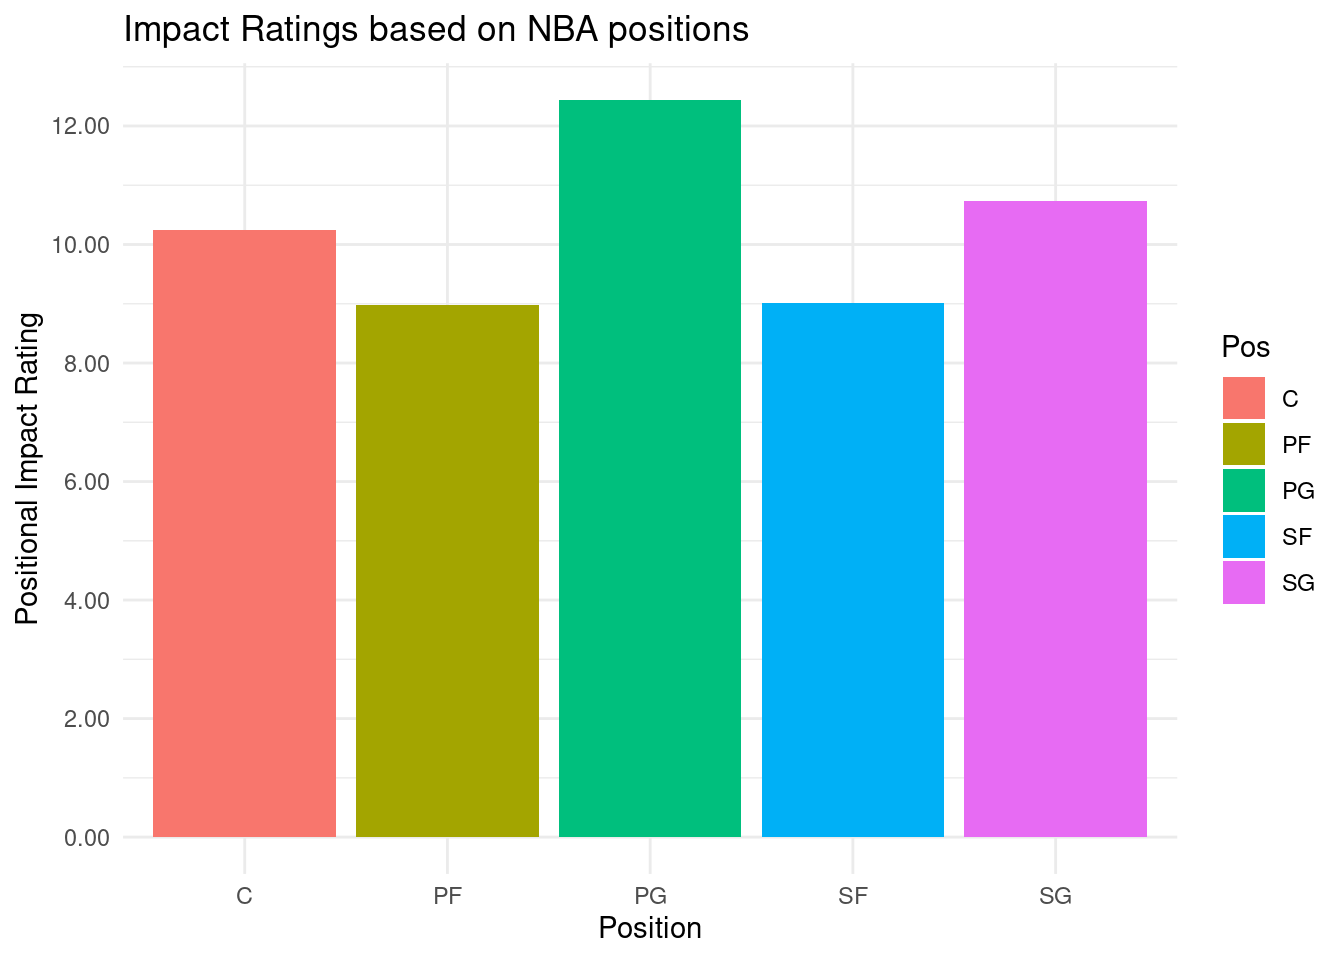
Point guards had the highest Positional Impact Rating across all positions and power forwards had the lowest with ratings of 12.44 and 8.97, respectively.
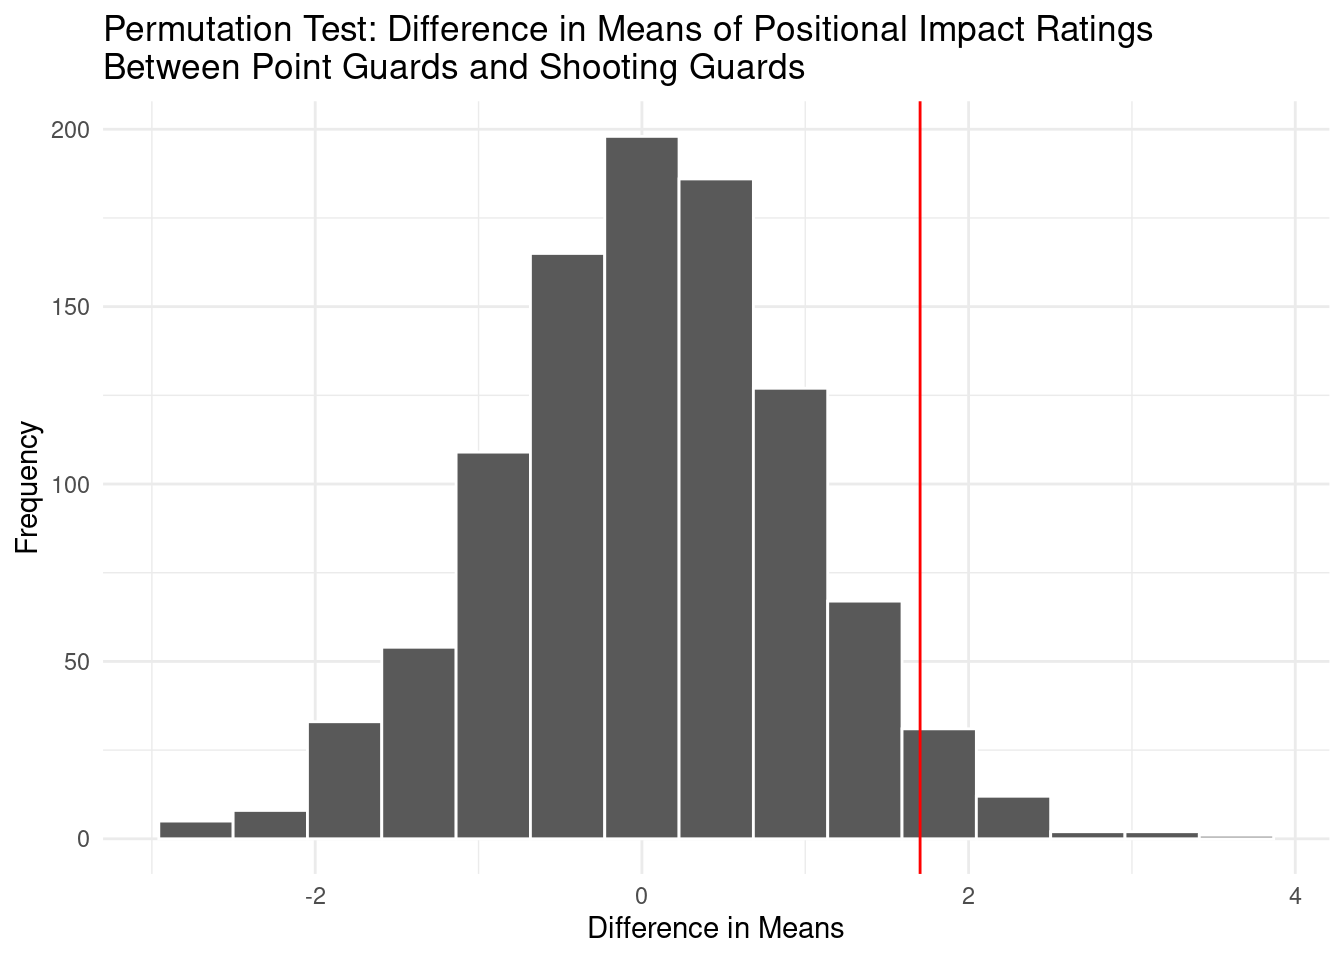
A hypothesis test comparing the means of the positional impact ratings of point guards and shooting guards generated a p-value of 0.72, meaning that there isn’t a statistically significant difference amongst the impact of the two positions. As a result, there is no difference between the offensive impacts of the two positions.
Data description
── Attaching packages ─────────────────────────────────────── tidyverse 1.3.2 ──
✔ ggplot2 3.4.0     ✔ purrr   1.0.0
✔ tibble  3.2.1     ✔ dplyr   1.1.2
✔ tidyr   1.2.1     ✔ stringr 1.5.0
✔ readr   2.1.3     ✔ forcats 0.5.2
── Conflicts ────────────────────────────────────────── tidyverse_conflicts() ──
✖ dplyr::filter() masks stats::filter()
✖ dplyr::lag()    masks stats::lag()
── Attaching packages ────────────────────────────────────── tidymodels 1.0.0 ──

✔ broom        1.0.2     ✔ rsample      1.1.1
✔ dials        1.1.0     ✔ tune         1.1.1
✔ infer        1.0.4     ✔ workflows    1.1.2
✔ modeldata    1.0.1     ✔ workflowsets 1.0.0
✔ parsnip      1.0.3     ✔ yardstick    1.1.0
✔ recipes      1.0.6

── Conflicts ───────────────────────────────────────── tidymodels_conflicts() ──
✖ scales::discard() masks purrr::discard()
✖ dplyr::filter()   masks stats::filter()
✖ recipes::fixed()  masks stringr::fixed()
✖ dplyr::lag()      masks stats::lag()
✖ yardstick::spec() masks readr::spec()
✖ recipes::step()   masks stats::step()
• Use tidymodels_prefer() to resolve common conflicts.
Data summary
| Name |
nba_clean |
| Number of rows |
690 |
| Number of columns |
21 |
| _______________________ |
|
| Column type frequency: |
|
| character |
3 |
| numeric |
18 |
| ________________________ |
|
| Group variables |
None |
Variable type: character
| Player |
0 |
1 |
7 |
24 |
0 |
540 |
0 |
| Pos |
0 |
1 |
1 |
2 |
0 |
5 |
0 |
| Tm |
0 |
1 |
3 |
3 |
0 |
31 |
0 |
Variable type: numeric
| Age |
0 |
1.00 |
25.89 |
4.12 |
19.0 |
23.00 |
25.00 |
28.00 |
40.0 |
▇▇▅▂▁ |
| G |
0 |
1.00 |
37.17 |
21.34 |
1.0 |
18.00 |
37.00 |
57.00 |
72.0 |
▆▆▆▆▇ |
| GS |
0 |
1.00 |
16.91 |
21.63 |
0.0 |
0.00 |
5.00 |
29.00 |
72.0 |
▇▁▁▁▁ |
| MP |
0 |
1.00 |
19.43 |
9.19 |
1.8 |
12.50 |
19.25 |
26.90 |
37.6 |
▅▇▇▆▅ |
| fg_pct |
2 |
1.00 |
0.44 |
0.11 |
0.0 |
0.40 |
0.44 |
0.50 |
1.0 |
▁▃▇▁▁ |
| threep_pct |
34 |
0.95 |
0.31 |
0.13 |
0.0 |
0.27 |
0.34 |
0.39 |
1.0 |
▂▇▂▁▁ |
| twop_pct |
6 |
0.99 |
0.51 |
0.13 |
0.0 |
0.46 |
0.51 |
0.57 |
1.0 |
▁▁▇▂▁ |
| efg_pct |
2 |
1.00 |
0.51 |
0.11 |
0.0 |
0.48 |
0.52 |
0.56 |
1.0 |
▁▁▇▁▁ |
| ft_pct |
29 |
0.96 |
0.75 |
0.15 |
0.0 |
0.69 |
0.78 |
0.84 |
1.0 |
▁▁▂▇▇ |
| ORB |
0 |
1.00 |
0.81 |
0.73 |
0.0 |
0.30 |
0.60 |
1.00 |
4.7 |
▇▂▁▁▁ |
| DRB |
0 |
1.00 |
2.78 |
1.83 |
0.0 |
1.50 |
2.50 |
3.70 |
10.1 |
▇▇▃▁▁ |
| TRB |
0 |
1.00 |
3.58 |
2.40 |
0.0 |
1.90 |
3.10 |
4.80 |
14.3 |
▇▇▂▁▁ |
| AST |
0 |
1.00 |
1.94 |
1.83 |
0.0 |
0.70 |
1.40 |
2.50 |
11.7 |
▇▂▁▁▁ |
| STL |
0 |
1.00 |
0.61 |
0.39 |
0.0 |
0.30 |
0.60 |
0.90 |
2.1 |
▇▇▅▁▁ |
| BLK |
0 |
1.00 |
0.42 |
0.41 |
0.0 |
0.10 |
0.30 |
0.60 |
3.4 |
▇▂▁▁▁ |
| TOV |
0 |
1.00 |
1.08 |
0.82 |
0.0 |
0.50 |
0.90 |
1.40 |
5.0 |
▇▃▁▁▁ |
| PF |
0 |
1.00 |
1.62 |
0.76 |
0.0 |
1.10 |
1.60 |
2.10 |
4.0 |
▃▇▇▃▁ |
| PTS |
0 |
1.00 |
8.62 |
6.30 |
0.0 |
4.00 |
7.20 |
11.70 |
32.0 |
▇▆▂▁▁ |
The tidied dataset nba_clean has 690 observations and 21 attributes. Each observation represents every player to play a game during the 2020-2021 season. Note that only 540 players played this season, but as some players played for multiple teams (due to being traded or released), they have different stats for different teams, leading to 690 observations. Each attribute represents a different characteristic of the player, such as their team, position(point guard, shooting guard, small forward, power forward, and center), turnovers per game, points per game, field goal percentage(their average percentage of shots scored compared to total attempts), 3 point percentage, effective field goal percentage (an adjusted field goal percentage that accounts for three pointers being more valuable than two pointers), and free throw percentage.
This dataset was created for people all over the world to be able to see every NBA player’s statistics and information in one convenient web page so fans can examine as well as compare players. This dataset was primarily created by an independent journalist named Sean Lahman with help from other journalists and NBA historians. The data was gathered from SportRadar, the NBA’s official statistics provider. NBA players, the ones whose data comprises the dataset, are aware that the NBA collects statistical data from them and makes this public for everyone to be able to compare players.
Data analysis
# A tibble: 5 × 10
  Pos   mean_ppg mean_apg mean_rpg mean_efg mean_fgp mean_threep_pct mean_ftpct
  <chr>    <dbl>    <dbl>    <dbl>    <dbl>    <dbl>           <dbl>      <dbl>
1 C         8.37     1.29    1.64     0.546    0.519           0.243      0.695
2 PF        7.56     1.50    0.842    0.508    0.442           0.314      0.732
3 PG        9.86     3.56    0.452    0.485    0.416           0.339      0.797
4 SF        7.81     1.42    0.660    0.504    0.426           0.330      0.754
5 SG        9.39     1.97    0.452    0.498    0.412           0.334      0.782
# ℹ 2 more variables: mean_tov <dbl>, mean_disp <dbl>
To answer our research question, we created a new variable, positional impact rating, which is the sum of the mean points per game, assists per game, and offensive rebounds per game with mean turnovers per game subtracted from this sum. These are the most important offensive statistics and as turnovers are a negative statistic, this value is subtracted from the total. By looking at the graph, it is clear that the point guard position has the highest positional impact rating. The shooting guard and center position have the next two highest ratings, and the power forward and small forward have the lowest ratings.
# A tibble: 5 × 5
  term        estimate std.error statistic  p.value
  <chr>          <dbl>     <dbl>     <dbl>    <dbl>
1 (Intercept)   10.2       0.615    16.7   1.31e-52
2 PosPF         -1.27      0.862    -1.47  1.42e- 1
3 PosPG          2.19      0.884     2.48  1.34e- 2
4 PosSF         -1.22      0.903    -1.36  1.76e- 1
5 PosSG          0.490     0.838     0.585 5.59e- 1
We also created a linear model to predict the positional impact rating for each position. The center position is expected, on average, to have a positional impact value of 10.244. The power forward position is expected, on average, to have a positional value that is 1.267 less than the Center position’s. The small forward position is expected, on average, to have a positional value that is 1.224 less than the Center position’s. The shooting guard position is expected, on average, to have a positional value that is 0.490 more than the Center position’s. The point guard position is expected, on average, to have a positional value that is 2.193 more than the Center position’s.
geom_smooth: na.rm = FALSE, orientation = NA, se = TRUE
stat_smooth: na.rm = FALSE, orientation = NA, se = TRUE, method = lm
position_identity
Evaluation of significance
# A tibble: 1 × 1
  p_value
    <dbl>
1   0.072
The p-value is .072, and the observed difference in means is 1.70.
Interpretation and conclusions
We conducted a hypothesis test with 1000 repetitions to compare the means of the positional impact ratings between point guards and shooting guards. We chose these two positions in order to perform a difference in means calculation with two groups. These positions are very similar to each other in terms of offensive production, and thus are expected to have similar positional impact ratings. The observed difference in means was 1.703048. The p-value obtained from the test was 0.072. Since this value is greater than .05, we fail to reject the null hypothesis, concluding that there is no significant difference in the means of the cumulative offensive statistics between point guards and shooting guards. From this we are able conclude that the point guard and shooting guard positions are statistically the same in terms of offensive impact.
Limitations
The first potential limitation that could interrupt our project is that our dataset is limited by the player data from the 2020-2021 season, as that is the only season our dataset contains. Therefore, our project cannot exceed that season to explore comparisons between seasons. We cannot delve deeper to ensure our findings are consistent over years of data. That deeper analysis would ensure our findings were correct and irrefutable.
Another limitation of this dataset is that not all players have data for all categories. This can cause the limitation of skewing our findings, such as producing lower or higher number in a specific category such as field goal percentage. This limitation could challenge the validity of our findings should other nba researchers review our project.
The largest limitation of our analysis is that our positional impact rating doesn’t include metrics for efficiency such as field goal percentage and three point percentage. These efficiency metrics are important ways to measure a player’s impact, but our rating doesn’t include these variables because they are percentages and the other statistics are counting stats. It’s possible that the positional impact rating included these variables there would be a statistically significant difference across positions.
Acknowledgments
We would like to thank Sean Lahman and Basketball-reference.com who carefully constructed this dataset using the NBA’s data provided by SportRadar. Additionally, we would like to thank our TA, Chi-Jung Lee who gave us feedback throughout this process as well as the Phenomenal Buneary and Evee teams who reviewed our draft report and gave us constructive feedback.