1. How do factors such as gender, income, housing, children, etc. affect whether an individual pays their credit card in time?
2. Is there a correlation between paying off credit cards and age?
3. What is the relationship between income and paying off credit cards in time?
4. How is employment length related to paying off credit cards in time?
5. What is the relationship between single/not married and married people paying off their credit cards?
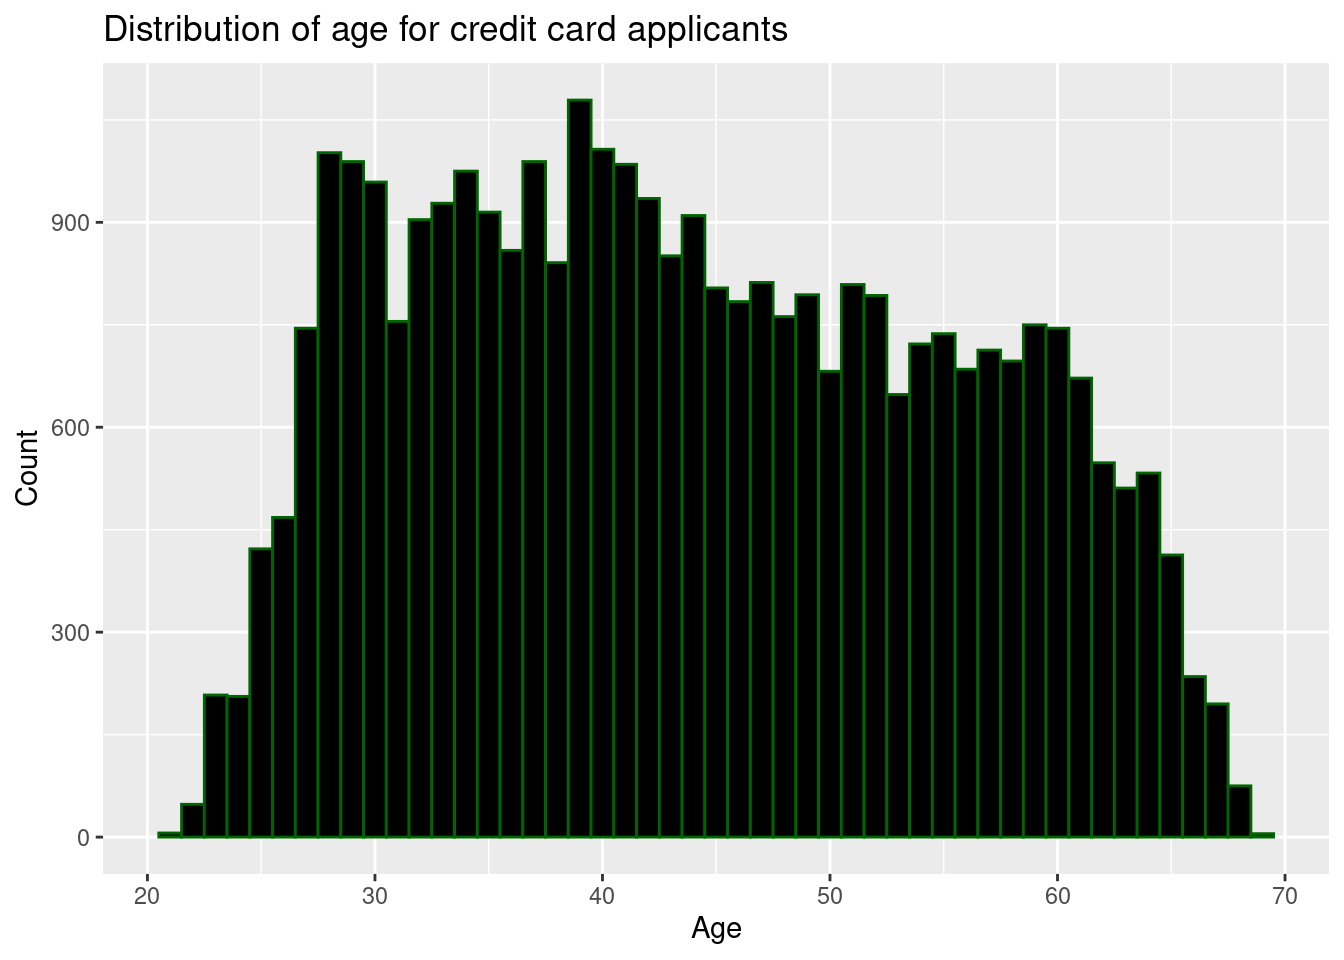
6. What is the distribution for ages of people who apply for credit cards?
Data collection and cleaning
Have an initial draft of your data cleaning appendix. Document every step that takes your raw data file(s) and turns it into the analysis-ready data set that you would submit with your final project. Include text narrative describing your data collection (downloading, scraping, surveys, etc) and any additional data curation/cleaning (merging data frames, filtering, transformations of variables, etc). Include code for data curation/cleaning, but not collection.
Rows: 438557 Columns: 18
── Column specification ────────────────────────────────────────────────────────
Delimiter: ","
chr  (8): CODE_GENDER, FLAG_OWN_CAR, FLAG_OWN_REALTY, NAME_INCOME_TYPE, NAME...
dbl (10): ID, CNT_CHILDREN, AMT_INCOME_TOTAL, DAYS_BIRTH, DAYS_EMPLOYED, FLA...

ℹ Use `spec()` to retrieve the full column specification for this data.
ℹ Specify the column types or set `show_col_types = FALSE` to quiet this message.
Rows: 1048575 Columns: 3
── Column specification ────────────────────────────────────────────────────────
Delimiter: ","
chr (1): STATUS
dbl (2): ID, MONTHS_BALANCE

ℹ Use `spec()` to retrieve the full column specification for this data.
ℹ Specify the column types or set `show_col_types = FALSE` to quiet this message.
merged_data <-merge(application_cred, credit_record, by ="ID") credit_app<- merged_data |>select(-FLAG_MOBIL, -FLAG_WORK_PHONE, -FLAG_EMAIL, -OCCUPATION_TYPE) |>filter(STATUS !="X", STATUS !="NA")|>mutate(new_age_years = (-1* DAYS_BIRTH) /365,new_employment_years = (-1* DAYS_EMPLOYED) /365,new_age_years =round(new_age_years),new_employment_years =round(new_employment_years),new_employment_years =replace(new_employment_years, new_employment_years ==-1001, 0),STATUS =case_when( STATUS =="C"~"On Time", STATUS =="0"~"OverDue", STATUS =="1"~"OverDue", STATUS =="2"~"OverDue", STATUS =="3"~"OverDue", STATUS =="4"~"OverDue") ) |> janitor::clean_names()|>select(-days_birth, -days_employed, -flag_phone, -cnt_fam_members)credit_app <-distinct(credit_app, id, .keep_all =TRUE)
Data Cleaning Explanation: We began by importing the data using read_csv(). Then, we merged the data from application_cred and credit_record by the ID. Then, we created credit_app from merged_data. Then, we eliminated the following columns using the select() function: FLAG_MOBIL, FLAG_WORK_PHONE, FLAG_EMAIL, OCCUPATION_TYPE. Then, we filtered out the “NA” and “X” values. The next problem we encountered with the data was that the birthday values were formatted in the following way: “Count backwards from current day (0), -1 means yesterday”. Clearly, this is confusing so we used mutate to create new_age_years to calculate and round the appropriate age. The next issue we encountered in the dataset was that the amount of time worked was formatted in a similar way: Count backwards from current day(0). This was also not conducive to plotting and visualizing the data so we mutated it to create new_employment_years to represent the rounded appropriate number of years. Then, we classified the credit approval based on the status, rating it as “On Time” or “Overdue”. Then we did “janitor::clean_names()\|\>” in order to clean the names in the data frame. The last step of the data tidying and cleaning was to use the select() function once again to eliminate the following columns: days_birth, days_employed, flag_phone, cnt_fam_members.
Data description
Have an initial draft of your data description section. Your data description should be about your analysis-ready data.
The data is about information extracted from credit card applicants and what factors go into whether or not a credit application gets approved or not which is a common risk control method in the financial industry. The first column of the data set includes an “ID number” which an identifier to an individual who filled out the application. The reason this is a number instead of a name is because their information is meant to be kept private. The next columns include variables such as gender, ownership of a vehicle, annual income, education, marital status, and other categorical and numerical variables. There were two data sets originally, but after we merged them, we were able to extract the information about the status of that person’s credit card debt and whether they paid on time or are overdue. Using that information we will compare it to other factors that are weighted when looking at credit card applicants.
Data limitations
A limitation was the fact that we do not know whether an applicant was approved or not. This data set is meant to be used for predictions so giving us the information of their success would undermine the whole idea, but this means that we need to analyze the relationship of other variables such as how marital status affects whether someone pays off their cards on time.
Another limitation seen in the data is that there are a lot of categorical variables, and limited numerical variables. The only numerical variables are the number of children and the annual income of the individual. Thus, it may be difficult to do a linear or logistic regression and relate it to the credit card application.
Exploratory data analysis
Perform an (initial) exploratory data analysis.
credit_app |>mutate(name_family_status =as.factor(name_family_status),name_family_status =fct_relevel(.f = name_family_status,"Marrried", "Single/ not married","Civil marriage", "Seperated", "Widow") ) |>ggplot(data = credit_app, mapping =aes(x = name_family_status, fill = status)) +geom_bar()+labs(title ="Relationship between Marriage Status and Credit card payments",x ="Marriage Status",y ="Count" )
ggplot(credit_app, mapping =aes(x = new_age_years))+geom_histogram(binwidth =1, fill ="black", color ="darkgreen")+labs(title ="Distribution of age for credit card applicants",x ="Age",y ="Count" )
Questions for reviewers
List specific questions for your peer reviewers and project mentor to answer in giving you feedback on this phase.
When we were doing the data cleaning, we noticed that there are duplicated id’s. Although it is the same person with the only information different being the status and months_balance, we were wondering whether we should find a way to consolidate their information to remove all of the duplicates?
We removed all of the variables we thought would be useless to our research questions, but there are a couple that would be useful and are still considering to look at in the future. Should we remove them completely or leave them there?